When your application interacts with NoSQL databases, slow operations, high request volumes, or exceptions can degrade overall performance. The NoSQL Invocation page in Application Real-Time Monitoring Service (ARMS) surfaces these issues by tracking every NoSQL call your application makes, so you can identify bottlenecks and resolve them.
With this page, you can:
Monitor request volume, response time, and slow calls for each NoSQL invocation.
Identify which statements are slow or generating the most load.
Investigate exception trends and drill into individual failures.
Trace individual NoSQL operations through traces.
The page is organized into four tabs:
| Tab | What you can do |
|---|---|
| Overview | View the topology, request volume, response time, slow calls, and HTTP status codes for a NoSQL invocation |
| Analysis of Sentences | Break down call performance by individual statement to find slow or high-volume operations |
| Exception Analysis | Investigate exception trends and drill into individual failures |
| Interface Snapshot | Search and inspect traces for individual NoSQL operations |
Prerequisites
Deploy application monitoring for your application.
Open the NoSQL invocation page
Log on to the ARMS console.
In the left-side navigation pane, choose Application Monitoring > Applications.
On the Applications page, select a region in the top navigation bar, then click the application name.
NoteIf the
 icon appears in the Language column, the application is connected to Application Monitoring. If a hyphen (-) appears, the application is connected to Tracing Analysis.
In the left-side navigation pane, click NoSQL Invocation.
The left-side list displays all NoSQL invocations for the current application. Click an invocation to view its details across the four tabs described below.
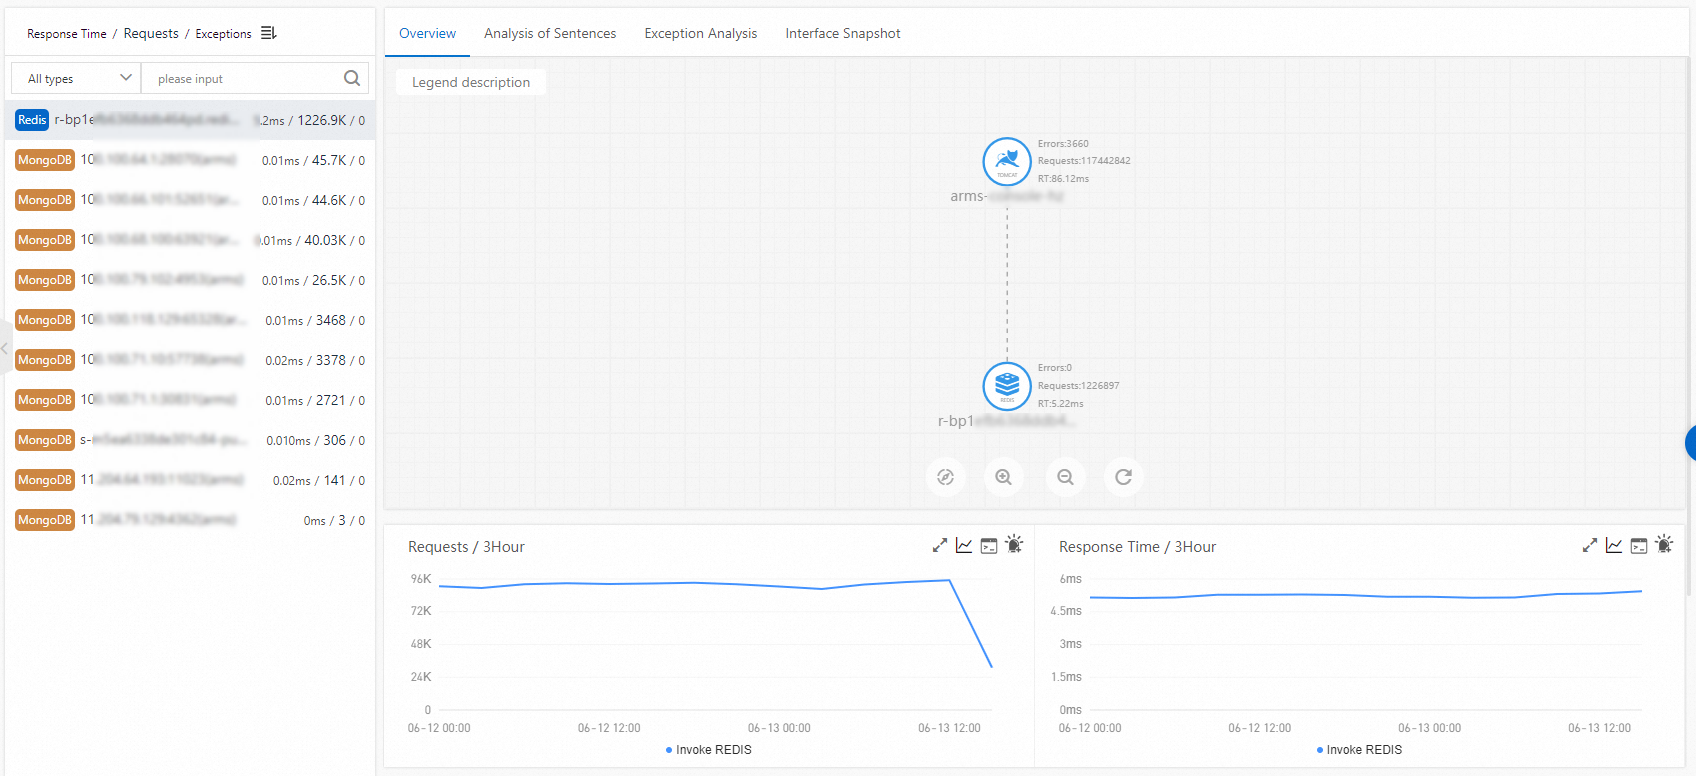
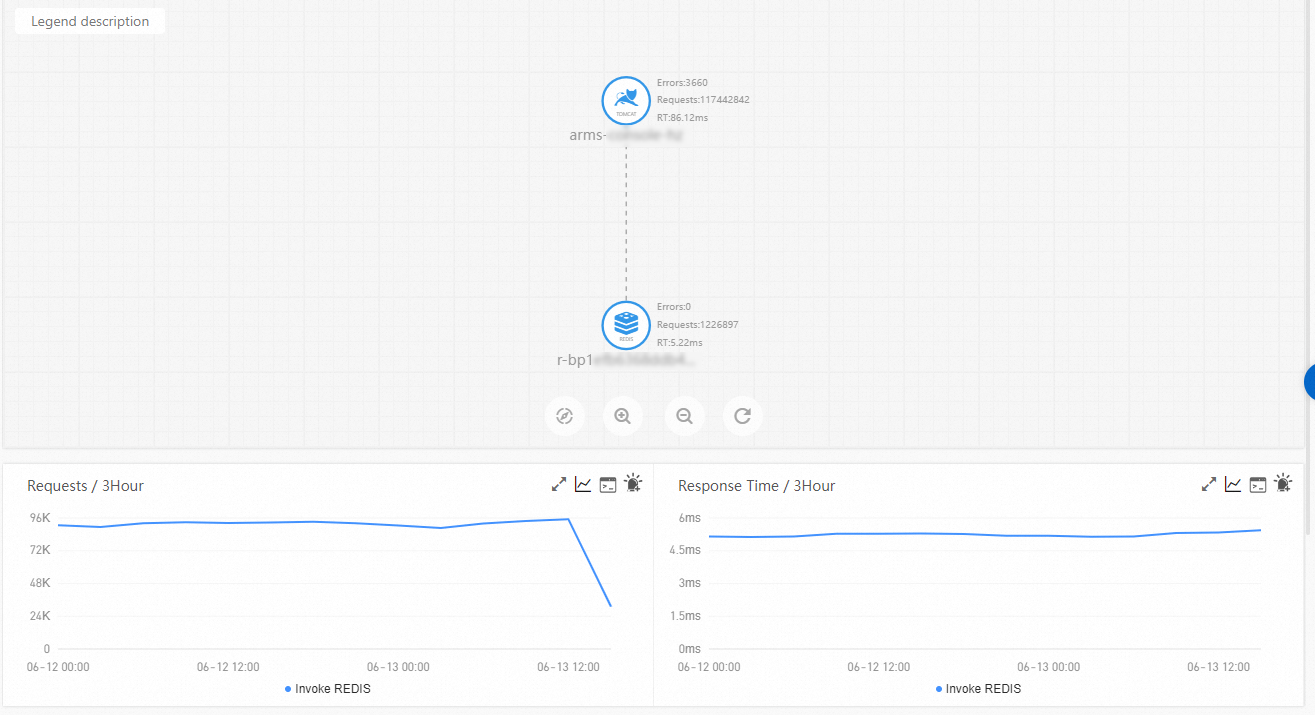
Overview
The Overview tab displays the topology of the selected NoSQL invocation along with metric curves for request count, response time, slow calls, and HTTP status codes.
Each metric curve supports the following interactions:
Hover over a data point to view its exact values.
Select a time range to view the specific statistics in the time range.
Click the
 icon to view the metric in a specific time range or compare values across different days.
Click the
 icon to view the API details for the metric.
Click the
 icon to create an alert rule for the metric. For more information, see Create and manage an alert rule in Application Monitoring (new).
Analysis of sentences
The Analysis of Sentences tab provides a statement-level breakdown of NoSQL call performance. It includes a column chart of call statistics, time series curves for response time, and a table listing individual SQL statements.
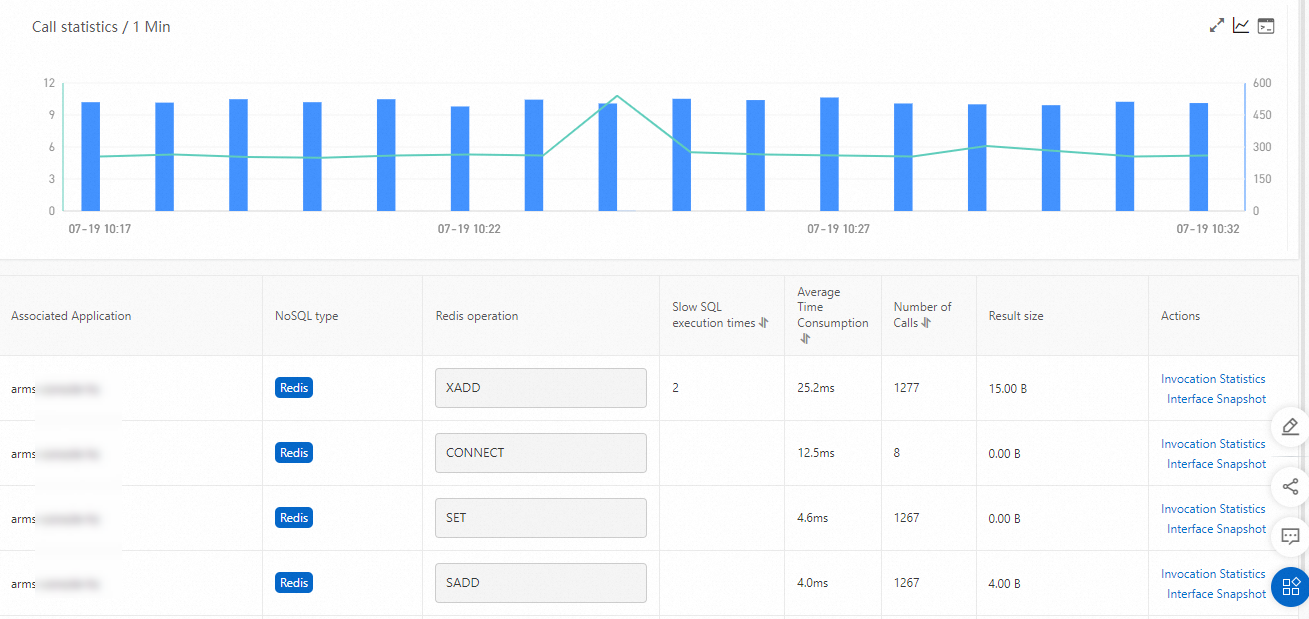
Use this tab to identify which specific SQL statements are slow or frequent:
Hover over a chart to view exact values at a specific point in time.
Click the
icon to view the metric in a specific time range or compare values across different days.Click the
icon to view the API details for the metric.In the SQL statement table, click Invocation Statistics in the Actions column to view the SQL invocation statistics for that statement.
Click Trace Query in the Actions column to view the traces associated with that statement. For details, see Interface snapshot.
Exception analysis
The Exception Analysis tab shows exception trends and details for the selected NoSQL invocation. Use this tab to identify failing operations and investigate root causes.
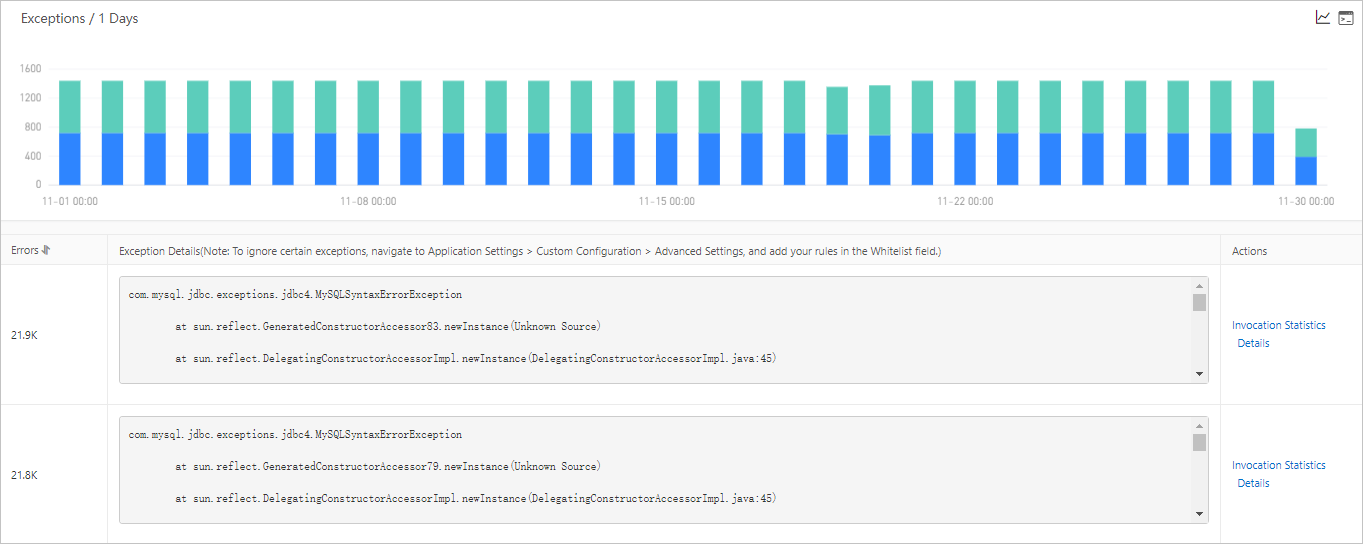
To filter which exceptions are displayed, go to Application Settings in the left-side navigation pane. On the Custom Configuration tab, locate the Advanced Settings section and configure the Whitelist field.
The charts and exception table support the following interactions:
Hover over a data point to view its exact values.
Select a time range to view the specific statistics in the time range.
Click the
icon to view the metric in a specific time range or compare values across different days.Click the
icon to view the API details for the metric.In the exception table, click Invocation Statistics in the Actions column to view call statistics for that exception.
Click Details in the Actions column to view the full exception details.
Interface snapshot
The Interface Snapshot tab lists all traces for the selected NoSQL invocation. Use this tab to drill into individual operations.
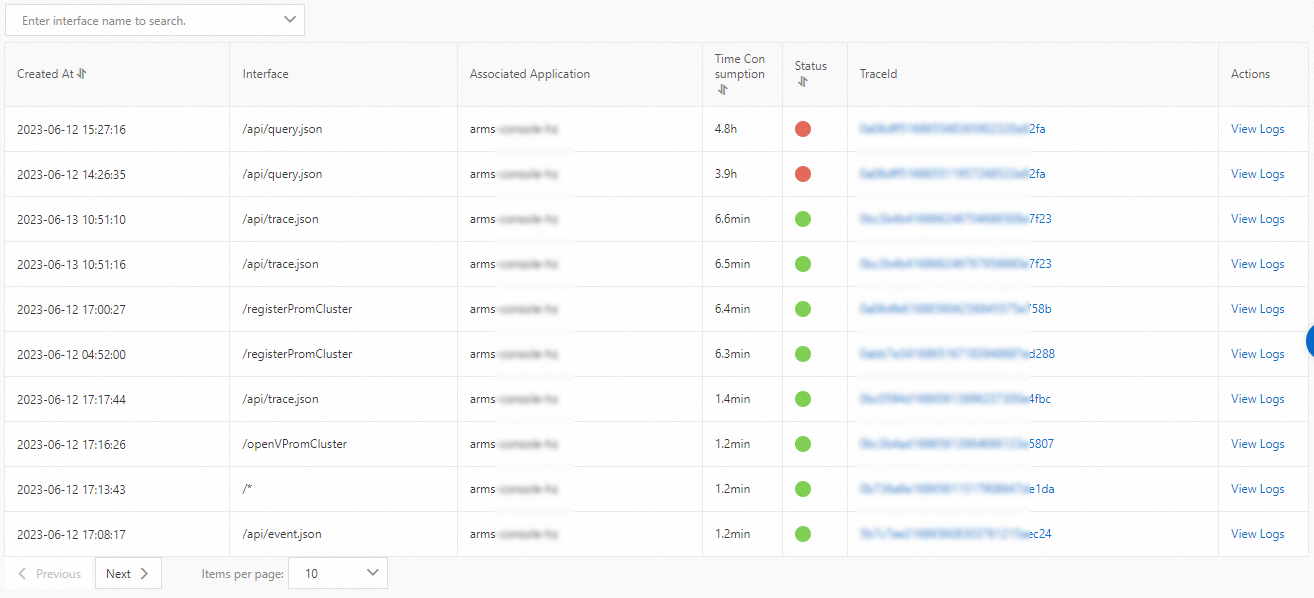
The trace list supports the following interactions:
Enter an API name in the search box and click the
 icon to filter traces.
Click a TraceId value to view the full trace details. For more information, see Trace details.
Click View Logs in the Actions column to view the business logs associated with that trace.
To use the View Logs feature, first associate trace IDs with your application's business logs. This enables you to access relevant logs directly from a trace when troubleshooting errors. For setup instructions, see Associate trace IDs with business logs.