You can use the host monitoring feature to collect the data of the CPU, memory, disks, load, network traffic, and network packets. This topic describes the host monitoring feature and how to view host monitoring metrics.
Procedure
Log on to the ARMS console. In the left-side navigation pane, choose .
On the Application List page, select a region in the top navigation bar and click the name of the application that you want to manage.
NoteIcons displayed in the Language column indicate languages in which applications are written.
 : Java application
 : Go application
 : Python application
Hyphen (-): application monitored in Managed Service for OpenTelemetry.
In the left-side navigation pane, click Application Details.
On the Application Details page, click the HOST Monitoring tab.
View host monitoring metrics
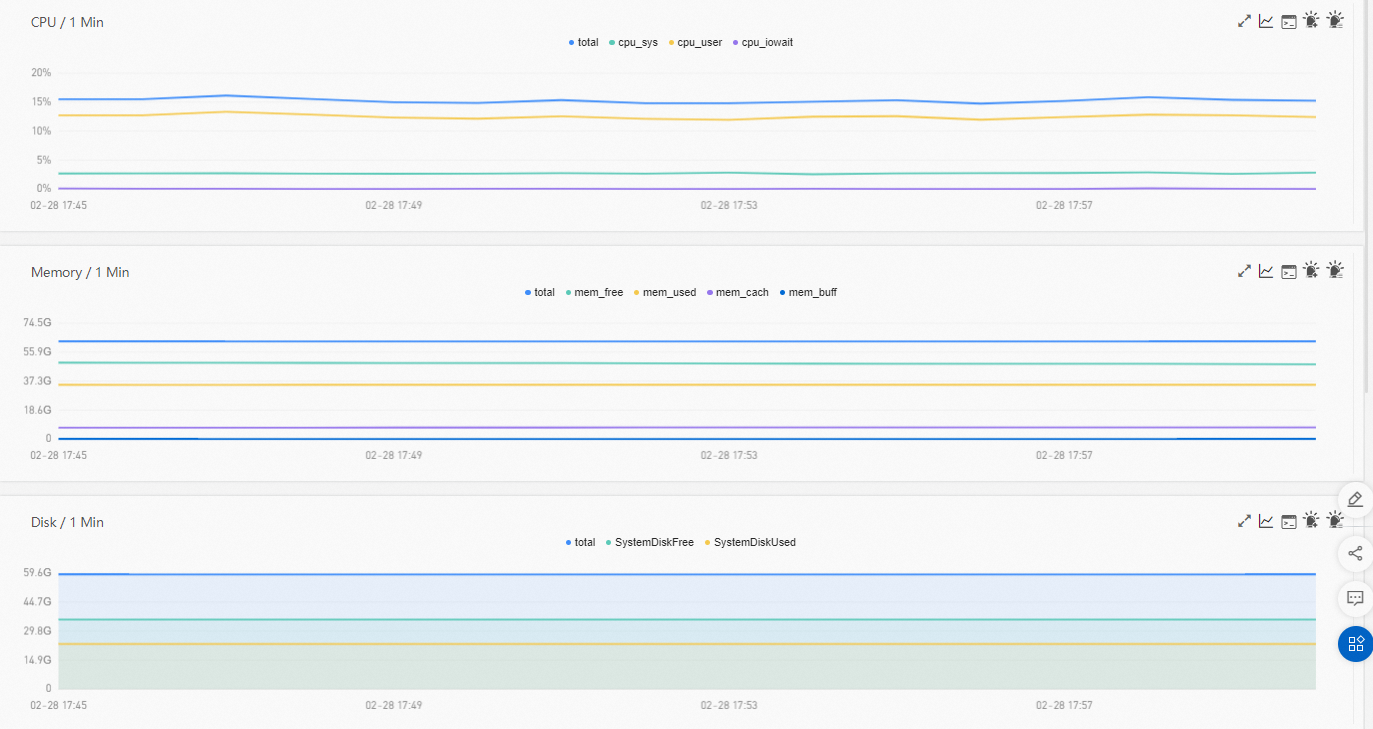
On the HOST Monitoring tab, you can view the time series curves of metrics that are related to the CPU, memory, disks, load, network traffic, and network packets.
You can click the name of a metric, such as the system CPU utilization, in a chart to show or hide the metric.
NoteEach chart must contain at least one visible metric. If only one metric is displayed in a chart, you cannot hide the metric.
You can click the line chart icon in the upper-right corner of a chart to view the metric trend in a specific time range, or compare metric trends in two time ranges.
You can click the View API icon in the upper-right corner of a chart to view the detailed information about the APIs that are related to the metrics.
In the upper-right corner of the monitoring panel, click the
 icon to create an alert rule or click the
  icon to view the existing alert rules based on which alerts are generated. For more information about how to create an alert rule, see Alert rules.
Metrics
You can use the host monitoring feature to monitor the following metrics:
CPU
Total CPU utilization
System CPU utilization
User CPU utilization
CPU utilization for I/O waiting
Physical memory
Total memory
Free memory
Used memory
Memory in PageCache
Memory in BufferCache
Disk
Total system disk space (bytes)
Free system disk space (bytes)
Used system disk space (bytes)
Load
System load
Network traffic
Received network traffic (bytes)
Sent network traffic (bytes)
Network packets
Received network packets per minute
Sent network packets per minute
Received network errors per minute
Discarded network packets per minute