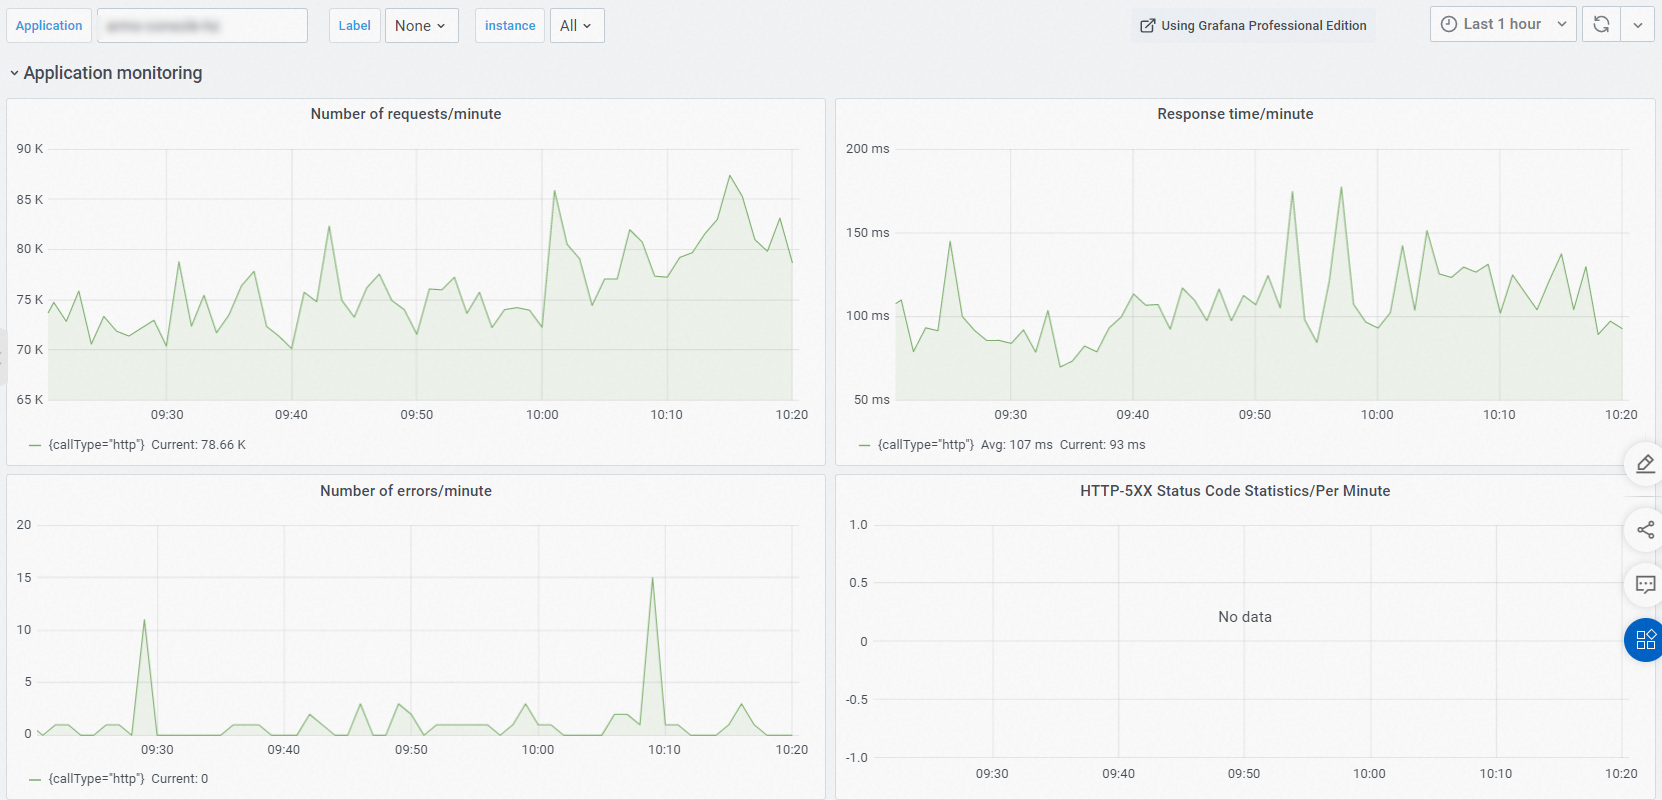
The Grafana view displays the metrics of Application Real-Time Monitoring Service (ARMS) Application Monitoring in Grafana. You can use custom tags to query the metrics that you want to display.
Data source
The data in the Grafana view is imported from the Prometheus data source that ARMS
automatically creates. The Prometheus data source allows you to view the metrics of
all your applications. You can view a Prometheus instance for Application Monitoring
in the same region as your application in the Prometheus instance list. For more information,
see View application monitoring dashboards in Prometheus.
Note The name of a Prometheus instance for Application Monitoring varies with the region.
For example, the name of a Prometheus instance for Application Monitoring in the China
(Beijing) region is arms_metrics_cn-beijing_cloud_beijing.
Procedure
- On the Grafana view page, you can add tags to query monitoring metrics. For information about how to
add tags, see Add and use tags.