You can use the external call feature of Application Real-Time Monitoring Service (ARMS) to locate slow calls or errors during the external calls of an application.
Procedure
- Log on to the ARMS console. In the left-side navigation pane, choose .
- On the Applications page, select a region in the top navigation bar and click the name of the application that you want to manage. Note If the
 icon is displayed in the Language column, the application is connected to Application Monitoring. If a hyphen (-) is displayed, the application is connected to Tracing Analysis.
 - In the left-side navigation pane, click External Calls. All external calls of the application are listed in the left-side pane of the External Calls page. You can sort the API calls by the response time, number of requests, number of errors, or number of exceptions.

Overview
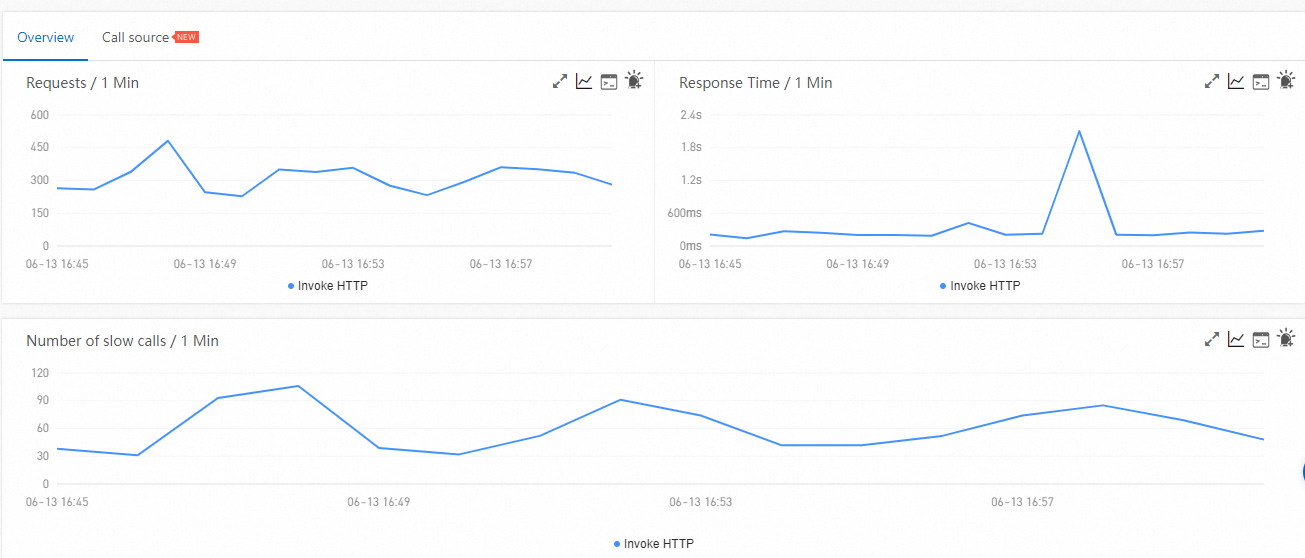
You can click an external call in the left-side pane to view the time series curves for the request count, response time, and error count of the external call on the Overview tab.

Call source
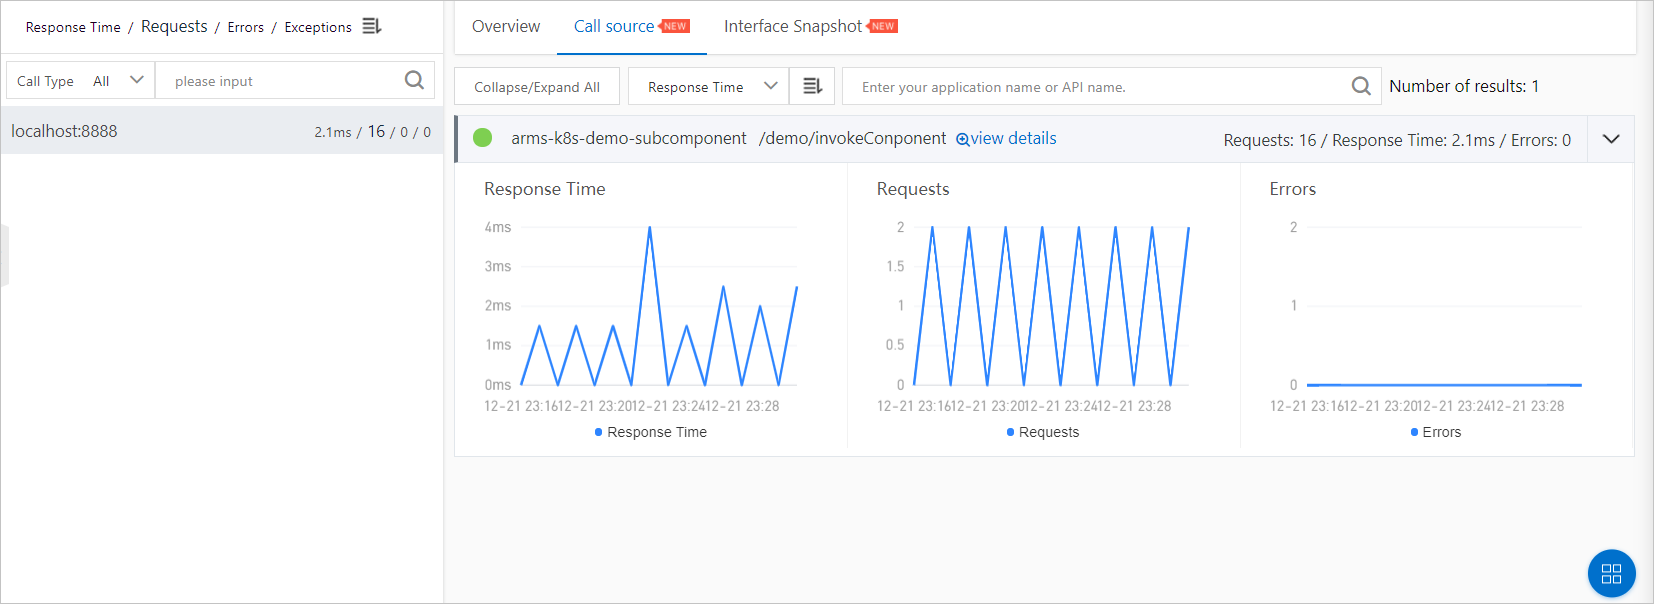
On the Call Source tab, view the time series curves for the response time, request count, and error count of all the API operations.

You can perform the following operations on the Call source tab:
- Click Expand/Collapse All in the upper part of the tab to show or hide all APIs.
- Enter a keyword of the application name or the API name in the search box and click the Search icon to search for the APIs whose names contain the keyword.
- If you want to show or hide the information about the performance metrics of an API, find the API and click the collapse panel or click the upward arrow or downward arrow at the end of the row.
- To view the traces of an API that is called by a call source, click view details next to the API. For more information, see View interface snapshots.