This topic describes how to view database calls to understand how your application interacts with a database. It covers the overview, SQL calls, exceptions, call sources, and the list of traces.
Prerequisites
Procedure
Log on to the ARMS console. In the left-side navigation pane, choose .
On the Application List page, select the region in the top navigation bar and then click the name of the application.
NoteIcons in the Language column have the following meanings:
 : a Java application connected to Application Monitoring.
 : a Golang application connected to Application Monitoring.
 : a Python application connected to Application Monitoring.
-: an application connected to Managed Service for OpenTelemetry.
-
In the left-side navigation pane, click Database Calls.
-
On the Database Calls page, select a database and specify a time range.
Overview
The Overview tab displays the database call topology, number of requests, response time, number of slow calls, and a performance summary.
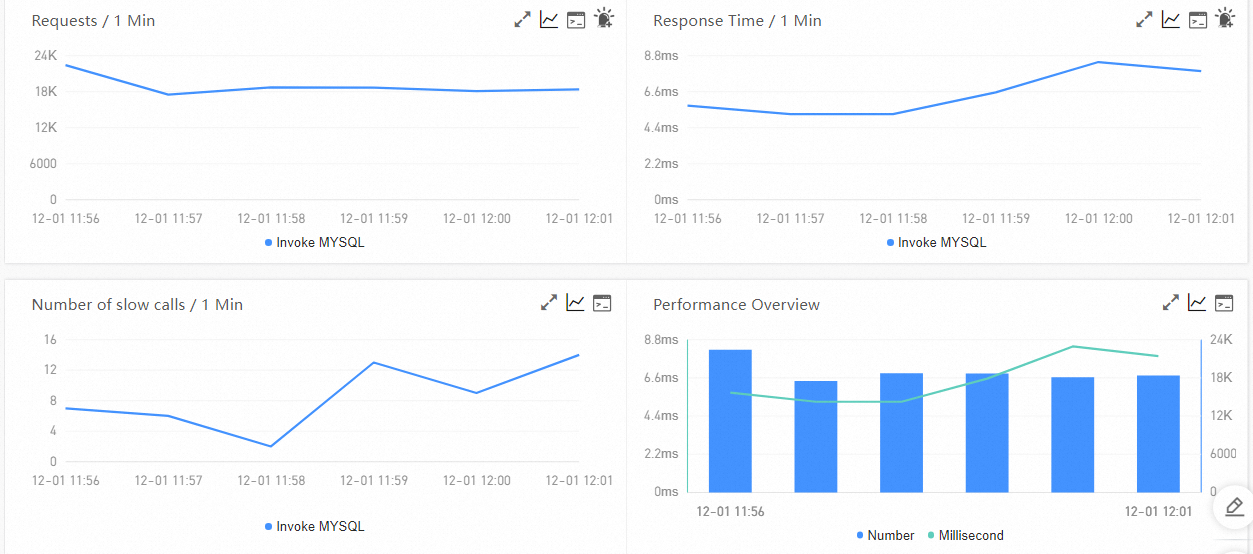
On the Overview tab, you can perform the following operations:
Move the pointer over a chart and view the statistics.
Drag the bars horizontally to view the statistics of specified time periods.
Click the
 icon to view metric statistics during a selected time period or compare performance within the same period across different days.
Click the
 icon to view the API details of the metric.
 Click the
 icon to create an alarm for this metric. For more information, see Alert rules.
Topology view
The Topology View tab displays the database call topology.
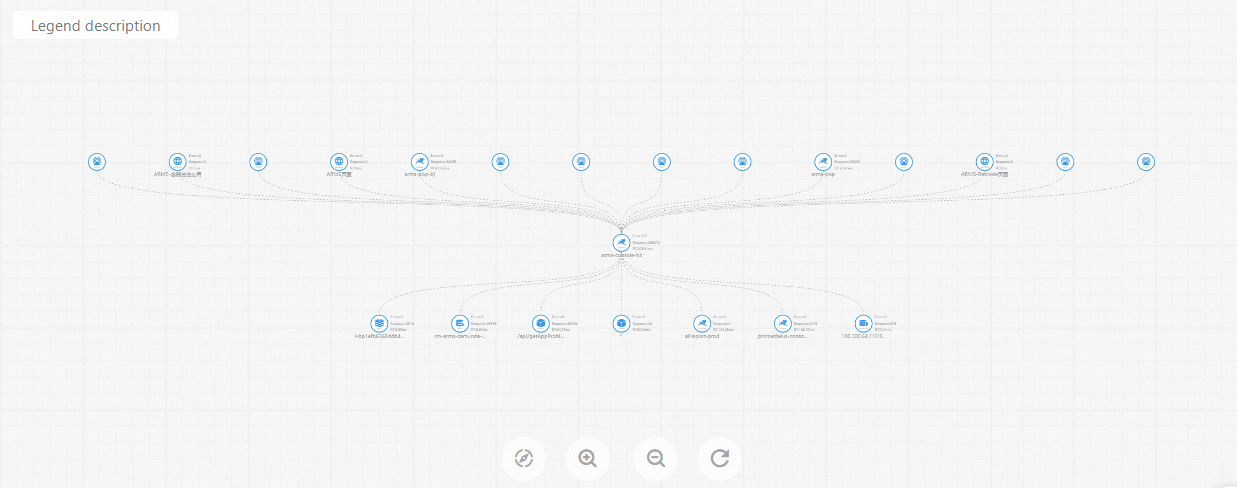
SQL analysis
The SQL Call Analysis tab displays a bar chart of SQL calls, a time-series chart of response times, and a list of SQL statements.
The list includes the following columns: Application, Database Type, SQL Statement, Number of slow calls, Average Duration, Invocations, and Response Size. The Actions column provides links to invocation statistics and Trace Query.
Optional: On the SQL Call Analysis tab, you can perform the following operations:
Move the pointer over a chart and view the statistics.
Click the
icon to view metric statistics during a selected time period or compare performance within the same period across different days.Click the
icon to view the API details of the metric. -
In the Actions column for an SQL statement, click Call Statistics to view its invocation statistics.
-
In the Actions column for an SQL statement, click Call chain query to view the list of traces for that statement. For more information, see Trace Query.
Exception analysis
The Exception Analysis tab displays database exceptions.
Optional: On the Exception Analysis tab, you can perform the following operations:
To filter exceptions, configure the exception filtering text box in .
Move the pointer over a chart and view the statistics.
Drag the bars horizontally to view the statistics of specified time periods.
Click the
icon to view metric statistics during a selected time period or compare performance within the same period across different days.Click the
icon to view the API details of the metric. -
In the Actions column for an exception, click Call Statistics to view statistics for that exception.
-
In the Actions column for an exception, click Details to view its details.
Call source
The call source tab displays call source information for the database.
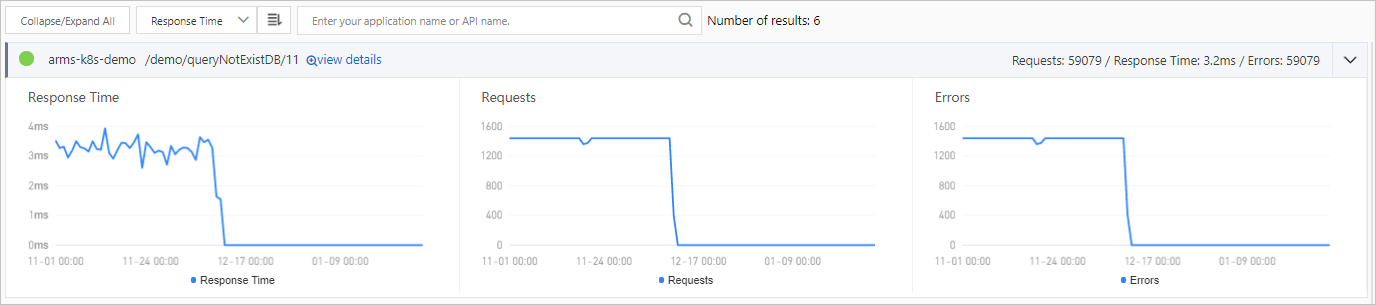
Optional: On the call source tab, you can perform the following operations:
-
To view information for a specific application or API, enter its name in the search box and click the
 icon.
icon. -
Next to an API in a call source application, click View Details to view the trace list for that API. For more information, see Trace Query.
Move the pointer over a chart and view the statistics.
Click the
icon to view metric statistics during a selected time period or compare performance within the same period across different days.
Trace query
The Call chain query tab displays a list of all traces for the database.
The list includes the following columns: Time, API Name, Application, Duration, Status, TraceId, and Actions.
Optional: On the Call chain query tab, you can perform the following operations:
-
To view the list of traces for a specific API, enter its name in the search box and click the
 icon.
icon. -
In the TraceId column, click a TraceId to view the trace details.
-
In the Actions column, click View Logs to view the log information for the trace.
NoteYou must associate trace IDs with the business logs of an application. This way, when an error occurs in the application, you can access the business logs that are associated with trace IDs to troubleshoot the error. For more information, see Associate trace IDs with Java business logs.