The Application Real-Time Monitoring Service (ARMS) agent automatically instruments common frameworks and libraries. For methods outside automatic detection -- such as custom business logic, internal utility functions, or proprietary middleware -- you can manually add them through the ARMS console. Once added, these methods appear in trace data and the local method stack, giving you visibility into previously unmonitored code paths.
Prerequisites
Before you begin, ensure that you have:
An application monitoring job. For more information, see Create an application monitoring job
Add a custom method
Log on to the ARMS console.
In the left-side navigation pane, choose Application Monitoring > Applications.
On the Applications page, select a region in the top navigation bar, and then click the name of the target application.
If the
 icon appears in the Language column, the application is connected to Application Monitoring. If a hyphen (-) appears, the application is connected to Managed Service for OpenTelemetry.
In the left-side navigation pane, click Application Settings.
Click the Monitoring Method Customization tab.
Click Add Method.
In the Add Custom Method dialog box, configure the parameters described in the following table, and then click OK.
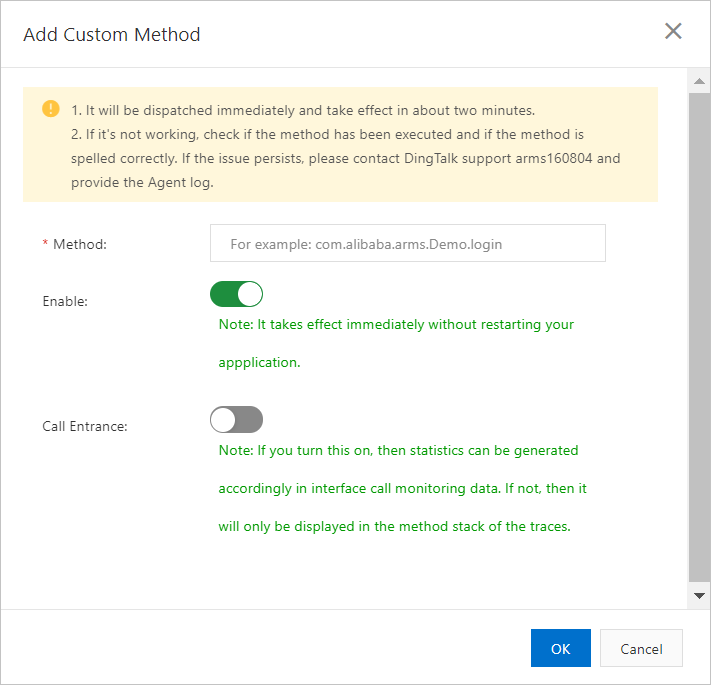
Parameter Description Method The name of the method to monitor. Must be unique across all custom methods. Enable Controls whether this method is actively monitored. When enabled, the method appears in the local method stack within trace query results. Enabled by default. For more information, see Trace query. Call Entrance Marks this method as a trace entry point. When enabled, the method appears on the Interface Invocation page and supports trace-based queries. Disabled by default. For more information, see Interface call monitoring. You can enable or disable monitoring for a method without restarting the application.
ImportantIf multiple custom methods in the same call stack are configured as call entrances, ARMS only collects monitoring data for the last method. For example, if Function A calls Function B and both are configured as call entrances, only Function B's monitoring data is collected.
After the method is added, it automatically appears in the method list on the Monitoring Method Customization tab.
What to do next
Trace query: Search and inspect traces that include your custom methods.
Interfaces: View call statistics for methods configured as call entrances.