ARMS provides common application monitoring metrics. If you need custom metrics, use the OpenTelemetry Python SDK to create them and query them in Grafana.
Prerequisites
-
You have integrated your application with ARMS application monitoring. For instructions, see Application integration.
-
The ARMS Python probe version is 2.8.0 or later.
Procedure
Step 1: Add custom metrics to your code
Run the following command to install the OpenTelemetry Python SDK. For more information, see the official OpenTelemetry documentation.
pip install opentelemetry-apiOpenTelemetry supports four metric types. ARMS supports all of them, though it handles histograms differently.
-
Counter: A counter that only increases.
-
Up-down counter: An up-down counter that can increase or decrease.
-
Gauge: A gauge that records an instantaneous value.
-
Histogram: A histogram that records the distribution of values.
The following example simulates a flash sale scenario and defines two metrics:
-
product_seckill_count: The number of flash sale attempts.
-
product_current_stock: The current inventory.
The meter is created with the scope name "product_seckill". This acts as a group: all metrics defined through this meter belong to this scope, which you reference in later configuration steps.
from fastapi import FastAPI
from opentelemetry.metrics import get_meter, Observation

app = FastAPI()

# Simulate inventory
stock = {"count": 100}

# Get a meter. The scope name "product_seckill" is important for later configuration.
meter = get_meter("product_seckill", "1.0.0")

# Create a counter to record the number of flash sale attempts.
seckill_counter = meter.create_counter(
    name="product_seckill_count",
    unit="1",
    description="seckill product count",
)


# Create a gauge to represent the current stock level.
def stock_callback(options):
    # Record the current stock count.
    yield Observation(stock["count"])


observable_gauge = meter.create_observable_gauge(
    name="product_current_stock",
    callbacks=[stock_callback],
    unit="1",
    description="current stock of product",
)


@app.post("/seckill")
def seckill_product():
    if stock["count"] <= 0:
        seckill_counter.add(1, {"seckill_result": "failed"})
        return {"message": "Purchase failed. The item is sold out."}
    stock["count"] -= 1
    seckill_counter.add(1, {"seckill_result": "success"})
    return {"message": f"Purchase successful. Remaining stock: {stock['count']}"}


@app.post("/stock/{count}")
def set_stock(count: int):
    stock["count"] = count
    return {"message": f"Stock has been set to: {count}"}


if __name__ == "__main__":
    import uvicorn
    uvicorn.run(app, host="0.0.0.0", port=8000)
Attach the probe and start the application:
aliyun-instrument python3 main.pyStep 2: Configure metric collection in the console
In the console, modify the probe collection configuration and add the product_seckill parameter that you entered when you created the meter in the previous step.
This configuration takes effect only for probe version 2.8.0 or later and does not require an application restart. After you complete the configuration, click Save.
If you cannot access the ARMS console or the dynamic configuration fails to deliver, configure the settings locally with the following environment variables:
export APSARA_APM_METRIC_CUSTOM_ENABLED=true
# Optional: Configure the allowlist for scopes. If not set, all scopes are collected by default.
export APSARA_APM_METRIC_CUSTOM_INCLUDE_SCOPE_LIST="my.scope,other.scope"
Step 3: View metrics and configure alarms
-
In the ARMS console, on the Prometheus Monitoring > Instance List page, select the region where your application is connected from the top menu bar. Search for a Prometheus storage instance whose name starts with
metricstore-apm-metrics-custom, and then click Shared Edition to go to Grafana. -
On the Grafana page, click Explore and select the Prometheus storage instance from the previous step as the data source.
If the Grafana folder has no dashboards, it displays This folder doesn't have any dashboards yet. Click + Create Dashboard to create one, or use Manage dashboards to move existing dashboards into the folder.
-
You can use PromQL to query your custom metrics, as shown in the following figure. You can also customize the observability page in Grafana.
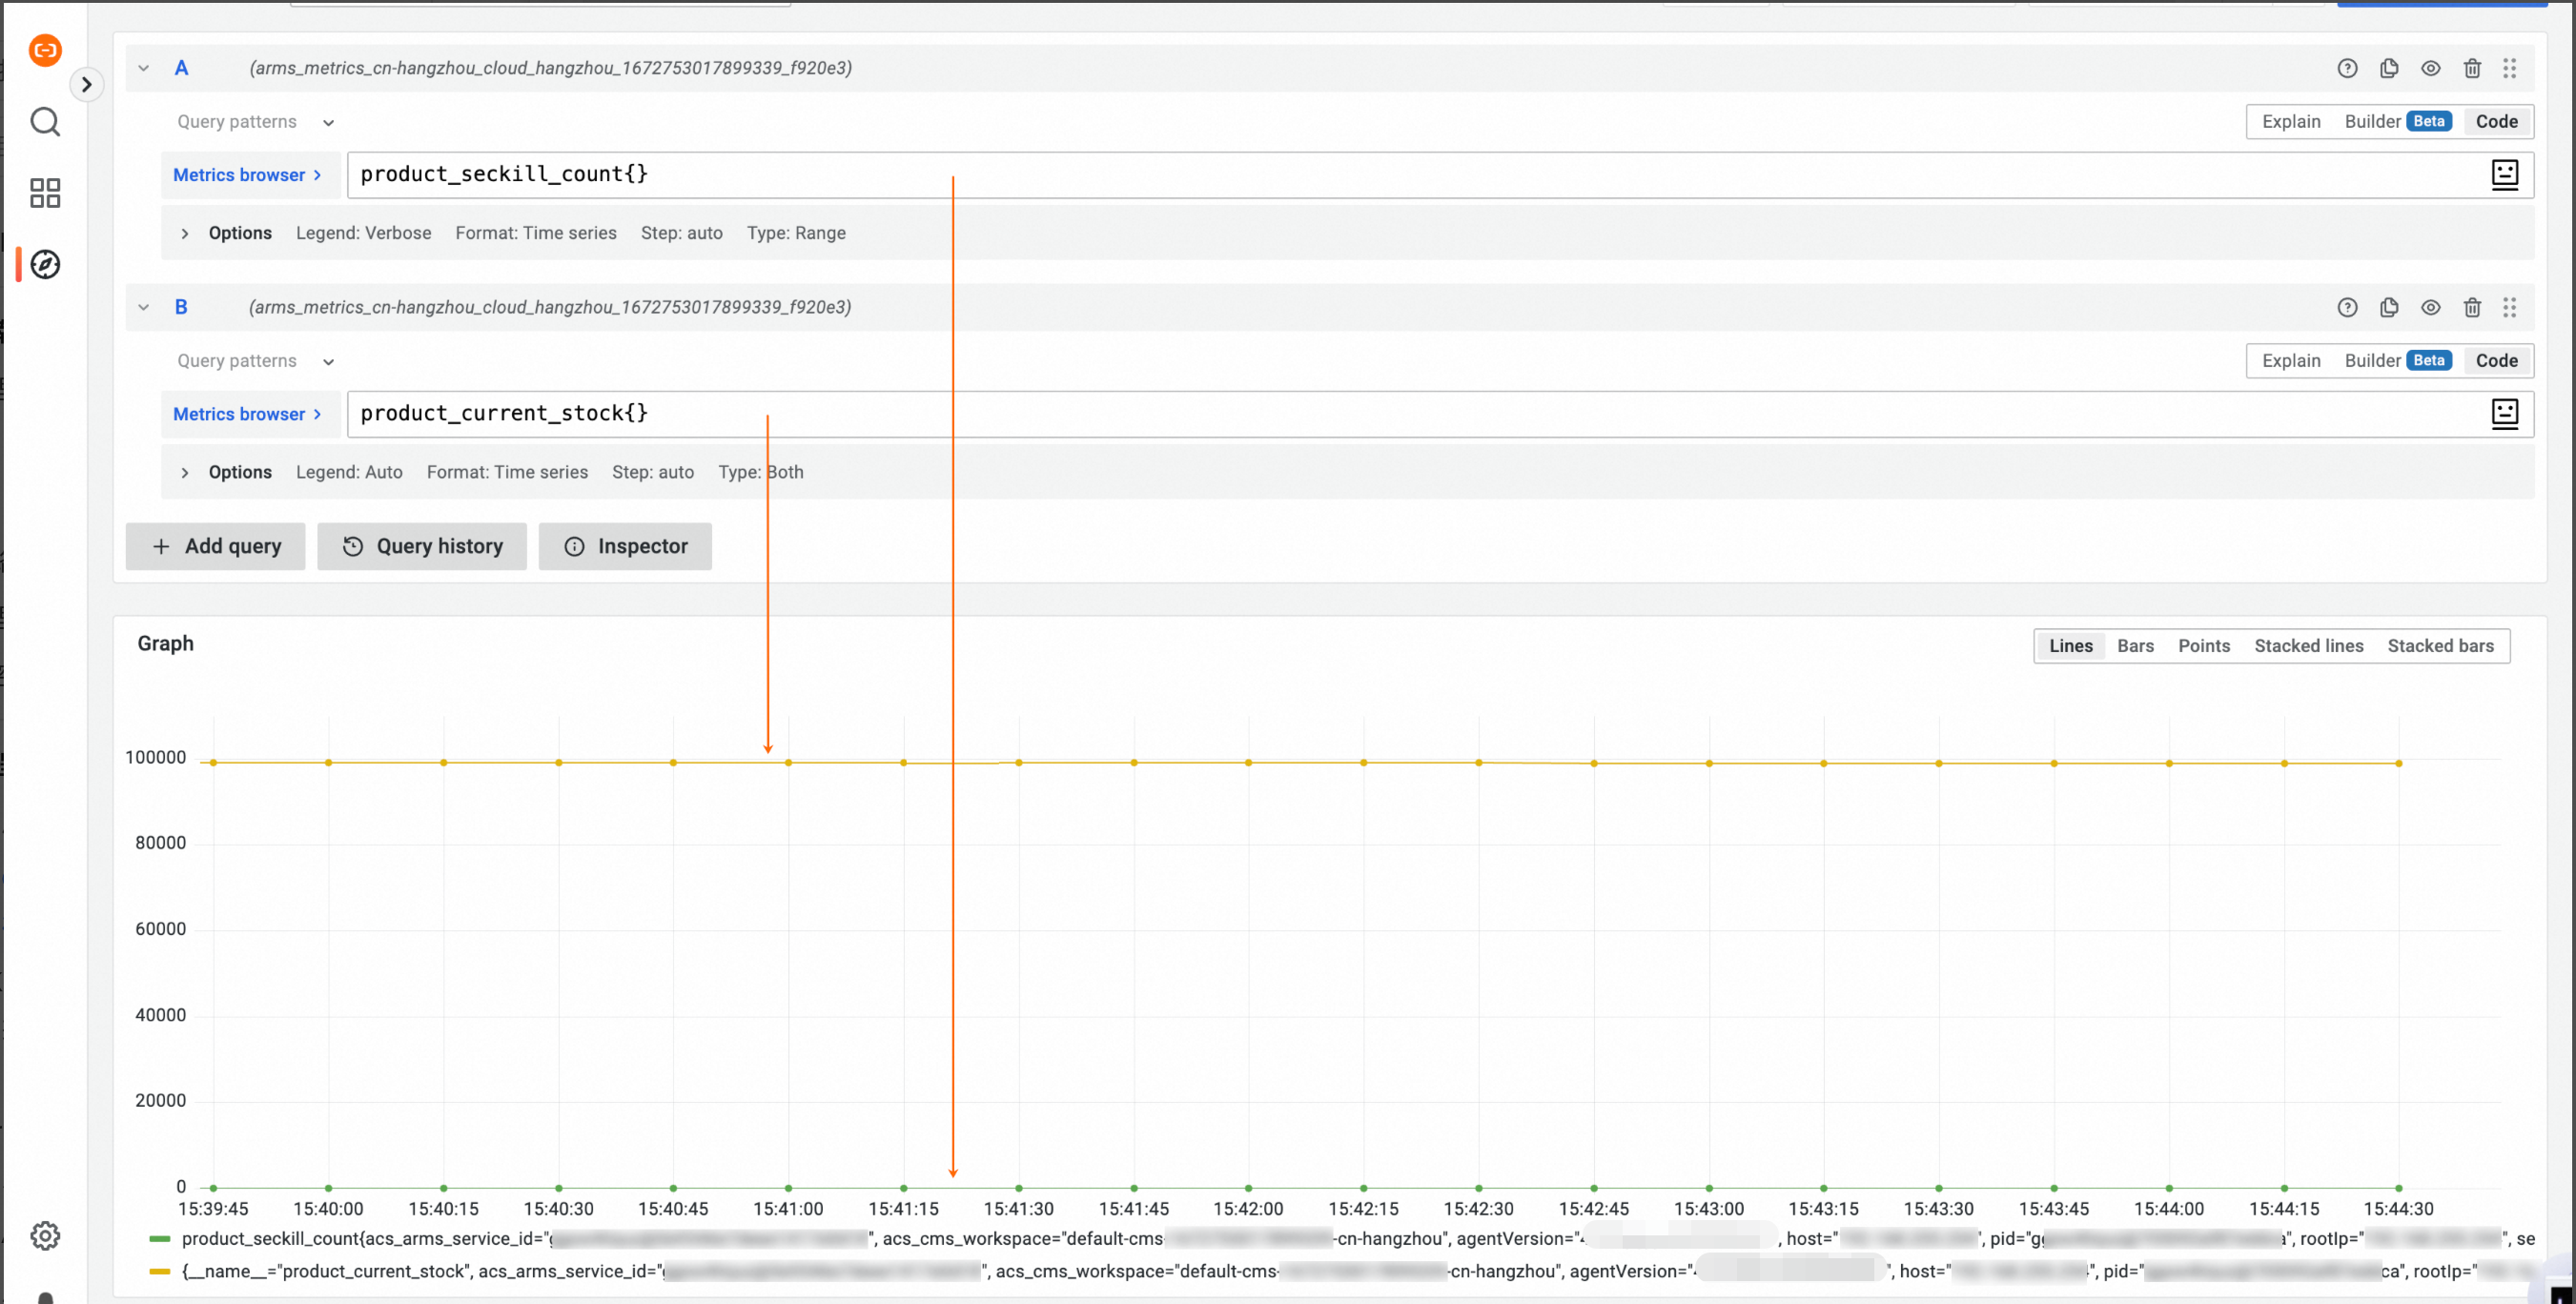
After configuration, your custom OpenTelemetry metrics are reported to the ARMS Prometheus storage instance. You can then create a Prometheus alarm rule for them.
Notes
-
ARMS reports metrics at a 15-second interval.
-
For counter metrics, ARMS reports the incremental value over each 15-second reporting period, not the cumulative value.
-
Because the ARMS metric model is not fully aligned with the OpenTelemetry model, each histogram metric is split into the following separate metrics:
-
{name}_count: The number of samples. -
{name}_sum: The sum of all sampled values. -
{name}_min: The minimum value among all samples (generated only if min data is available). -
{name}_max: The maximum value among all samples (generated only if max data is available).
-
For example, the metric custom.latency is split into:
-
custom.latency_count: The number of requests. -
custom.latency_sum: The sum of latencies. -
custom.latency_min: The minimum latency. -
custom.latency_max: The maximum latency.