When application issues go undetected, they escalate from minor latency increases to full outages. Application Monitoring in Application Real-Time Monitoring Service (ARMS) provides preset alerting metrics across business, application, and infrastructure layers to help you catch problems early. Because Application Monitoring data is integrated into Managed Service for Prometheus by default, you can also write Prometheus Query Language (PromQL) statements for alert rules that go beyond the presets.
This topic walks through a layered alerting strategy -- from business-critical interfaces down to infrastructure health -- with concrete configurations and PromQL examples for each layer.
Prerequisites
Before you begin, make sure that your application is monitored by Application Monitoring. For more information, see Application Monitoring overview.
Alerting strategy
Effective alerting follows a top-down hierarchy that mirrors how incidents propagate: business impact originates in application-level issues, which often trace back to infrastructure problems. Structuring alerts across three layers helps you detect issues early and pinpoint root causes fast.

| Layer | What to monitor | Why it matters |
|---|---|---|
| Business | Key interface call volume, error rates, response times | Detects user-facing impact first |
| Application | Exceptions, HTTP 5xx codes, JVM health, thread pools | Identifies the failing component |
| Infrastructure | CPU utilization, memory usage, disk utilization | Reveals resource constraints behind application issues |
Preset metrics reference
The following table lists the preset metrics available in Application Monitoring. For the full list, see Alert rule metrics.
| Metric | Description |
|---|---|
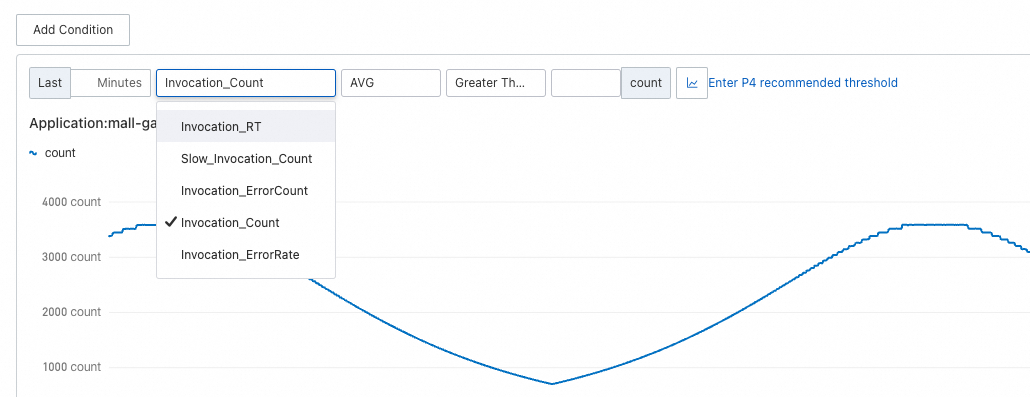
| Number of Calls | Entry calls, including HTTP and Dubbo calls. Useful for estimating business volume and detecting anomalies. |
| Call Error Rate (%) | Error rate = Number of error entry calls / Total number of entry calls x 100%. |
| Call Response Time | Response time of an entry call (HTTP or Dubbo). Useful for identifying slow requests. |
| Number of Exceptions | Runtime exceptions such as null pointer exceptions, array out-of-bounds exceptions, and I/O exceptions. |
| Number of HTTP Requests Returning 5XX Status Codes | HTTP 5xx responses indicate internal server errors. Common codes include 500 and 503. |
| Database Request Response Time | Round-trip time from application request to database response. Long response times cause application stuttering or slowdowns. |
| Downstream Service Call Error Rate (%) | Error rate = Number of failed downstream service requests / Total number of interface requests. |
| Average Response Time of Downstream Service Calls (ms) | Average latency of downstream service calls. Rising values may indicate downstream degradation. |
| Number of JVM Full GCs (Instantaneous Value) | Full garbage collections in the last N minutes. Frequent Full GCs often indicate memory pressure. |
| Number of Runnable JVM Threads | Thread count during JVM runtime. Excessive threads consume memory and can crash the process. |
| Thread Pool Usage | Ratio of active threads to total threads in a thread pool. |
| Node CPU Utilization (%) | CPU utilization of a server node. Sustained high utilization causes slow responses and service unavailability. |
| Node Disk Utilization (%) | Ratio of used disk space to total disk space. |
| Node Memory Usage (%) | Percentage of memory in use. If this exceeds 80%, reduce memory pressure by adjusting configurations or optimizing workloads. |
Business-layer alerts
Monitor the interfaces tied to your core business. In e-commerce, this might be the checkout or add-to-cart interface; in gaming, the sign-in interface.
The following example uses an add-to-cart interface in an e-commerce scenario.

Call volume
Interface call volume is the primary indicator of business health. A sudden drop usually signals an outage; a spike beyond capacity signals overload. Set a data range to trigger alerts when call volume falls outside the expected band.
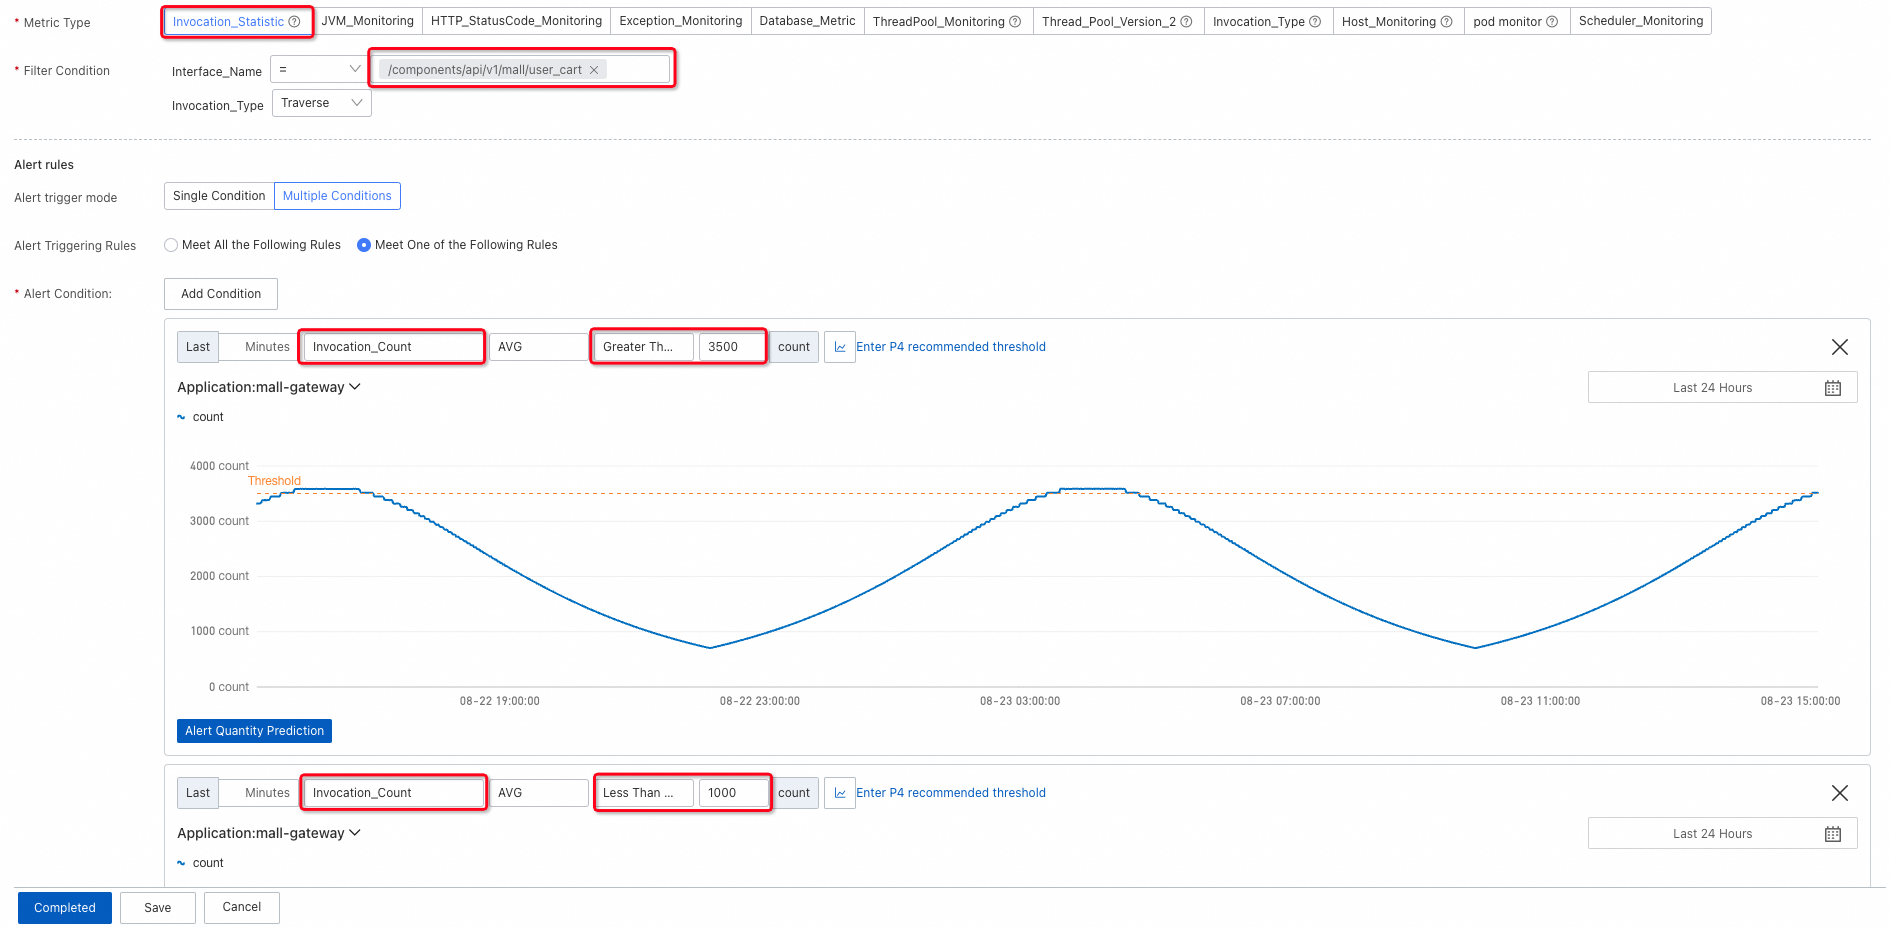
During off-peak hours (such as midnight), absolute call volume is naturally low, which can trigger false positives on a static lower bound. Use a lower limit with link relative to detect rapid decreases caused by anomalies rather than normal traffic patterns.

Error rate
Set an upper limit on the error rate of interface calls to catch failures before they affect a significant portion of users.

Response time and slow calls
If your business requires low latency, add alerts for response time or the number of slow calls.
Application-layer alerts
When a business-layer alert fires, application metrics help you isolate the root cause.
Exceptions
Exceptions typically spike during deployments or when a downstream service degrades. To catch these spikes, set an upper limit with link relative so that you are alerted on rapid increases rather than a constant background level.

An increase in exceptions does not always mean the application is broken -- graceful degradation can handle exceptions without affecting the response. However, some exceptions propagate to the interface as errors. Set an upper limit on the exception error rate to catch those cases.
HTTP 5xx status codes
For HTTP services, 4xx codes generally indicate client-side issues, while 5xx codes indicate server errors. Set an upper limit with link relative on 5xx codes to detect surges.

Response time
When an application encounters problems or traffic surges, overall response time often increases sharply. Set an upper limit for the average response time within a time window. The following example uses a 1-minute window. If your traffic fluctuates frequently, use a longer window (5 or 10 minutes) to smooth out noise.

Database and downstream service latency
Slow responses often come from either database queries or downstream service calls.
Database call response time: Database issues can increase latency by tens or even hundreds of times, so set a relatively high upper limit to avoid false positives on normal query variance.

Downstream service call response time: Set an upper limit to detect increasing latency from services your application depends on.

Downstream service call error rate: Set an upper limit to detect rising failure rates in downstream dependencies.

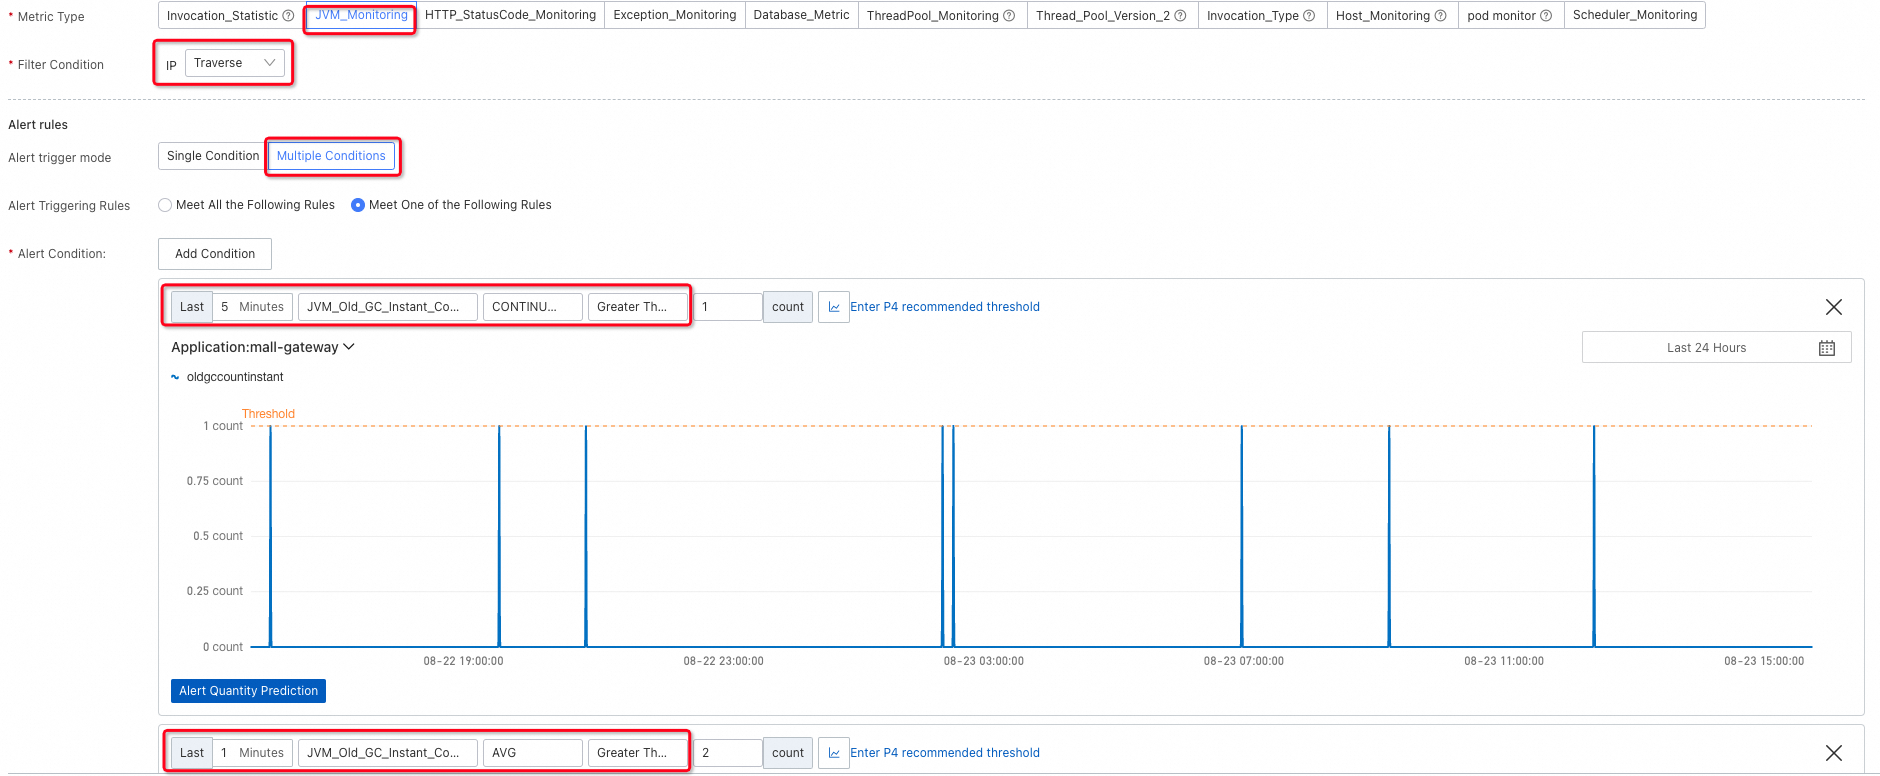
JVM health
For internal application issues, monitor JVM and thread pool metrics.
Full GC events: Traverse all nodes and configure two alerting conditions -- one for continuous Full GC events and one for frequent Full GC bursts in a short period -- because both patterns indicate abnormal memory behavior.
Runnable JVM threads: Excessive threads consume memory and can destabilize the process. Conversely, if no threads are runnable, the service is unresponsive. Add alerting conditions for both extremes.

Thread pool usage: To prevent thread pool exhaustion, alert on thread pool usage, active thread count, or maximum thread count over a time window.
If the thread pool size is not explicitly configured, it defaults to 2147483647 (the maximum 32-bit signed integer). In this case, do not use the maximum thread count as an alerting condition because it is not meaningful.
In the Metric Type section, select ThreadPool_Monitoring for ARMS agent V3.x or Thread_Pool_Version_2 for ARMS agent V4.x.

Infrastructure-layer alerts
ECS node metrics
For applications deployed on Elastic Compute Service (ECS) instances, ARMS collects node-level metrics. Configure upper limits for CPU utilization, memory usage, and disk utilization.
CPU utilization: CPU readings fluctuate frequently. Rather than alerting on a single spike, check whether utilization continuously exceeds the threshold over a sustained period.

Memory usage:

Disk utilization:

ACK cluster metrics
For applications deployed in Container Service for Kubernetes (ACK) clusters:
With Managed Service for Prometheus: Use Prometheus alert rules. For more information, see Monitor an ACK cluster.
Without Managed Service for Prometheus: ARMS agent V4.1.0 and later collects CPU and memory data from ACK clusters. Set thresholds based on your cluster's request volume and resource allocation -- no universal default applies.
CPU utilization of ACK clusters:

Memory usage of ACK clusters:

Reduce alert noise
A common pitfall is setting up alerts and never revisiting them. Over time, poorly tuned alerts cause fatigue and slow down incident response. The following practices help you maintain a high signal-to-noise ratio.
| Practice | How to apply it |
|---|---|
| Use descriptive alert names | Include the metric, scope, and severity in the alert name. For example, use "High CPU utilization on ECS node" rather than "CPU alert." A clear name speeds up triage. |
| Start with recommended thresholds, then iterate | Application Monitoring provides recommended thresholds as a starting point. After your application runs for a few weeks, tighten thresholds that never fire and loosen thresholds that fire too often. |
| Use Traversal to consolidate alerts | Rather than creating separate alert rules for each node or interface, use the Traversal filter to evaluate all nodes independently within a single rule. This reduces redundancy and simplifies maintenance. |
| Use CONTINUOUS for volatile metrics | For metrics that spike frequently (such as CPU utilization), use the CONTINUOUS condition to alert only when the metric exceeds the threshold for a sustained period. |
| Use link relative for traffic-dependent metrics | For metrics that vary by time of day (such as call volume), use link relative comparison to detect abnormal changes rather than setting static thresholds that trigger during off-peak hours. |
| Review alerts periodically | Alerts that remain in a triggered state for weeks or that fire and resolve repeatedly often need recalibration. Schedule regular reviews to remove or adjust stale alerts. |
Filter conditions, alerting conditions, and thresholds
Filter conditions
Filter conditions control which dimension of a metric is evaluated.
| Filter | Behavior | SQL analogy |
|---|---|---|
| Traversal | Evaluate each node or interface independently | GROUP BY |
| = | Evaluate only the specified node or interface | WHERE |
| No dimension | Evaluate the aggregate metric. For host metrics (such as CPU utilization), the node with the highest value is monitored. For response time, the average is monitored. | No clause |

Alerting conditions
| Condition | Behavior | Best for |
|---|---|---|
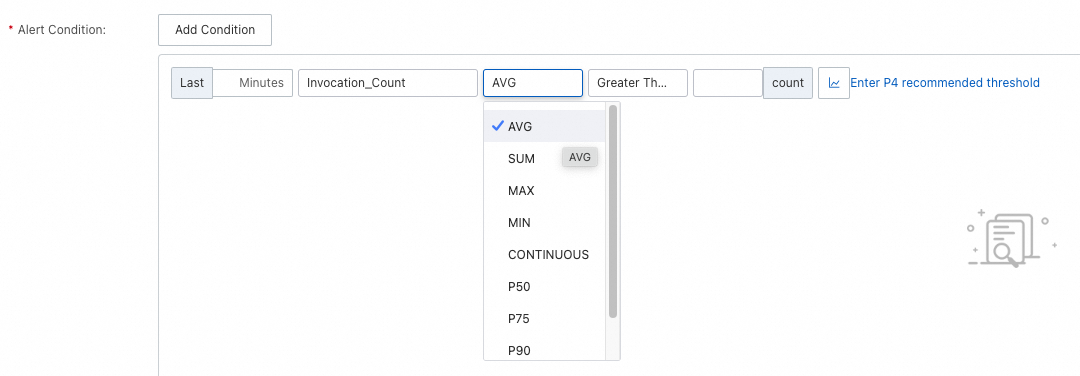
| AVG / SUM / MAX / MIN | Alert if the aggregated value over the last X minutes reaches the threshold | Steady-state metrics |
| CONTINUOUS | Alert if the value continuously exceeds the threshold for X minutes | Metrics with large fluctuations, where instantaneous spikes are expected |
| Pxx | Alert on a specific percentile (such as P99) | Latency-sensitive workloads |
The minimum time window is 1 minute. At 1 minute, AVG, SUM, MAX, MIN, and CONTINUOUS produce identical results.
Recommended thresholds
Application Monitoring provides recommended thresholds for common scenarios. Use these as a starting point and adjust based on your application's baseline behavior.
To tune thresholds over time:
Tighten thresholds that never fire. If a threshold is set too high, you may miss real incidents.
Loosen thresholds that fire too often. Frequent false positives cause alert fatigue and slow response times.
Temporarily widen thresholds during planned changes, such as deployments or migrations, to avoid a flood of expected alerts.

Advanced alerting with PromQL
After an application connects to Application Monitoring, Managed Service for Prometheus automatically creates a Prometheus instance in the same region to store metric data. This enables you to write PromQL-based alert rules that go beyond the preset options.


Example -- JVM heap memory usage: In Application Monitoring, you can monitor this metric for one application in one region. With PromQL, you can monitor all applications in a region with a single rule:
max by (serverIp,pid) (last_over_time(arms_jvm_mem_used_bytes{area="heap",id="eden"}[1m]))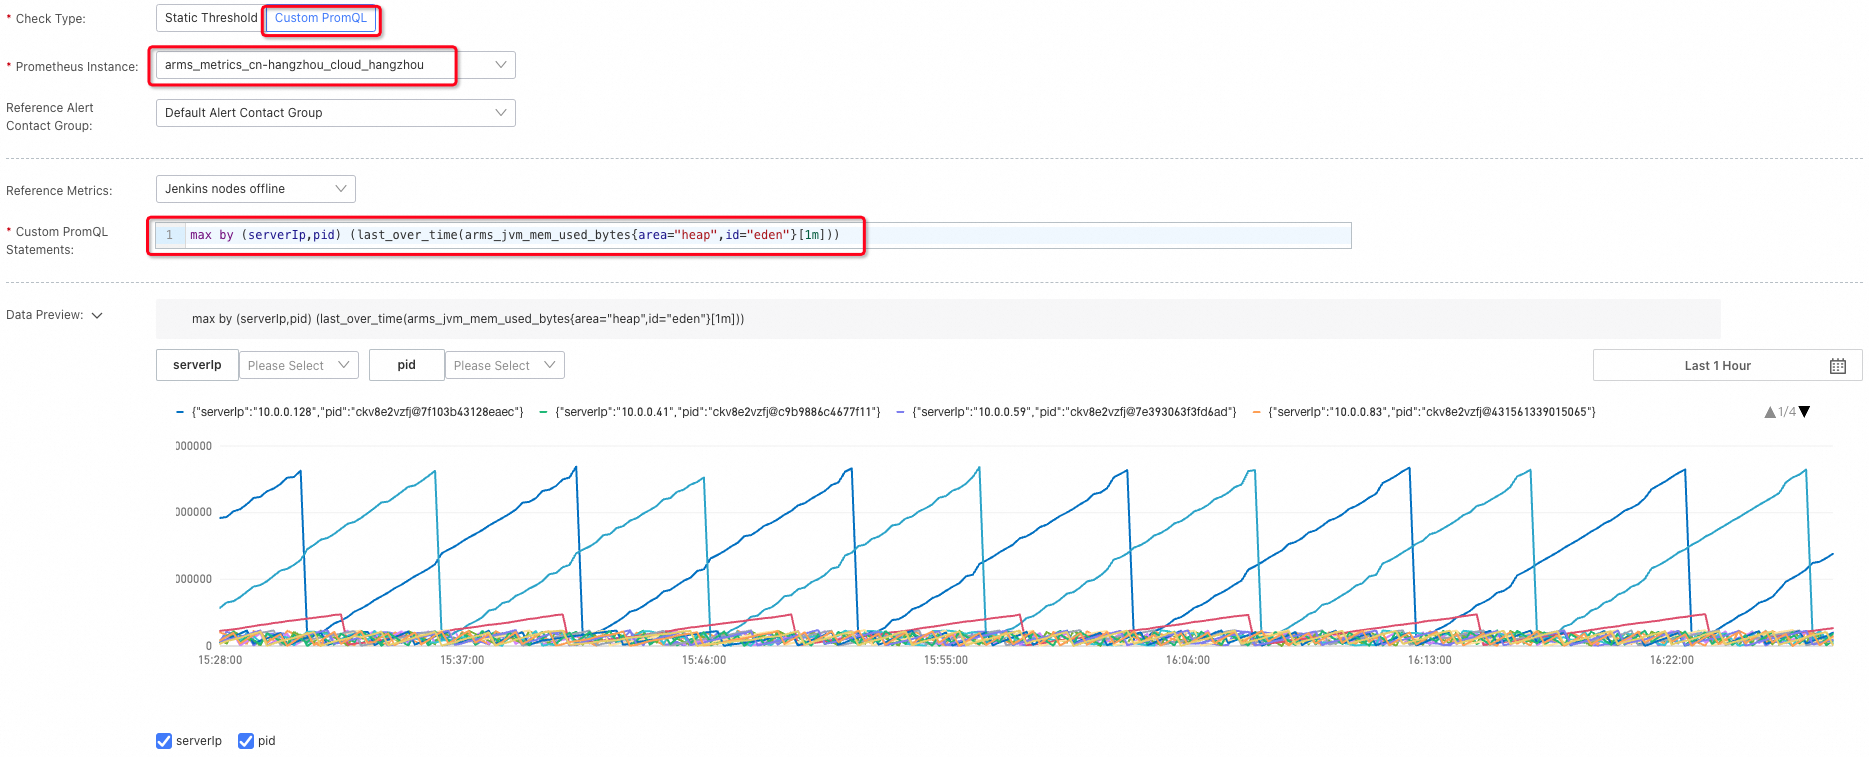
For the full list of supported metrics, see Application Monitoring metrics. Use only listed metrics -- unlisted metrics may be deprecated in future versions.
PromQL reference
All PromQL statements below use two placeholder variables:
$dims-- grouping dimensions (similar to SQLGROUP BY). Replace with dimension keys such asservice,pid,serverIp, orrpc.$labelFilters-- label selectors (similar to SQLWHERE). Replace with label key-value pairs such as"serverIp"="127.0.0.1".
Business metrics
| Metric | PromQL |
|---|---|
| Number of HTTP interface calls | sum by ($dims) (sum_over_time_lorc(arms_http_requests_count{$labelFilters}[1m])) |
| Response time of HTTP interface calls | sum by ($dims) (sum_over_time_lorc(arms_http_requests_seconds{$labelFilters}[1m])) / sum by ($dims) (sum_over_time_lorc(arms_http_requests_count{$labelFilters}[1m])) |
| Number of HTTP interface call errors | sum by ($dims) (sum_over_time_lorc(arms_http_requests_error_count{$labelFilters}[1m])) |
| Number of slow HTTP interface calls | sum by ($dims) (sum_over_time_lorc(arms_http_requests_count{$labelFilters}[1m])) |
Business metric dimensions:
| Dimension | Key |
|---|---|
| Service name | service |
| Service PID | pid |
| Server IP address | serverIp |
| Interface | rpc |
Examples:
HTTP interface calls on the host 127.0.0.1, grouped by interface:
sum by (rpc) (sum_over_time_lorc(arms_http_requests_count{"serverIp"="127.0.0.1"}[1m]))HTTP interface calls to the mall/pay interface, grouped by host:
sum by (serverIp) (sum_over_time_lorc(arms_http_requests_count{"rpc"="mall/pay"}[1m]))JVM metrics
| Metric | PromQL |
|---|---|
| Total JVM heap memory | max by ($dims) (last_over_time_lorc(arms_jvm_mem_used_bytes{area="heap",id="old",$labelFilters}[1m])) + max by ($dims) (last_over_time_lorc(arms_jvm_mem_used_bytes{area="heap",id="eden",$labelFilters}[1m])) + max by ($dims) (last_over_time_lorc(arms_jvm_mem_used_bytes{area="heap",id="survivor",$labelFilters}[1m])) |
| Number of JVM Young GCs | sum by ($dims) (sum_over_time_lorc(arms_jvm_gc_delta{gen="young",$labelFilters}[1m])) |
| Number of JVM Full GCs | sum by ($dims) (sum_over_time_lorc(arms_jvm_gc_delta{gen="old",$labelFilters}[1m])) |
| Young GC duration | sum by ($dims) (sum_over_time_lorc(arms_jvm_gc_seconds_delta{gen="young",$labelFilters}[1m])) |
| Full GC duration | sum by ($dims) (sum_over_time_lorc(arms_jvm_gc_seconds_delta{gen="old",$labelFilters}[1m])) |
| Number of active threads | max by ($dims) (last_over_time_lorc(arms_jvm_threads_count{state="live",$labelFilters}[1m])) |
| Heap memory usage | (max by ($dims) (last_over_time_lorc(arms_jvm_mem_used_bytes{area="heap",id="old",$labelFilters}[1m])) + max by ($dims) (last_over_time_lorc(arms_jvm_mem_used_bytes{area="heap",id="eden",$labelFilters}[1m])) + max by ($dims) (last_over_time_lorc(arms_jvm_mem_used_bytes{area="heap",id="survivor",$labelFilters}[1m]))) / max by ($dims) (last_over_time_lorc(arms_jvm_mem_max_bytes{area="heap",id="total",$labelFilters}[1m])) |
JVM metric dimensions:
| Dimension | Key |
|---|---|
| Service name | service |
| Service PID | pid |
| Server IP address | serverIp |
System metrics
| Metric | PromQL |
|---|---|
| CPU utilization | max by ($dims) (last_over_time_lorc(arms_system_cpu_system{$labelFilters}[1m])) + max by ($dims) (last_over_time_lorc(arms_system_cpu_user{$labelFilters}[1m])) + max by ($dims) (last_over_time_lorc(arms_system_cpu_io_wait{$labelFilters}[1m])) |
| Memory usage | max by ($dims) (last_over_time_lorc(arms_system_mem_used_bytes{$labelFilters}[1m])) / max by ($dims) (last_over_time_lorc(arms_system_mem_total_bytes{$labelFilters}[1m])) |
| Disk utilization | max by ($dims) (last_over_time_lorc(arms_system_disk_used_ratio{$labelFilters}[1m])) |
| System load | max by ($dims) (last_over_time_lorc(arms_system_load{$labelFilters}[1m])) |
| Number of network input errors | max by ($dims) (max_over_time_lorc(arms_system_net_in_err{$labelFilters}[1m])) |
System metric dimensions:
| Dimension | Key |
|---|---|
| Service name | service |
| Service PID | pid |
| Server IP address | serverIp |
Thread pool and connection pool metrics
ARMS agent V4.1.x and later
| Metric | PromQL |
|---|---|
| Thread pool usage | avg by ($dims) (avg_over_time_lorc(arms_thread_pool_active_thread_count{$labelFilters}[1m])) / avg by ($dims) (avg_over_time_lorc(arms_thread_pool_max_pool_size{$labelFilters}[1m])) |
| Connection pool usage | avg by ($dims) (avg_over_time_lorc(arms_connection_pool_connection_count{state="used",$labelFilters}[1m])) / avg by ($dims) (avg_over_time_lorc(arms_connection_pool_connection_max_count{$labelFilters}[1m])) |
ARMS agent earlier than V4.1.x
For agents earlier than V4.1.x, specify the ThreadPoolType parameter in the PromQL statement. Supported values: Tomcat, apache-http-client, Druid, SchedulerX, okhttp3, Hikaricp. For supported frameworks, see Thread pool and connection pool monitoring.
| Metric | PromQL |
|---|---|
| Thread pool usage | avg by ($dims) (avg_over_time_lorc(arms_threadpool_active_size{ThreadPoolType="$ThreadPoolType",$labelFilters}[1m])) / avg by ($dims) (avg_over_time_lorc(arms_threadpool_max_size{ThreadPoolType="$ThreadPoolType",$labelFilters}[1m])) |
Thread pool and connection pool dimensions:
| Dimension | Key |
|---|---|
| Service name | service |
| Service PID | pid |
| Server IP address | serverIp |
| Thread pool name (ARMS agent earlier than V4.1.x) | name |
| Thread pool type (ARMS agent earlier than V4.1.x) | type |