Monitoring data gaps occur when the process where the ARMS agent and application reside is interrupted. Common causes include restart timeouts and full garbage collection (GC) pauses. During either event, the agent cannot collect or report data until the process recovers.
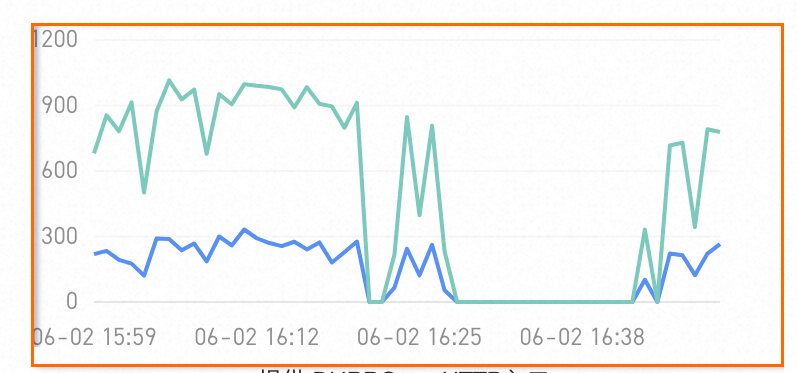
Troubleshoot the data gap
To identify the root cause, check for restart timeouts and full GC pauses in the ARMS console.
Check for restart events
Open the Application Overview page for your application.
In the Related Events section, check the affected time window for the following events:
Container restart event -- The container was restarted, which interrupts the ARMS agent.
Agent start event of the ECS instance -- The ARMS agent was restarted on the host.
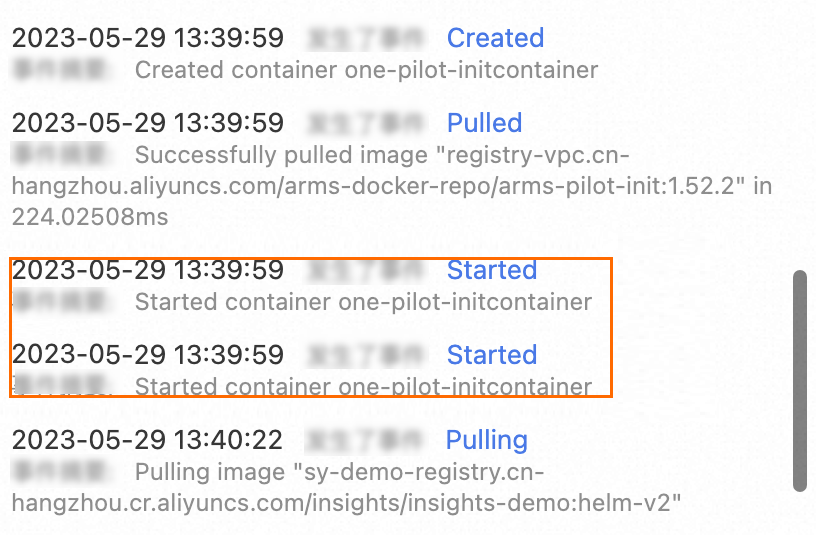
If either event coincides with the data gap, the restart caused the interruption. Investigate why the container or agent restarted, such as a deployment, scaling event, or resource limit.
Check for full GC pauses
Open the Application Details page and select the affected application instance.
On the JVM monitoring tab, check whether any full GCs occurred during the time window when data is missing.
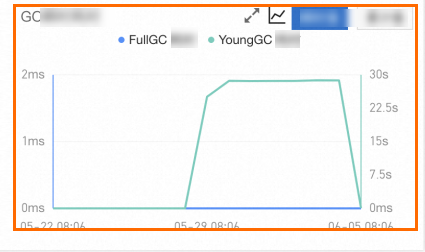
A full GC pause can block the application process long enough to prevent the ARMS agent from reporting data. If full GCs align with the data gap, review your JVM heap configuration to reduce full GC frequency.