When Java applications behave unexpectedly in production, reproducing the issue locally is often impractical. Arthas diagnostics in Application Real-Time Monitoring Service (ARMS) lets you inspect JVM internals, trace method execution, and examine object state in running processes -- without restarting the Java virtual machine (JVM) or installing additional tools.
Arthas uses bytecode enhancement technology. ARMS is completely integrated with all the capabilities of Arthas. Compared to self-managed Arthas, the ARMS-integrated version provides three advantages:
No local setup. No Java Development Kit (JDK) dependency, no downloads. Enable or disable diagnostics on demand.
Browser-based interface. Access the main diagnostic features through a visual UI instead of typing commands or expressions.
APM context awareness. Run the
tracecommand to view the trace IDs of ARMS.
Arthas performance analysis has been fully upgraded to continuous profiling. Continuous profiling can be enabled routinely and identifies CPU, memory, and I/O bottlenecks in Java programs, with statistics broken down by method name, class name, and line number.
Diagnostic capabilities
ARMS integrates six Arthas diagnostic features:
| Feature | What it does |
|---|---|
| JVM overview | Shows real-time memory usage, system information, system variables, and environment variables of a JVM process. |
| Thread time-consuming analysis | Shows thread time consumption and the real-time method stack of a specific thread in a JVM process. |
| Method execution analysis | Captures an execution record of any non-JDK method that meets specified conditions. Records parameters, exceptions, returned values, and execution duration of each internal method. |
| Object viewer | Displays real-time property values of any class instance. |
| Real-time dashboard | Shows live metrics for components such as Druid connection pool configurations, usage, and SQL query duration. |
| Arthas Shell | Provides a command-line interface (CLI) for running Arthas commands directly. |
Prerequisites
Before you begin, make sure that you have:
Application Monitoring Pro Edition -- Arthas is not available in other editions
ARMS agent version 2.7.1.3 or later
A Java application with data already imported to Application Monitoring (see Overview)
Enable Arthas diagnostics only when actively troubleshooting. Disable it when not in use.
Enable Arthas
Log on to the ARMS console. In the left-side navigation pane, choose Application Monitoring > Application List.
On the Application List page, select a region in the top navigation bar and click the name of the application.
NoteIcons in the Language column indicate the application language:
 Java |
  Go |
Go |  Python | Hyphen (-): monitored in Managed Service for OpenTelemetry.
In the left-side navigation pane, click Application Settings. On the page that appears, click the Custom Configuration tab.
In the Arthas monitoring section, turn on Arthas switch. Optionally, specify the IP addresses on which to run diagnostics.
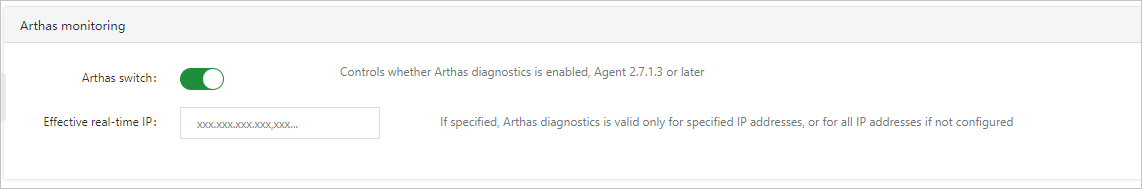
Click Save.
Open the Arthas Diagnosis page
After you enable Arthas, navigate to the diagnostics interface:
Log on to the ARMS console. In the left-side navigation pane, choose Application Monitoring > Application List.
On the Application List page, select a region in the top navigation bar and click the name of the application.
In the left-side navigation pane, choose Application Diagnosis > Arthas Diagnosis.
Select the target application instance from the drop-down list at the top of the page.
If the ARMS agent is earlier than V2.7.1.3, a prompt appears to update the agent.
If the ARMS agent is V2.7.1.3 or later, instance diagnostics information is displayed.
JVM overview
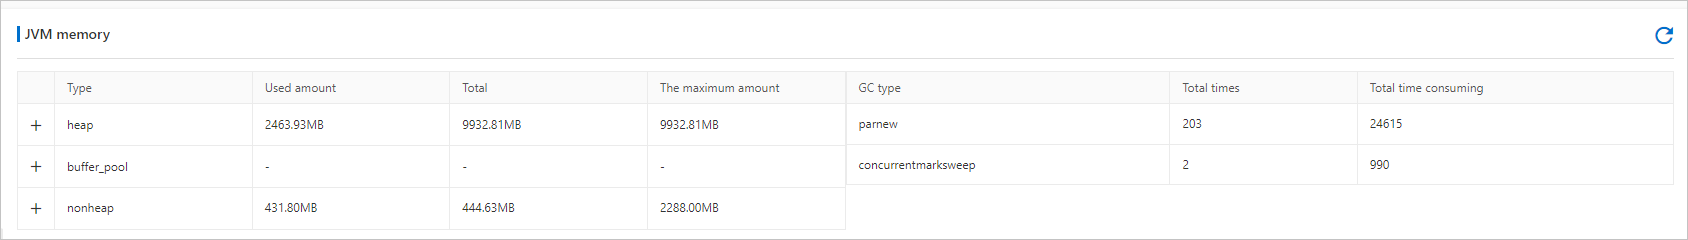
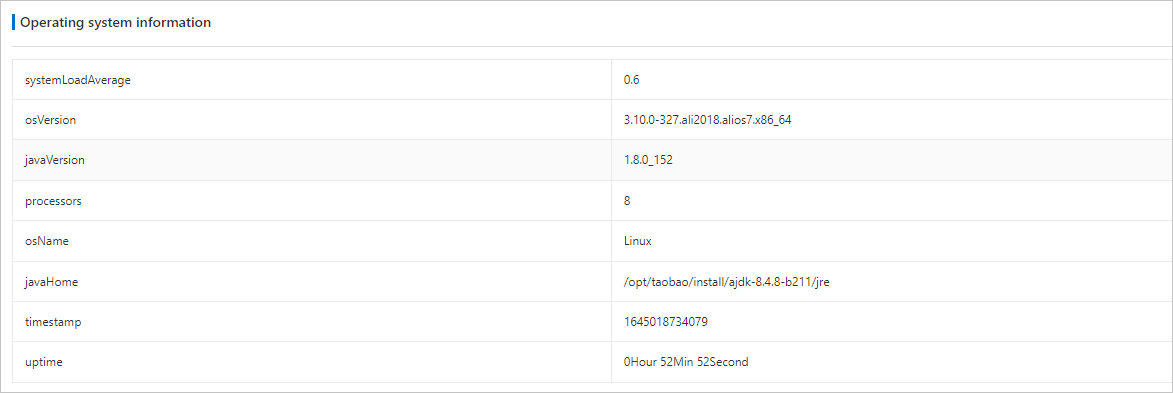
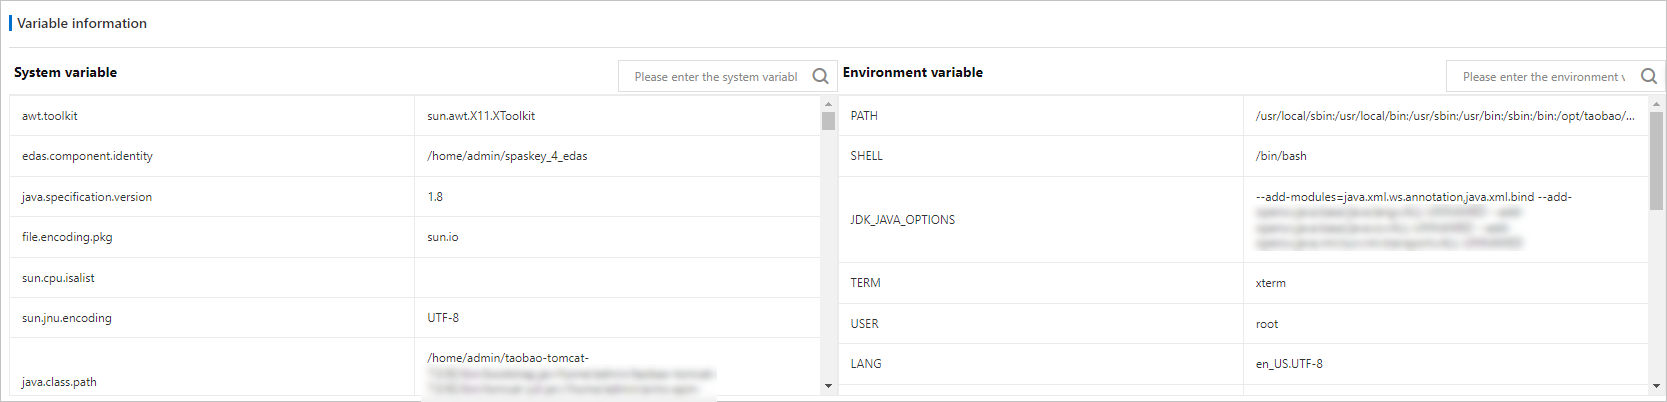
The JVM overview tab is displayed by default when you open the Arthas Diagnosis page. It provides a real-time snapshot of the JVM in three sections:
JVM memory: Heap memory and non-heap memory usage, and garbage collection (GC) statistics.
Operating system information: Average system load, operating system name and version, and Java version.
Variable information: System variables and environment variables.
Analyze thread time consumption
The Thread time-consuming analysis tab shows all threads in the application, grouped by category. Use this tab to identify time-consuming threads.
On the Arthas Diagnosis page, click the Thread time-consuming analysis tab. Similar threads are grouped into a single row. Each row shows the thread category name.
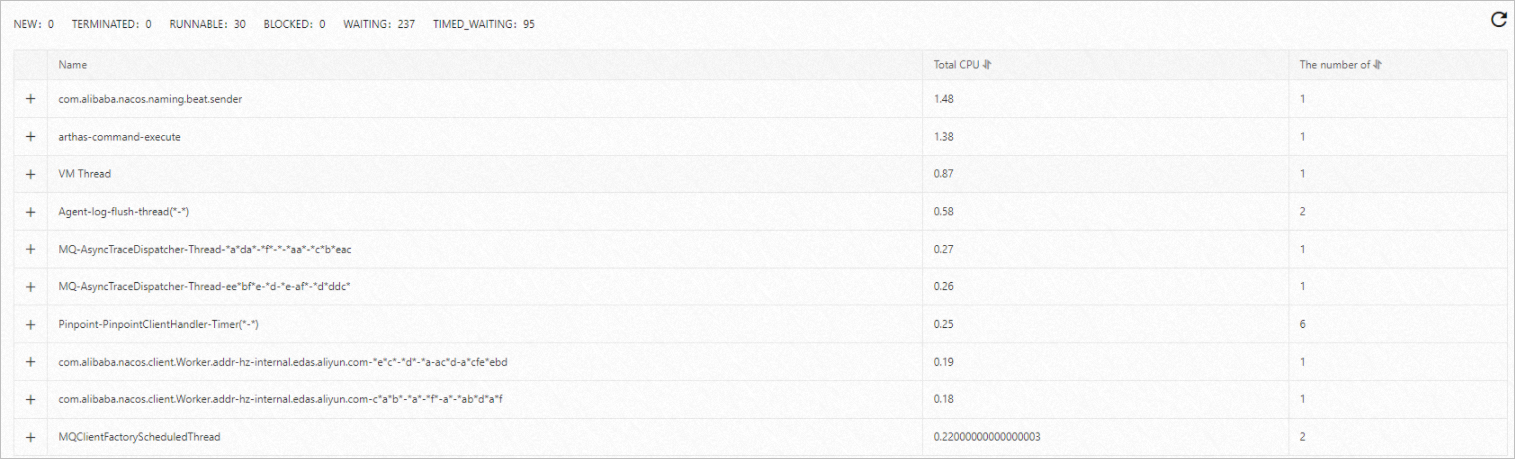
Click the + icon next to a thread category to expand it. Each thread entry shows the thread ID, CPU usage, and status.
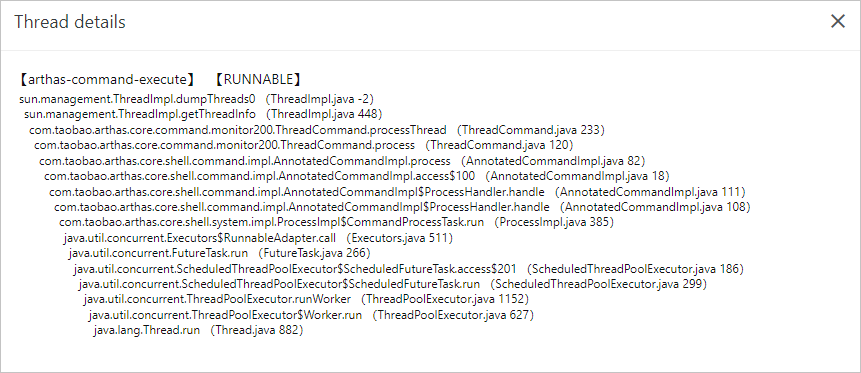
In the Actions column, click View the live stack to inspect the stack trace of a specific thread.
Analyze method execution
The Method execution analysis tab captures detailed execution records for any non-JDK method, including time consumption, input parameters, returned values, and internal call details. Use this tab to locate root causes of slow calls, missing logs, and non-reproducible issues.
On the Arthas Diagnosis page, click the Method execution analysis tab.
Enter a class name keyword in the search box and click the
 icon.
icon.From the search results, select the target class. Choose a method from the drop-down list on the right, then click OK. ARMS captures a random execution record of the selected method.
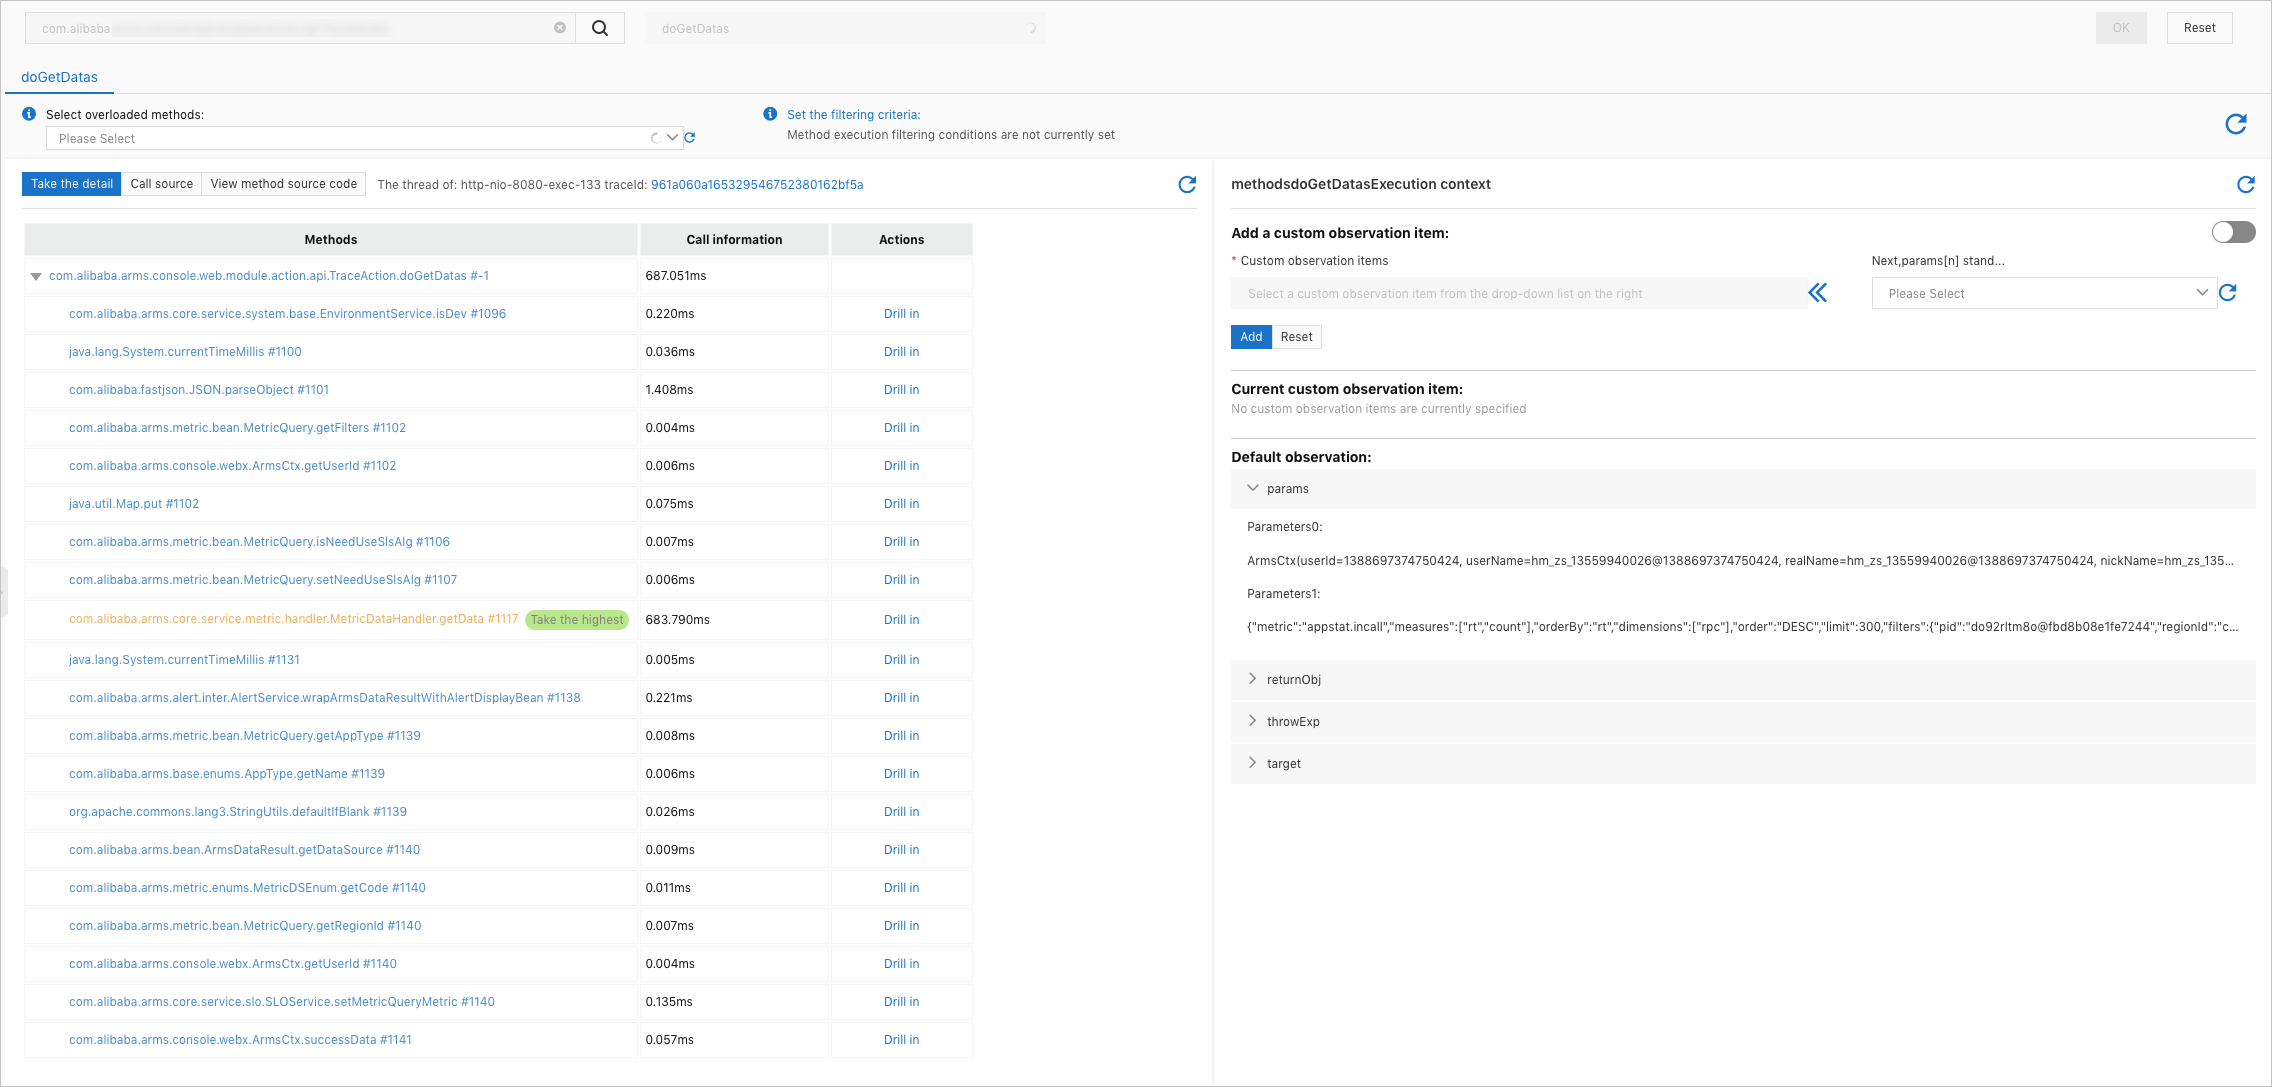
Execution stack
The Execution Stack section on the left shows internal execution records of the selected method.
To inspect an internal method in detail, click Drill in in the Actions column.
To view annotated source code with execution duration for each internal method, click View Source Code next to Execution Stack.
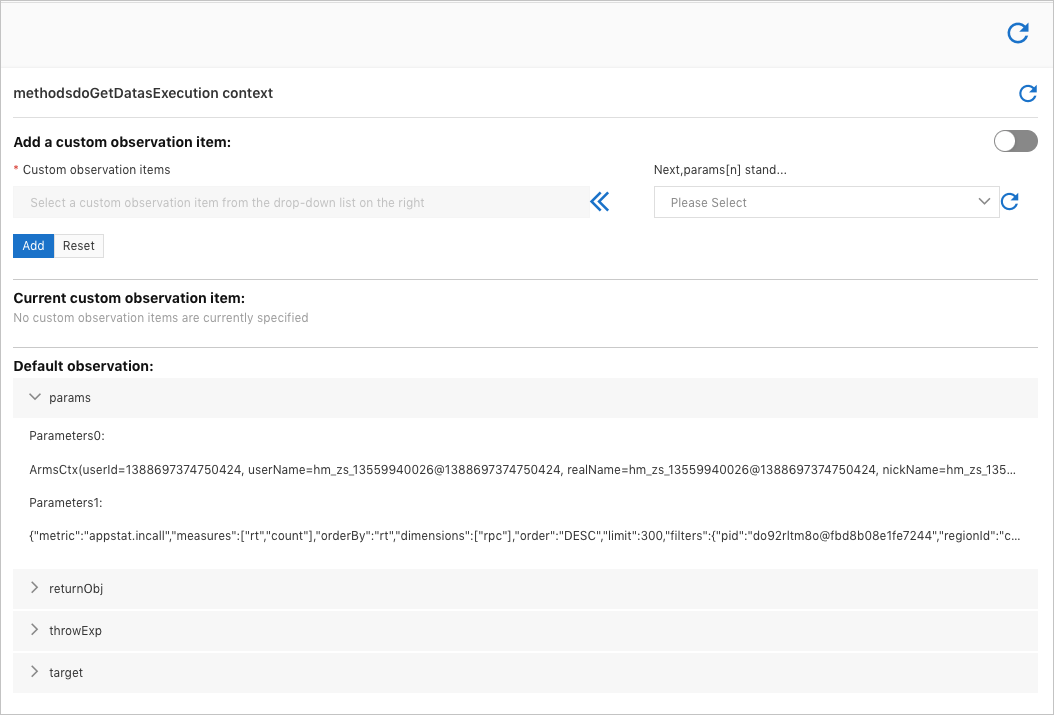
Method execution result
The Method Execution Result section on the right shows:
Parameter values
Returned values
Exceptions
Member variables
Trace ID
Set execution conditions
To capture a method execution record that meets specific criteria, use the Set Execution Conditions section on the right:
Select a reload method from the drop-down list.
In the Select Initial Filter Key drop-down list, select a key type and click the
 icon. Available key types:Note
If a nested key is selected, continue specifying the field until a base field is reached.
Key type Description params[n] The nth parameter of the method. returnObj The returned value of the method. Method execution duration The execution duration of the method. Exception thrown or not Whether an exception is thrown during execution. Select a condition.
Enter a value.
Click Add. The condition appears in the Current Filtering Conditions section.
In the upper-right corner of the Execution Stack section, click the
 icon to capture a new execution record based on the specified conditions.
View object properties
The objectViewer tab displays real-time property values of singleton objects. Use this tab to troubleshoot configuration errors, improper items in blacklists or whitelists, and abnormal member variable states.
On the Arthas Diagnosis page, click the objectViewer tab.
Enter a class name keyword in the search box and click the Search icon.
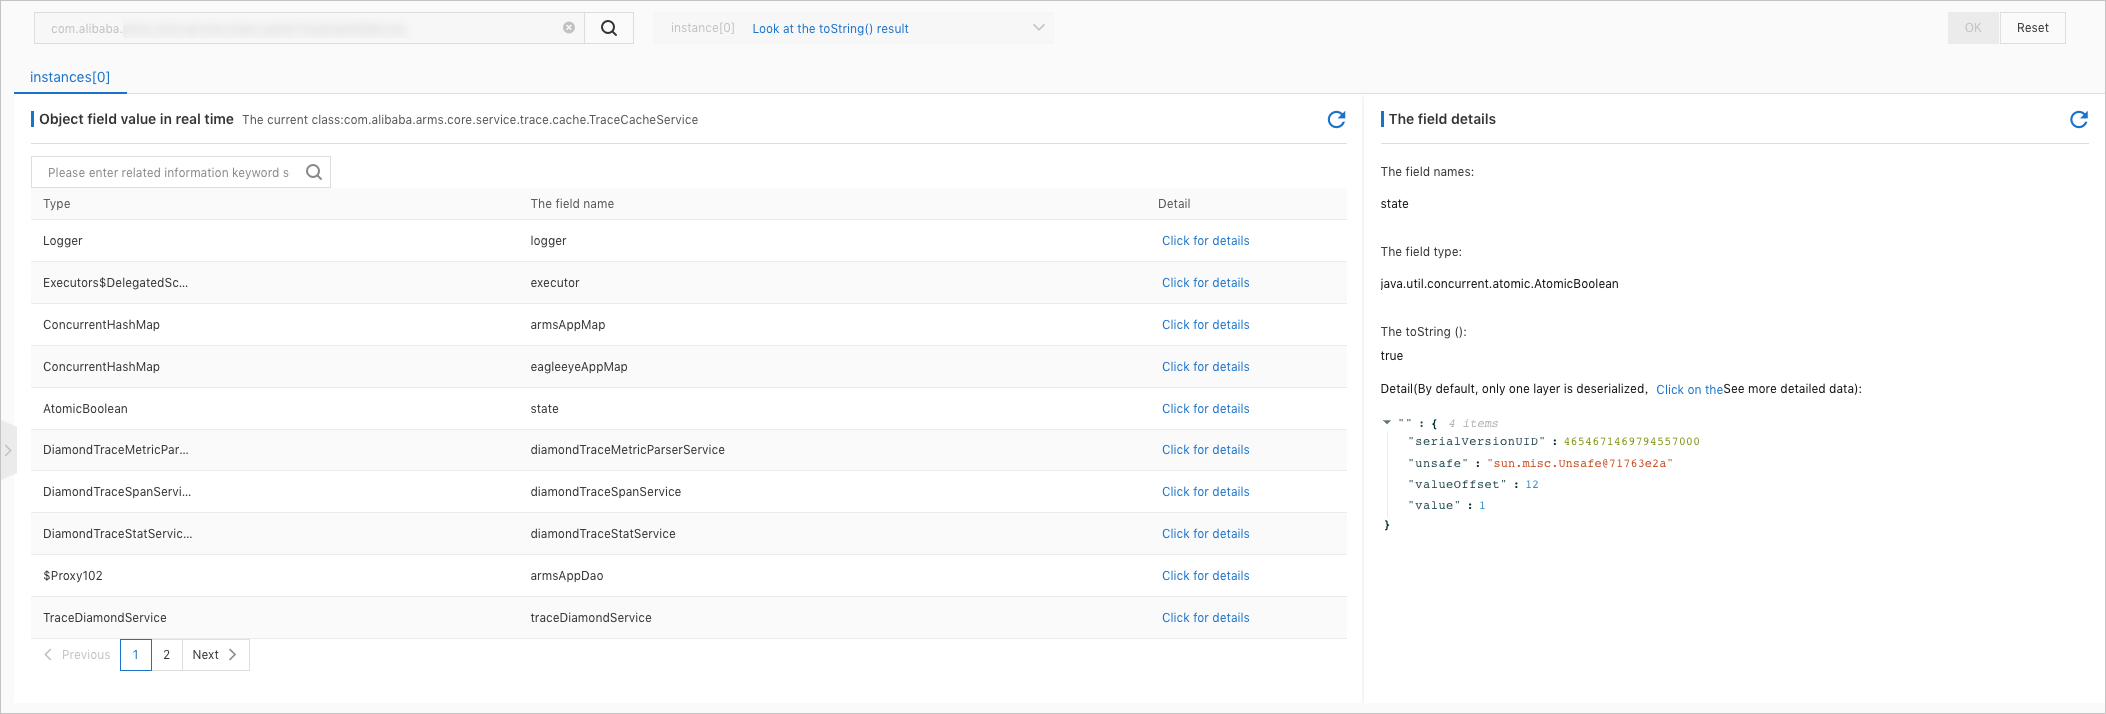
Select the target class from the results, select an instance in the right-side pane, and click OK. The real-time field values of the instance are displayed.
Simple fields: Values appear directly in the Details column of the Real-time Field Values of Object section.
Complex fields: Click View Details in the Details column. The full field value appears in the Field Details section on the right. To view additional data beyond what can be deserialized, click the click hyperlink in the parentheses next to Details.
Monitor components in real time
The Real-time board tab shows live metrics for components such as database connection pools and HTTP connection pools. Use this tab to identify resource-related issues.
On the Arthas Diagnosis page, click the Real-time board tab.
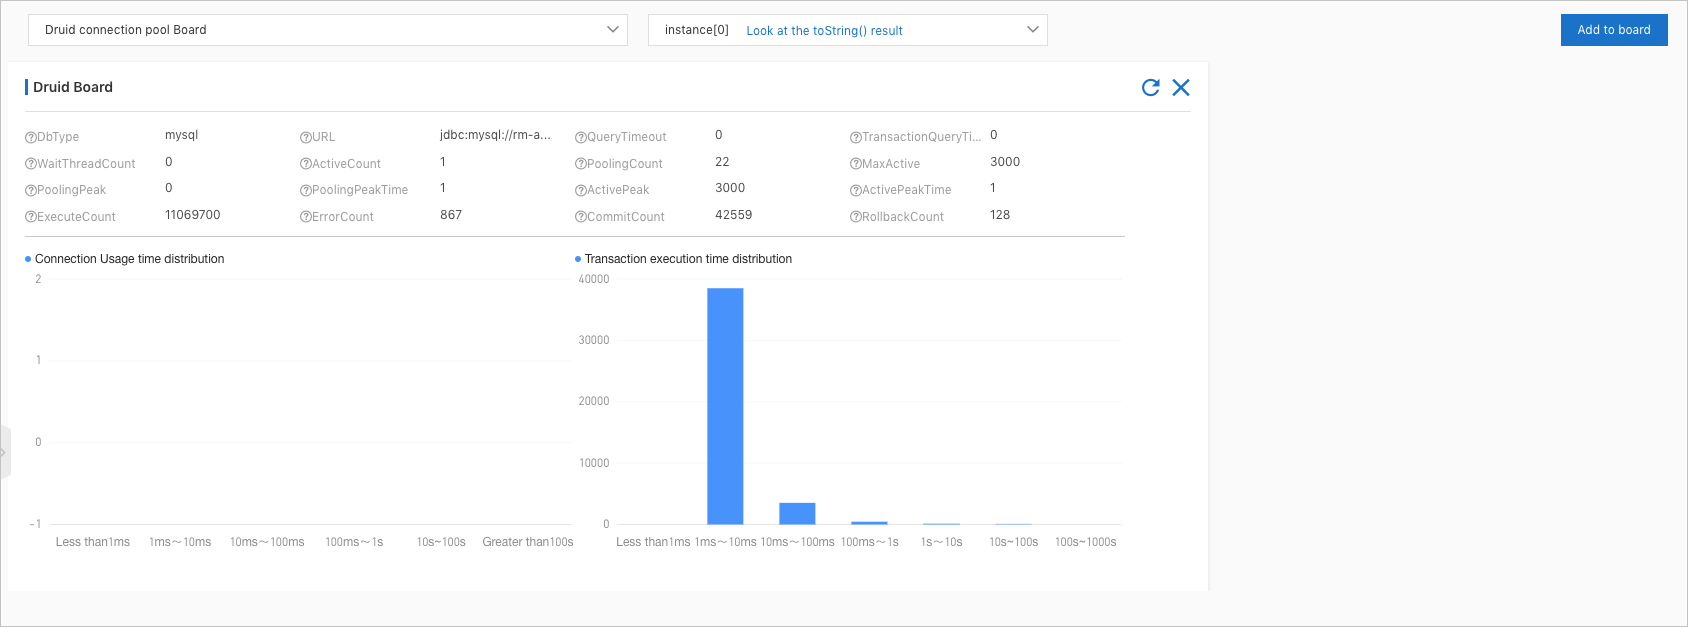
Select a dashboard from the drop-down list, select an instance, and click Add to board. The real-time component information is displayed. For example, a Druid connection pool dashboard shows basic configurations, connection pool status, and execution duration.
Use Arthas Shell
Arthas Shell is available only in the following regions: China (Beijing), China (Shanghai), China (Hangzhou), China (Shenzhen), and China (Zhangjiakou).
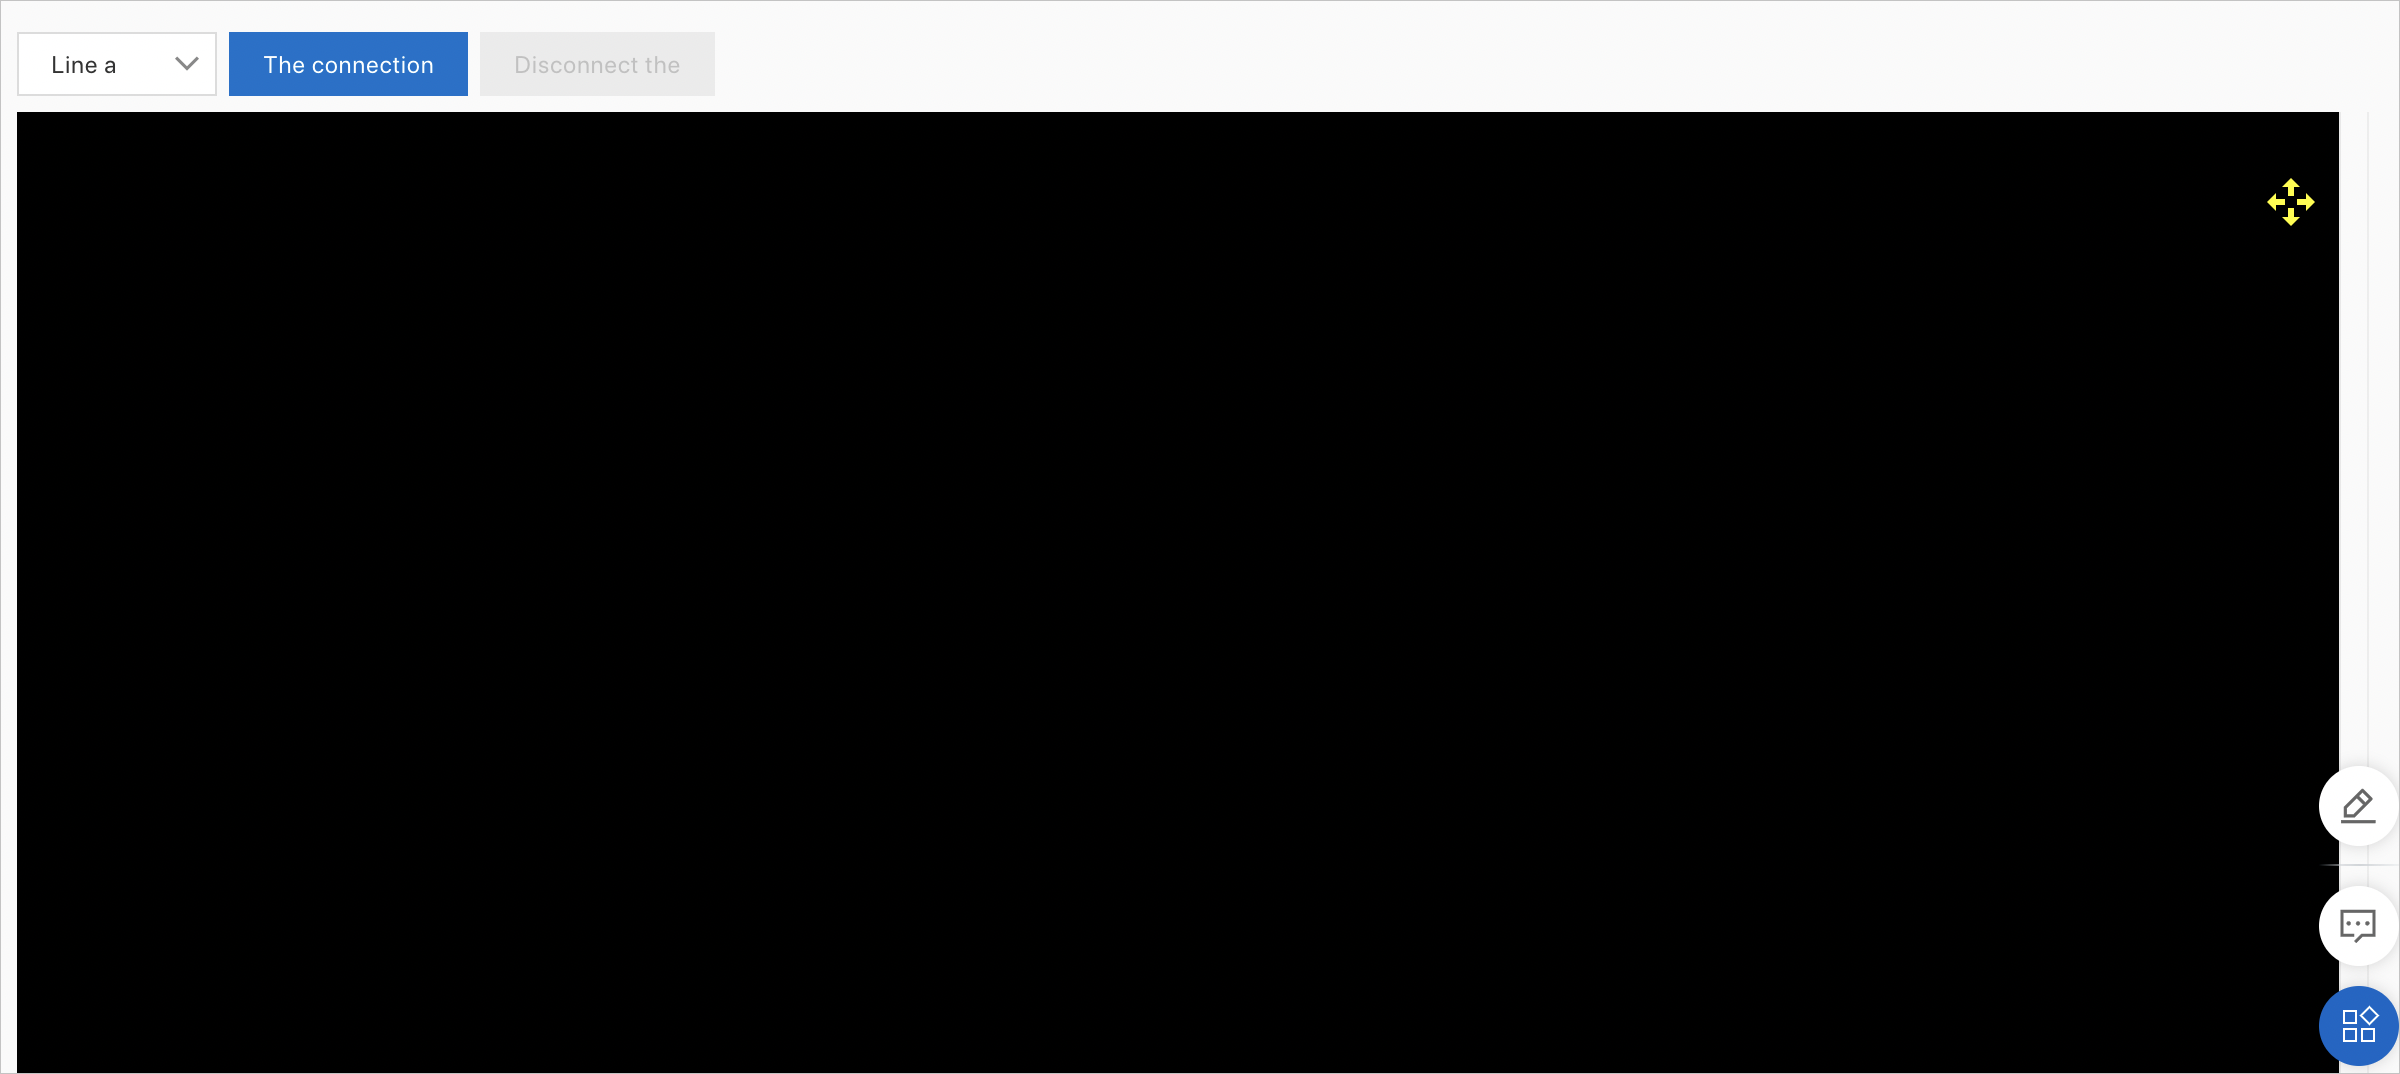
The Arthas Shell tab provides a CLI for running Arthas commands directly against the selected instance.
What's next
Use continuous profiling for routine CPU, memory, and I/O bottleneck analysis.