When producers send messages faster than consumers process them, unprocessed messages pile up on the ApsaraMQ for RocketMQ broker. This backlog -- called message accumulation -- directly increases message latency: the delay between when a message is produced and when it is consumed. Proper capacity planning and consumption tuning prevent accumulation from affecting your business.
This topic covers the TCP client consumption mechanism (Java SDK), root causes of accumulation, and how to prevent and resolve it.
When accumulation matters
Two scenarios require close attention:
Sustained backlog with no self-recovery. The downstream system consumes messages slower than the upstream system produces them, and the gap does not close on its own.
Strict real-time requirements. Even brief consumption delays are unacceptable for the business.
How the client consumes messages
An ApsaraMQ for RocketMQ TCP client in push mode processes messages in two phases:
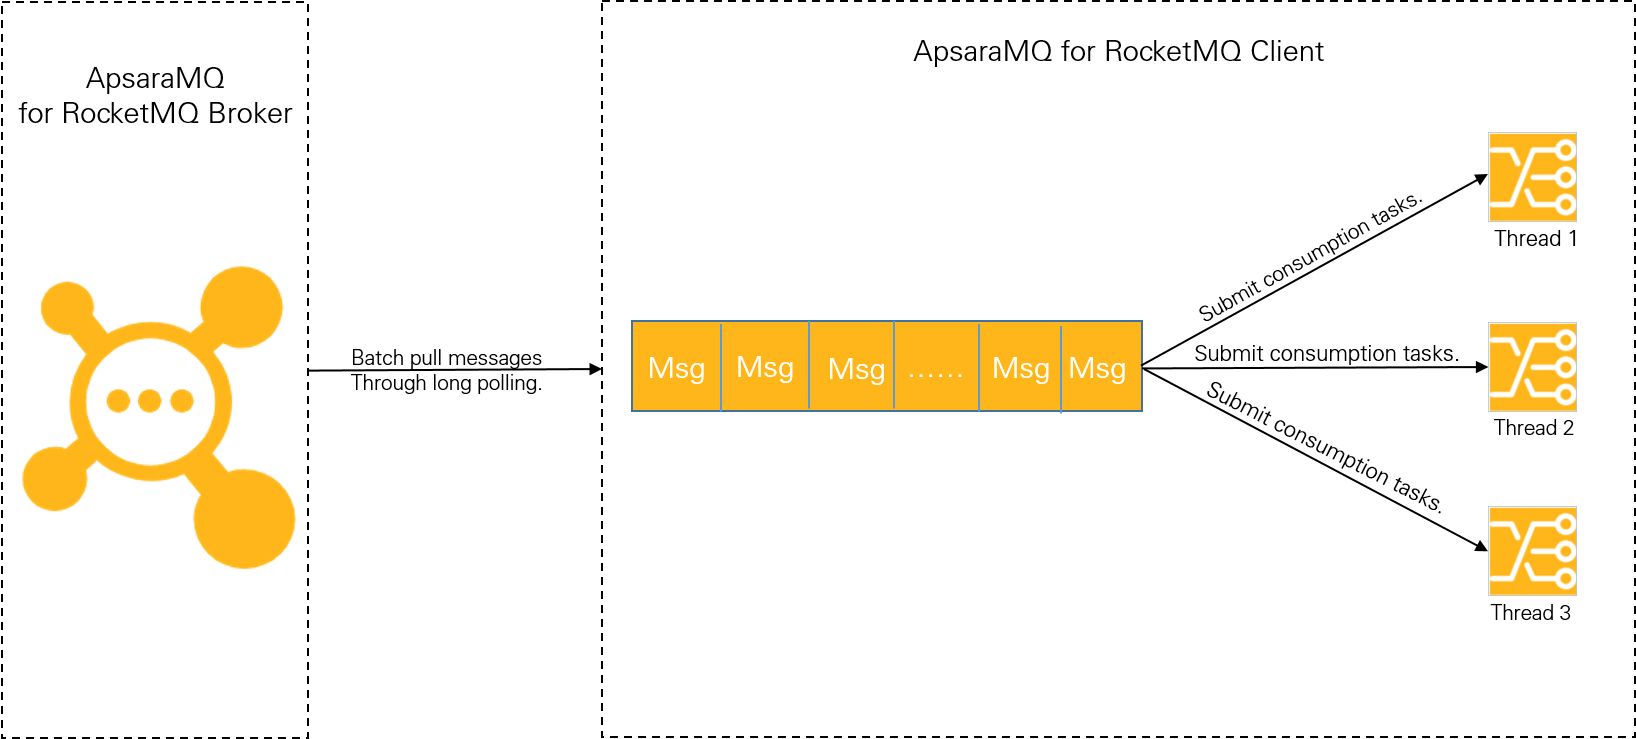
Phase 1: Pull messages from the broker
The client uses long polling to pull messages in batches and caches them in a local buffer queue. This phase is fast: even a low-spec server (4 vCPUs, 8 GB memory) with a single thread and single partition can reach tens of thousands of transactions per second (TPS). With multiple partitions, throughput scales to hundreds of thousands of TPS. Accumulation bottlenecks do not occur in this phase.
Phase 2: Process messages in the consumption thread
The client submits cached messages to the consumption thread, which runs the business logic. Processing speed depends on two factors:
Consumption duration -- how long it takes to process a single message.
Consumption concurrency -- how many messages are processed in parallel.
When the local buffer queue fills up, the client stops pulling new messages from the broker. The bottleneck is always in Phase 2, determined by consumption duration and concurrency. Between the two, consumption duration has the greater impact.
Root causes of accumulation
Message accumulation stems from either slow processing per message (consumption duration) or insufficient parallelism (consumption concurrency). Identify which factor is the bottleneck before tuning.
| Root cause | Symptoms | Primary fix |
|---|---|---|
| Consumption duration spike | Latency increases suddenly; thread count is adequate | Investigate downstream dependencies |
| Insufficient concurrency | CPU utilization is low; threads are idle waiting for messages | Increase threads per node or add nodes |
Consumption duration
Internal CPU computation is typically negligible compared to external I/O. The most common I/O-bound operations in consumption logic are:
Database reads and writes (for example, MySQL)
Cache reads and writes (for example, Redis)
Downstream service calls (for example, Dubbo RPC calls, HTTP API calls)
Profile and benchmark each external call to establish a performance baseline. Accumulation typically starts when a downstream dependency slows down or hits a capacity limit.
Example. A consumer writes each message to a database in 1 ms under normal load. During a traffic spike, the database reaches its capacity limit and write latency increases to 100 ms per message -- a 100x drop in consumption rate. Increasing the client's thread count does not help. The fix is to scale up the database.
Consumption concurrency
Concurrency determines how many messages the client processes in parallel:
| Message type | Effective concurrency |
|---|---|
| Normal messages | Threads per node x Number of nodes |
| Scheduled and delayed messages | Threads per node x Number of nodes |
| Transactional messages | Threads per node x Number of nodes |
| Ordered messages | min(Threads per node x Number of nodes, Number of partitions) |
Ordered message concurrency is capped by the number of partitions in the topic. To evaluate the partition count, contact Alibaba Cloud Customer Services.
Tuning priority: Scale threads on a single node first. Add more nodes only after the node's hardware resources are fully utilized.
Estimate the optimal thread count
For a node with C vCPUs, where each message takes T1 of CPU time and T2 of I/O wait time:
| Metric | Formula |
|---|---|
| Single-thread TPS | 1 / (T1 + T2) |
| Optimal thread count (100% CPU utilization) | C x (T1 + T2) / T1 |
| Maximum node throughput | Optimal thread count / (T1 + T2) |
Example. On a 4-vCPU node where T1 = 5 ms and T2 = 45 ms:
Optimal thread count = 4 x (5 + 45) / 5 = 40 threads
Maximum throughput = 40 / (5 + 45) = 800 TPS
This formula assumes ideal conditions -- no thread-switching overhead, I/O operations that do not consume CPU, and enough memory. In production, increase threads gradually and monitor CPU utilization, memory, and throughput before settling on a value.
Prevent accumulation
Benchmark consumption performance and plan capacity before deployment. A well-established baseline makes it easier to detect anomalies in production.
Benchmark consumption duration
Measure baseline consumption duration through stress tests and code profiling. Focus on the following:
Eliminate code-level issues. Check for excessive computational complexity, infinite loops, or deep recursion in the consumption logic.
Minimize external I/O. Determine whether each external call (database query, cache lookup, downstream API) is strictly necessary. Use local caching where possible to eliminate redundant calls.
Offload heavy operations. Move complex, time-consuming operations to asynchronous processing. Make sure the async design does not create race conditions -- for example, marking consumption as complete before the async operation finishes.
Set consumption concurrency
Find the optimal thread count. Gradually increase threads on a single node while monitoring CPU, memory, and throughput. Identify the point of diminishing returns.
Calculate the required node count. Based on the single-node throughput and peak upstream traffic:
Number of nodes = Peak traffic / Single-node throughput
Handle accumulation when it occurs
Step 1: Set up alerts
Configure message accumulation alerts through the monitoring and alerting feature in ApsaraMQ for RocketMQ. For details, see Configure message accumulation alerts.
Step 2: Diagnose and resolve
When an alert fires, identify whether the root cause is consumption duration or concurrency:
| Diagnosis | Check | Action |
|---|---|---|
| Consumption duration spiked | Query the consumption duration metric. Check database latency, cache hit rates, and downstream service health. | Fix the downstream dependency bottleneck. See Query the consumption duration. |
| Consumption concurrency is insufficient | CPU utilization is low and threads are not saturated. | Increase threads per node or add more nodes. |
For a complete remediation guide, see Handle accumulated messages.