This topic describes the test environment, test tool, test method, and test results of a performance test on Tair (Enterprise Edition) ESSD-based instances.
Test environment
Item | Description |
Region and zone | All tests are performed in Hangzhou Zone I. |
Instance architecture | The standard master-replica architecture is used. For more information, see Standard architecture. |
Virtual machine on which a stress testing tool is deployed | An Elastic Compute Service (ECS) instance of the ecs.g6e.13xlarge instance type is used. For more information, see Overview of instance families. |
ESSD-based instance type |
|
The performance test focuses on evaluating the performance of ESSD-based instances in the following scenarios:
Scenarios in which the memory size is larger than the data volume: Most data can be accessed from the memory. In these scenarios, the ratio of the memory size to the data volume is approximately 7:1.
Scenarios in which the data volume is larger than the memory size: Only part of the data is cached in the memory. Most access requests require read and write operations on disks. In these scenarios, the ratio of the memory size to the data volume is approximately 1:4.
Test tool
You can use open source YCSB to perform stress tests. YCSB is a Java tool that can be used to benchmark the performance of multiple types of databases. For more information about how to install and use YCSB, see YCSB.
In the test, the YCSB source code is modified to allow you to set the recordcount parameter to a LONG-typed value and test the string-related commands of Redis. To obtain the modified source code, download the YCSB source code package.
Workloads
Data loading: involves performing 100% SET operations on strings (write operations).
Uniform-Read: uses Workload A that consists of 100% GET operations on random strings (read operations). This workload aims to test read performance under harsh conditions.
Zipfian-Read: uses Workload C that follows a Zipfian distribution to test read performance in scenarios in which most read requests are sent to access a small portion of data. Most read scenarios belong to these scenarios.
Uniform-50%Read-50%Update: uses Workload A that consists of 50% SET operations on strings (update operations) and 50% GET operations on strings. This workload aims to test the performance of random updates.
For more information about workloads, see Core Workloads.
Test commands
The following script is used to test performance in scenarios where the data volume is larger than the memory size:
#! /bin/bash

ip=192.168.0.23
port=3100
timeout=30000
command_group=string
recordcount=640000000
run_operationcount=20000000
fieldcount=1
fieldlength=100
threads=32
load_sleep_time=600
run_sleep_time=60

echo "##################################### $command_group  ############################################"
#Load
./bin/ycsb load redis -s -P workloads/workloada -p "redis.host=${ip}" -p  "redis.port=${port}" -p "recordcount=${recordcount}" -p "operationcount=${recordcount}" -p "redis.timeout=${timeout}" -p "redis.command_group=${command_group}" -p "fieldcount=${fieldcount}" -p "fieldlength=${fieldlength}" -threads ${threads}
sleep ${load_sleep_time}

#Uniform-Read
./bin/ycsb run redis -s -P workloads/workloadc  -p "redis.host=${ip}" -p  "redis.port=${port}" -p "recordcount=${recordcount}" -p "operationcount=${run_operationcount}" -p "redis.timeout=${timeout}" -p "redis.command_group=${command_group}" -p "fieldcount=${fieldcount}" -p "fieldlength=${fieldlength}" -p "requestdistribution=uniform" -threads ${threads}
sleep ${run_sleep_time}

#Zipfian-Read
./bin/ycsb run redis -s -P workloads/workloadc  -p "redis.host=${ip}" -p  "redis.port=${port}" -p "recordcount=${recordcount}" -p "operationcount=${run_operationcount}" -p "redis.timeout=${timeout}" -p "redis.command_group=${command_group}" -p "fieldcount=${fieldcount}" -p "fieldlength=${fieldlength}" -p "requestdistribution=zipfian" -threads ${threads}
sleep ${run_sleep_time}

#Uniform-50%Read-50%Update
./bin/ycsb run redis -s -P workloads/workloada -p "redis.host=${ip}" -p "redis.port=${port}" -p "recordcount=${recordcount}" -p "operationcount=${run_operationcount}" -p "redis.timeout=${timeout}" -p "redis.command_group=${command_group}" -p "fieldcount=${fieldcount}" -p "fieldlength=${fieldlength}" -p "requestdistribution=uniform" -threads ${threads}Parameter | Description |
ip | The IP address of the Tair instance. |
port | The service port of the Tair instance. |
timeout | The timeout period of the test command. Unit: ms. |
command_group | The type of data to be tested. Set this parameter to String. |
recordcount | The amount of data prepared during the data loading phase. |
run_operationcount | The amount of data involved in the operation. When you set this parameter, take note of the following rules:
|
fieldcount | The number of fields. Set this parameter to 1. |
fieldlength | The length of each field. Set this parameter to 100. |
threads | The number of YCSB threads. Set this parameter based on the instance type. |
Test results
Test metric | Description |
QPS | The number of read and write operations that are processed per second. |
Average Latency | The average latency of read or write operations. Unit: µs. |
99th Percentile Latency | The highest latency for the fastest 99% of operations. Unit: µs. For example, if this parameter is set to 500 µs, 99% of the operations are processed within 500 µs. |
Scenarios in which the memory size is larger than the data volume
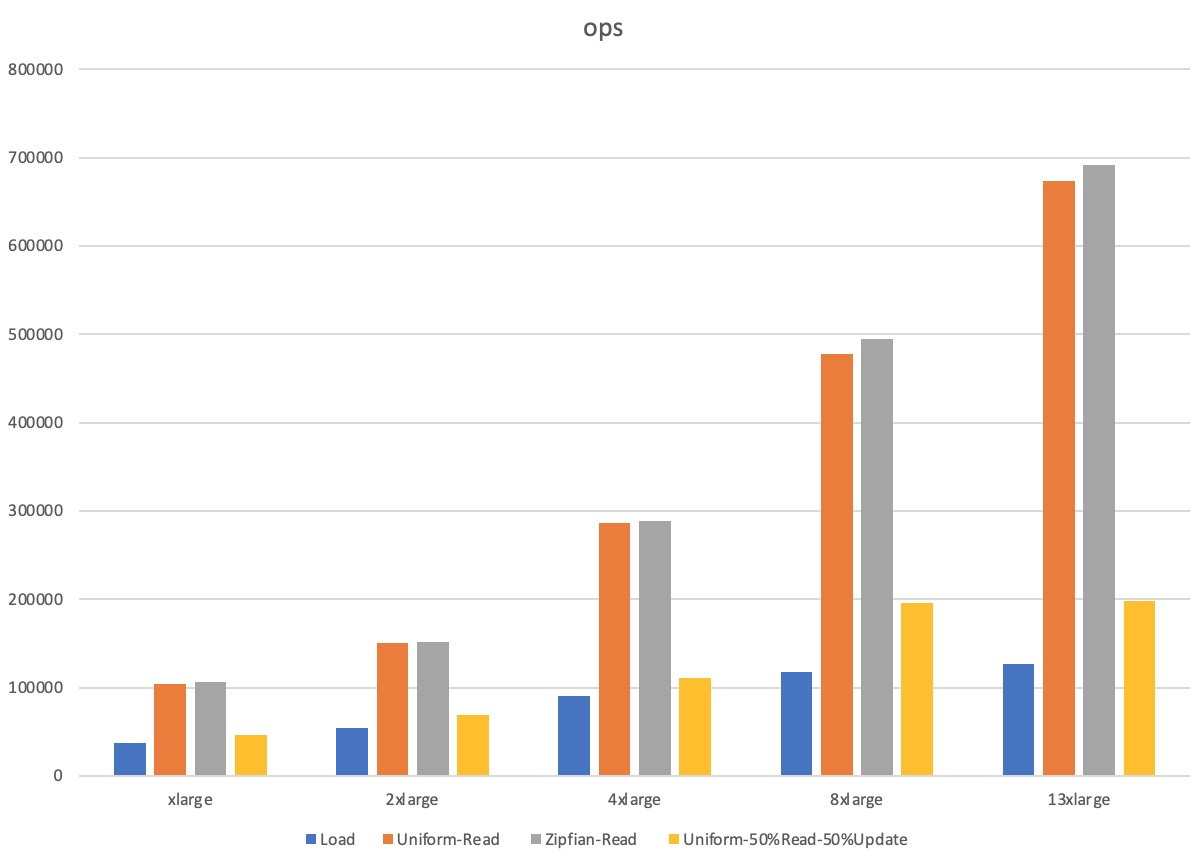
Instance type | YCSB configuration | Workload | QPS | Average latency (µs) | 99th percentile latency (µs) |
tair.essd.standard.xlarge | recordcount=20000000 run_operationcount=20000000 threads=32 | Load | 36,740 | 851 | 1,595 |
Uniform-Read | 103,890 | 294 | 907 | ||
Zipfian-Read | 106,357 | 288 | 865 | ||
Uniform-50%Read-50%Update | 46,610 | Read: 530 | Read: 1,108 | ||
Update: 795 | Update: 1,684 | ||||
tair.essd.standard.2xlarge | recordcount=40000000 run_operationcount=40000000 threads=50 | Load | 54,670 | 911 | 1,528 |
Uniform-Read | 150,796 | 314 | 995 | ||
Zipfian-Read | 151,110 | 314 | 977 | ||
Uniform-50%Read-50%Update | 69,137 | Read: 537 | Read: 948 | ||
Update: 878 | Update: 1,479 | ||||
air.essd.standard.4xlarge | recordcount=80000000 run_operationcount=80000000 threads=100 | Load | 90,703 | 1,099 | 1,697 |
Uniform-Read | 285,833 | 339 | 1,196 | ||
Zipfian-Read | 288,750 | 335 | 1,162 | ||
Uniform-50%Read-50%Update | 110,316 | Read: 757 | Read: 1,114 | ||
Update: 1,041 | Update: 1,536 | ||||
tair.essd.standard.8xlarge | recordcount=160000000 run_operationcount=160000000 threads=120 | Load | 117,581 | 1,011 | 1,692 |
Uniform-Read | 477,099 | 242 | 784 | ||
Zipfian-Read | 494,550 | 234 | 727 | ||
Uniform-50%Read-50%Update | 196,245 | Read: 519 | Read: 829 | ||
Update: 691 | Update: 1,096 | ||||
tair.essd.standard.13xlarge | recordcount=240000000 run_operationcount=240000000 threads=160 | Load | 126,366 | 1,249 | 2,281 |
Uniform-Read | 673,183 | 231 | 637 | ||
Zipfian-Read | 691,383 | 230 | 652 | ||
Uniform-50%Read-50%Update | 197,803 | Read: 678 | Read: 940 | ||
Update: 935 | Update: 1,925 |
Scenarios in which the data volume is larger than the memory size
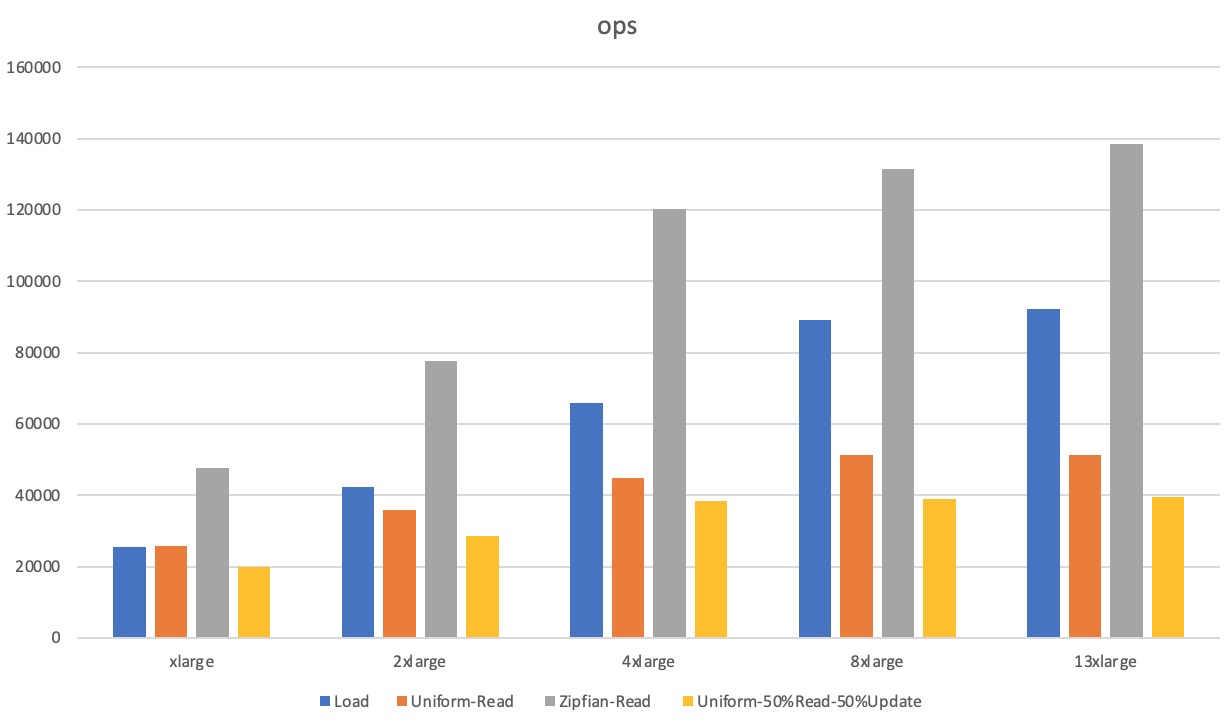
Instance type | YCSB configuration | Workload | QPS | Average latency (µs) | 99th percentile latency (µs) |
tair.essd.standard.xlarge | recordcount=640000000 run_operationcount=20000000 threads=32 | Load | 25,561 | 1,245 | 3,497 |
Uniform-Read | 25,727 | 1,239 | 2,042 | ||
Zipfian-Read | 47,559 | 667 | 1,217 | ||
Uniform-50%Read-50%Update | 19,731 | Read: 1,576 | Read: 6,383 | ||
Update: 1,639 | Update: 6,487 | ||||
tair.essd.standard.2xlarge | recordcount=1280000000 run_operationcount=40000000 threads=50 | Load | 42,287 | 1,179 | 3,465 |
Uniform-Read | 35,794 | 1,394 | 1,880 | ||
Zipfian-Read | 77,759 | 637 | 1,219 | ||
Uniform-50%Read-50%Update | 28,656 | Read: 1,716 | Read: 8,863 | ||
Update: 1,761 | Update: 8,951 | ||||
air.essd.standard.4xlarge | recordcount=2560000000 run_operationcount=80000000 threads=100 | Load | 65,923 | 1,514 | 6,615 |
Uniform-Read | 44,753 | 2,232 | 7,903 | ||
Zipfian-Read | 120,337 | 826 | 1,382 | ||
Uniform-50%Read-50%Update | 38,470 | Read: 2,577 | Read: 8,535 | ||
Update: 2,617 | Update: 8,583 | ||||
tair.essd.standard.8xlarge | recordcount=5120000000 run_operationcount=160000000 threads=120 | Load | 89,231 | 1,340 | 9,575 |
Uniform-Read | 51,175 | 2,343 | 2,955 | ||
Zipfian-Read | 131,317 | 911 | 1,573 | ||
Uniform-50%Read-50%Update | 38,930 | Read: 3,063 | Read: 8,695 | ||
Update: 3,097 | Update: 8,735 | ||||
tair.essd.standard.13xlarge | recordcount=7680000000 run_operationcount=240000000 threads=160 | Load | 92,163 | 1,733 | 9,879 |
Uniform-Read | 51,267 | 3,510 | 16,623 | ||
Zipfian-Read | 138,522 | 1,152 | 2,131 | ||
Uniform-50%Read-50%Update | 39,584 | Read: 4,022 | Read: 12,159 | ||
Update: 4,057 | Update: 12,239 |