Slow SQL queries greatly affect the stability of your ApsaraDB RDS for PostgreSQL instance. If issues such as high load and performance jitters occur on your RDS instance, the administrator or developer first checks whether slow SQL queries are being run. Database Autonomy Service (DAS) provides the slow query log analysis feature. The feature collects statistics on and analyzes the slow SQL queries that are run in your RDS instance, and locates performance issues and provides solutions to the issues. This helps improve system stability and reliability.
Prerequisites
Your RDS instance runs RDS High-availability Edition.
Procedure
- Go to the Instances page. In the top navigation bar, select the region in which the RDS instance resides. Then, find the RDS instance and click the ID of the instance.
In the left-side navigation pane of the page that appears, choose .
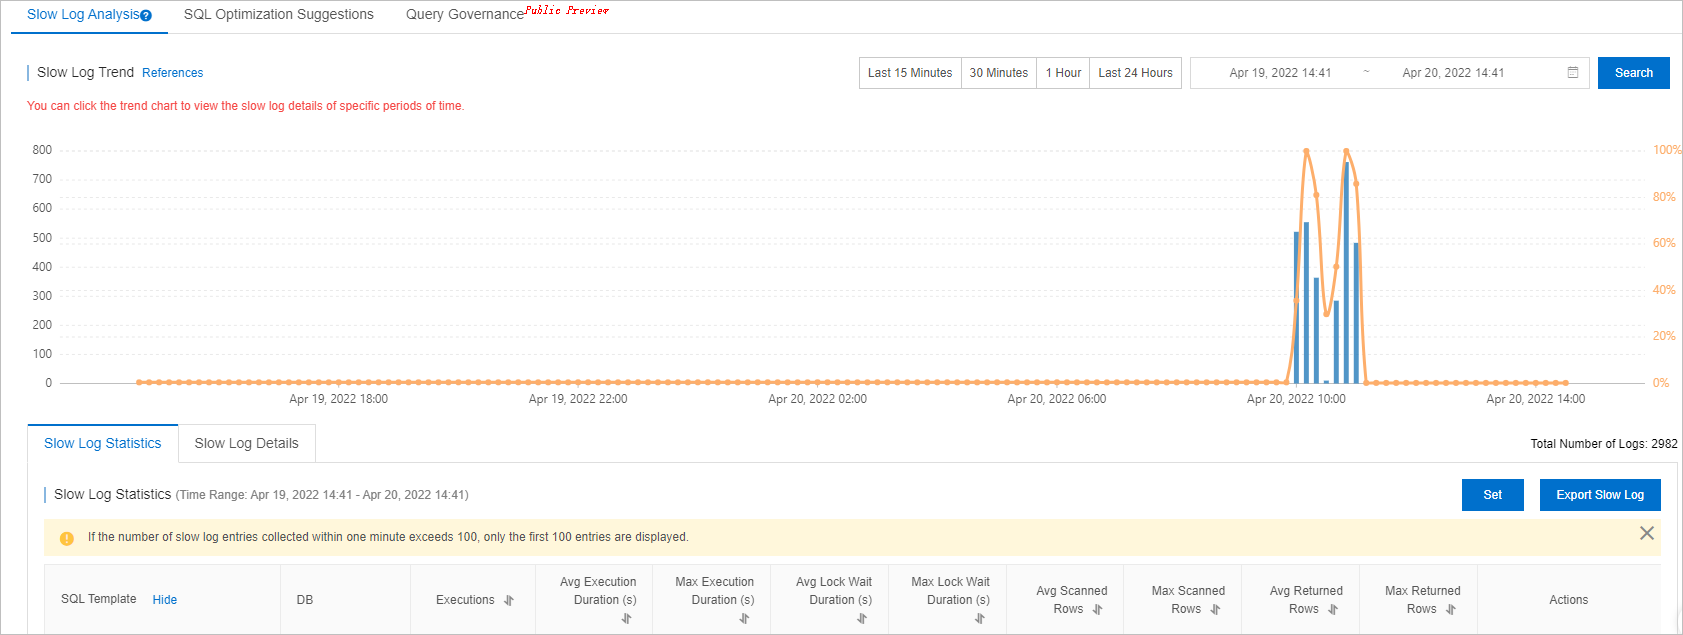
On the Slow Log Analysis tab, specify a time range and view the trends, statistics, and details of the slow query logs within the specified time range.
NoteWhen you specify the time range, the end time must be later than the start time, and the interval between the start time and the end time cannot exceed 24 hours. You can query slow query logs within the previous month.
You can click a time point in the trend chart and view the statistics and details of the slow queries at the time point.
Click Export Slow Log to download slow query logs.
On the Slow Log Statistics tab, perform the following steps:
Find the SQL template that you want to view and click Sample in the Actions column. In the Slow Log Sample dialog box, view the details of the slow query logs.
Find the SQL template that you want to manage and click Optimize in the Actions column. In the SQL Diagnostic Optimization dialog box, view the SQL diagnostics results.
If you accept the SQL optimization suggestions, click Copy in the upper-right corner and paste the optimized SQL statements to the database client or Data Management (DMS) for execution. If you do not accept the SQL optimization suggestions, click Cancel.
NoteDAS performs SQL diagnostics based on the complexity of SQL statements, the amount of data in the table, and the database load. Suggestions may be returned in more than 20 seconds after the SQL diagnostics is performed. After the diagnostics is complete, the SQL diagnostics engine provides diagnostics results, optimization suggestions, and expected optimization benefits. You can determine whether to accept the suggestions based on the diagnostics results.
You can also click Database Expert Service to purchase the expert service. Database Expert Service provides value-added professional database services, such as emergency solutions, health diagnostics, performance optimization, security assurance, and data migration.
On the Slow Log Details tab, find the SQL template that you want to manage and click Optimize in the Actions column. You can also perform SQL diagnostic optimization on the SQL template.
References
You can enable the automatic SQL optimization feature. If slow SQL queries are run in your RDS instance, DAS automatically diagnoses and optimizes the slow SQL queries. For more information, see Use the automatic SQL optimization feature for an ApsaraDB RDS for PostgreSQL instance.