Database administrators and developers focus on performance optimization and monitoring. This topic describes the original performance insight feature. This feature aggregates the statistics on SQL statements based on the Performance Schema feature provided by MySQL and offers instance-level load monitoring, association analysis, and performance optimization. The feature enables you to evaluate the loads on your RDS instance and troubleshoot performance issues and helps improve database performance and stability.
Prerequisites
Your RDS instance runs one of the following MySQL versions and RDS editions:
MySQL 8.0 on RDS High-availability Edition, RDS Enterprise Edition, or RDS Cluster Edition
MySQL 5.7 on RDS High-availability Edition, RDS Enterprise Edition, or RDS Cluster Edition
MySQL 5.6 on RDS High-availability Edition
MySQL 5.5 on RDS High-availability Edition
Notification
DAS provides the new performance insight feature for ApsaraDB RDS for MySQL. Compared with the original performance insight feature, the new performance insight feature collects statistics on SQL statements based on the Performance Schema feature of MySQL. This way, you can quickly view the resource usage, number of executions, number of scanned rows, and execution duration of all SQL statements. In addition, the new performance insight feature allows you to throttle and optimize the specified SQL statements. For more information, see Use the new performance insight feature for an ApsaraDB RDS for MySQL instance.
Data sources
The original performance insight collects and analyzes data from the following major sources:
If the Performance Schema feature is enabled for your RDS instance, the original performance insight collects and analyzes data stored in the Performance Schema feature.
If the Performance Schema feature is disabled for your RDS instance, the original performance insight feature collects and analyzes the data of active sessions.
Procedure
Go to the Instances page. In the top navigation bar, select the region in which the RDS instance resides. Then, find the RDS instance and click the ID of the instance.
In the left-side navigation pane, choose .
On the page that appears, click Back to Previous Version. If Back to Previous Version is not displayed, you are already using the original performance insight feature.

On the page that appears, click Enable Performance Insight. In the message that appears, click OK.
NoteIf you no longer require the performance insight feature, you can click Disable Performance Insight on the Performance Insight page.
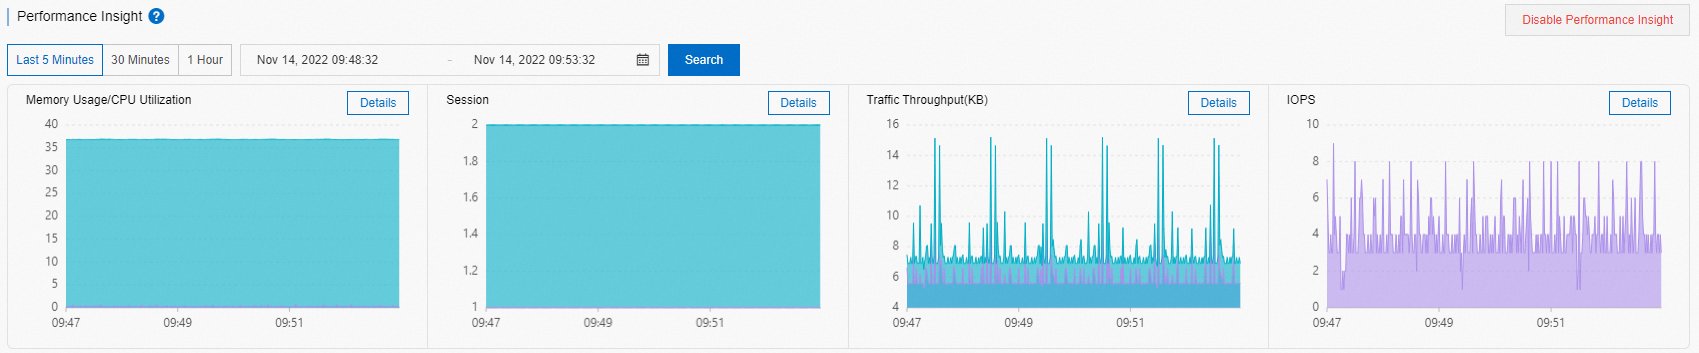
In the Performance Insight section, specify a time range and then click Search to view the performance metrics within the specified period.
NoteWhen you select a time range, the end time must be later than the start time.
Data generated in up to seven days within the last month are displayed in the Performance Insight section.
The information about sessions in the last three days is displayed in the Average Active Session section.
In the Performance Insight section, you can specify a time range to view the performance metrics within the specified period. You can view the details of a specific performance metric. For example, if you want to view the CPU utilization of the RDS instance, click Details on the right of Memory Usage/CPU Utilization.
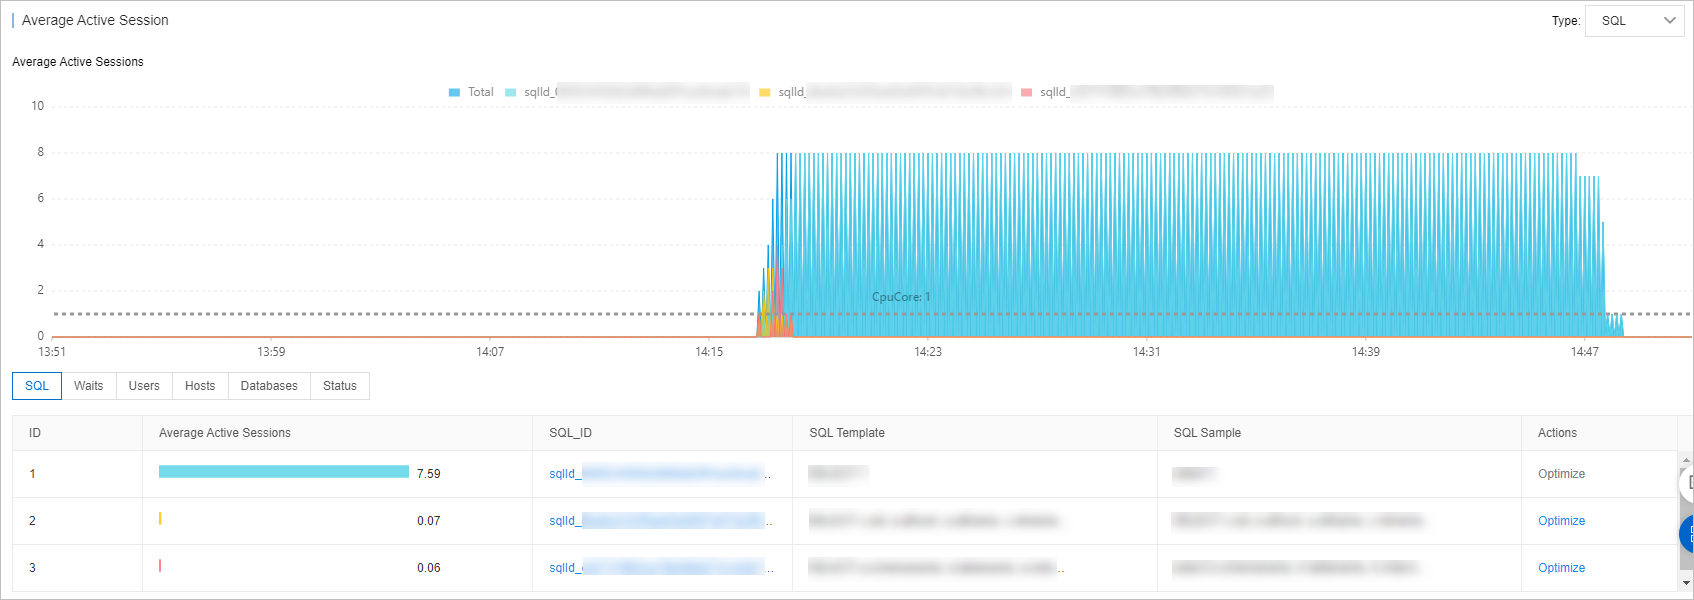
In the Average Active Session section, you can view the trends of different types of sessions, such as sessions that are created to execute SQL statements. You can also view the instance loads from multiple dimensions. This helps you identify the root causes of performance issues.
References
You can enable the autonomy features of DAS to implement automatic governance to resolve performance issues.