Overview
You can use the diagnostics feature to learn about the load and health status of a tenant.
Procedure
Log on to the ApsaraDB for OceanBase console.
In the left-side navigation pane, click Instances.
On the Instances page, click the target instance name to enter the instance workbench.
In the left-side navigation pane, click Diagnostics.
On the Diagnostics page, select the target tenant from the drop-down list.
NoteBy default, the system displays the diagnostic data for the last 6 hours. You can also select Last 5 Minutes, Last Half Hour, Last Hour, or Custom Time.
If you need more features, such as one-click diagnostics, root cause analysis, capacity forecast, etc., click Autonomous Service.
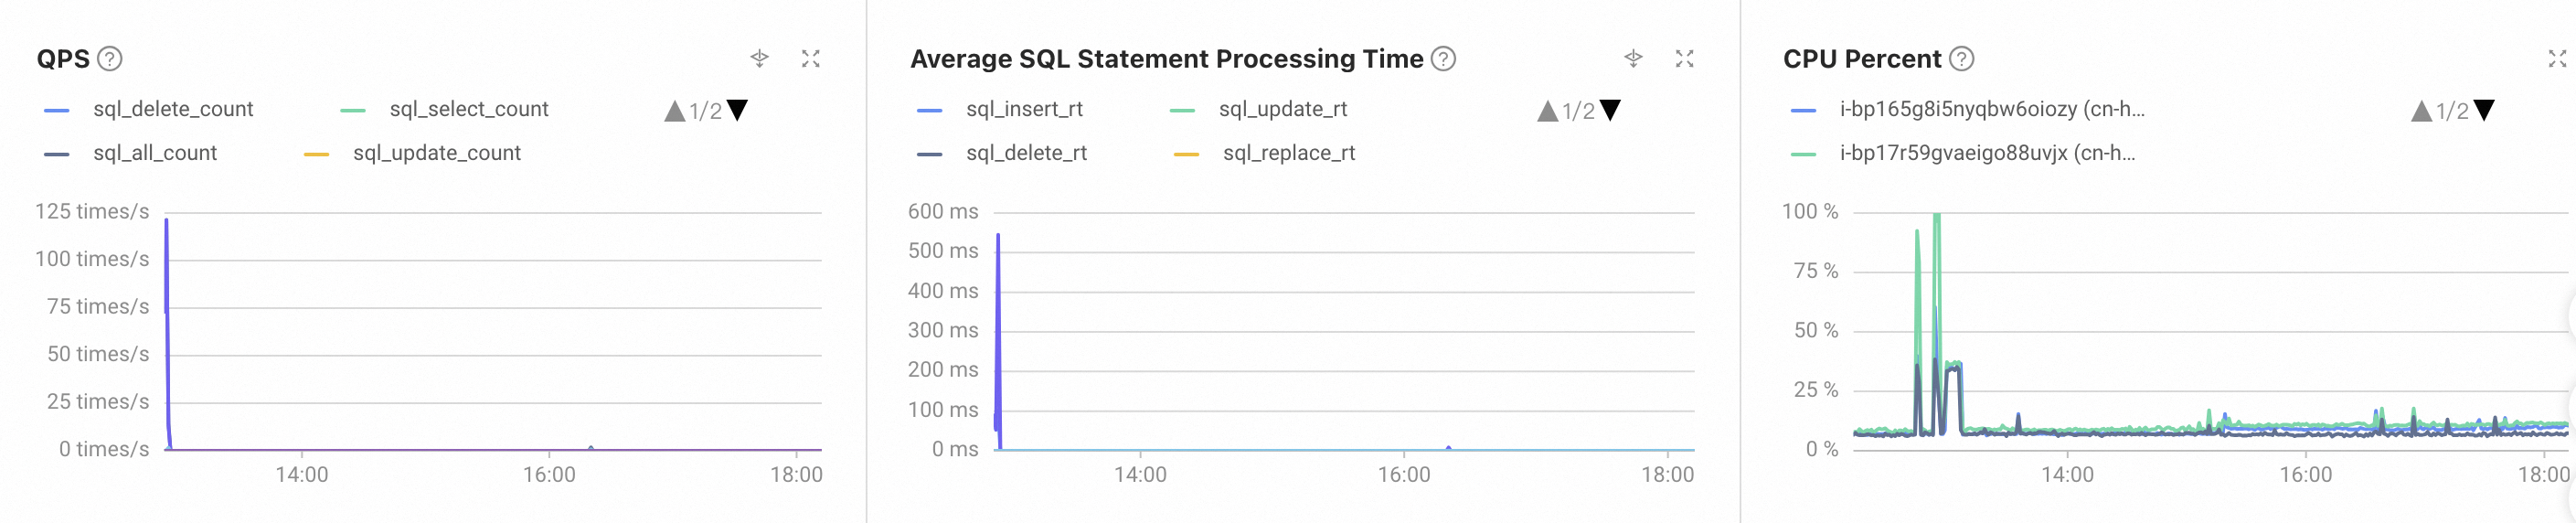
View the diagnostic data of the target tenant, including: QPS, Average SQL Statement Processing Time, and CPU Percent.
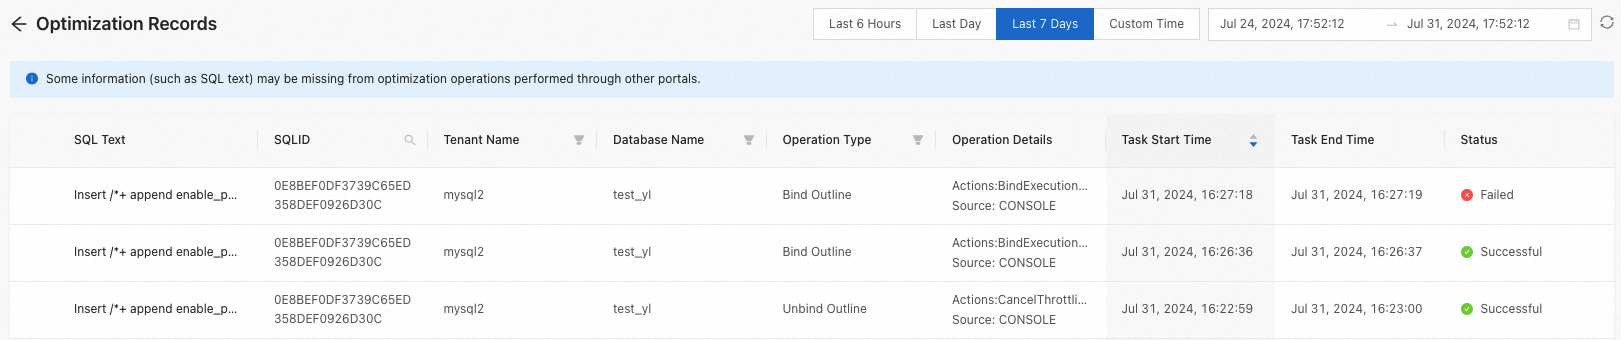
Click View Optimization Records in the upper-right corner of the Diagnostics page to view historical optimization records.
On the Optimization Records page, view the optimization records of the current tenant, including: SQL Text, SQL ID, Tenant Name, Database Name, Operation Type, Operation Details, Task Start Time, Task End Time, and Status.
On the SQL tab, view the SQL analysis information of the tenant. For more information, see SQL basic information.
On the Session Management tab, view the session information of the tenant. For more information, see Session management.
On the SQL Audit tab, view the SQL audit information. For more information, see SQL audit.