SQL basic information
The SQL diagnostics feature is designed to analyze and diagnose TopSQL, SlowSQL, and Suspicious SQL to help you optimize database performance.
Basic concepts
The basic concepts of SQL diagnostics are as follows:
TopSQL: refers to SQL statements with the overall longest response time within the selected time range.
SlowSQL: refers to SQL statements whose execution time exceeds 500 ms.
Suspicious SQL: refers to SQL statements that may cause performance issues and are filtered out based on rules and algorithms.
Currently, the system has the following restrictions on Standard Edition (Key-Value) cluster instances:
For KV cluster instances with version numbers greater than or equal to 4.2.4 but less than 4.3.0, the diagnostic information of TopSQL and SlowSQL can be displayed.
For KV cluster instances of other versions, only the diagnostic information of SlowSQL can be displayed.
TopSQL
TopSQL refers to SQL statements with the overall longest response time within the selected time range. You can perform the following operations related to TopSQL:
Filter TopSQL by quick filters, such as Full Table Scan, Multi-partition scan, and Multiple Remote Executions.
Click View Samples in the Operation column to view the SQL statement.
In the Operation column of a specific SQL, click on
 and select Set Throttling. You can check multiple SQLs to set throttling in batches.
Click the plus sign (+) in front of the SQL text to view the last error and error summary during the statistical period.
Check Aggregate in in the upper right corner of the list to display SQLs according to Aggregation IN, but this will not affect the statistical data. You can select multiple SQLs (including those with Aggregation IN) to set throttling in batches.
Click View Optimization Suggestions in the upper right corner of the list to go to the optimization center and view optimization suggestions.
Click TopSQL Comparison in the upper right corner of the list to compare the execution of the same SQL statement during different periods on the same node or during the same period across different nodes, as well as the execution of a single SQL statement during different periods or across different nodes.
Comparison of different periods: Specify the baseline period and comparison period. Click Comparative Analysis to view the Comparison of Details and Comparison of Performance Trends.
Comparison of different nodes: Specify the baseline node and comparison node. Click Comparative Analysis to view the Comparison of Details and Comparison of Response Time Trends.
Single SQL Different Periods Comparison: Compare and analyze the execution of individual SQL or aggregated SQL during the baseline and comparison periods, and then check the Total Database Time Consumption and Total Executions.
Single SQL Different Nodes Comparison: Compare and analyze the execution of individual SQL or aggregated SQL across different analysis nodes, and then check the Total Database Time Consumption and Total Executions.
NoteTwo SQL statements with the same SQL ID in the same database are considered the same.
Comparison of different nodes is performed only when the same SQL statement is executed on different nodes. Otherwise, no comparison result will be displayed.
To perform comparative analysis of a single SQL across different periods or across different nodes, you can also first enter the SQL ID and then select ... > Single SQL Comparison in the Operation column for the corresponding SQL.
Click Customize Column in the upper right corner of the list to customize other metrics you need.
In the popup window, set the Column Expression, such as (@avgCpuTime * @avgDiskReads) / 2.
Enter the Column Name.
Click OK.
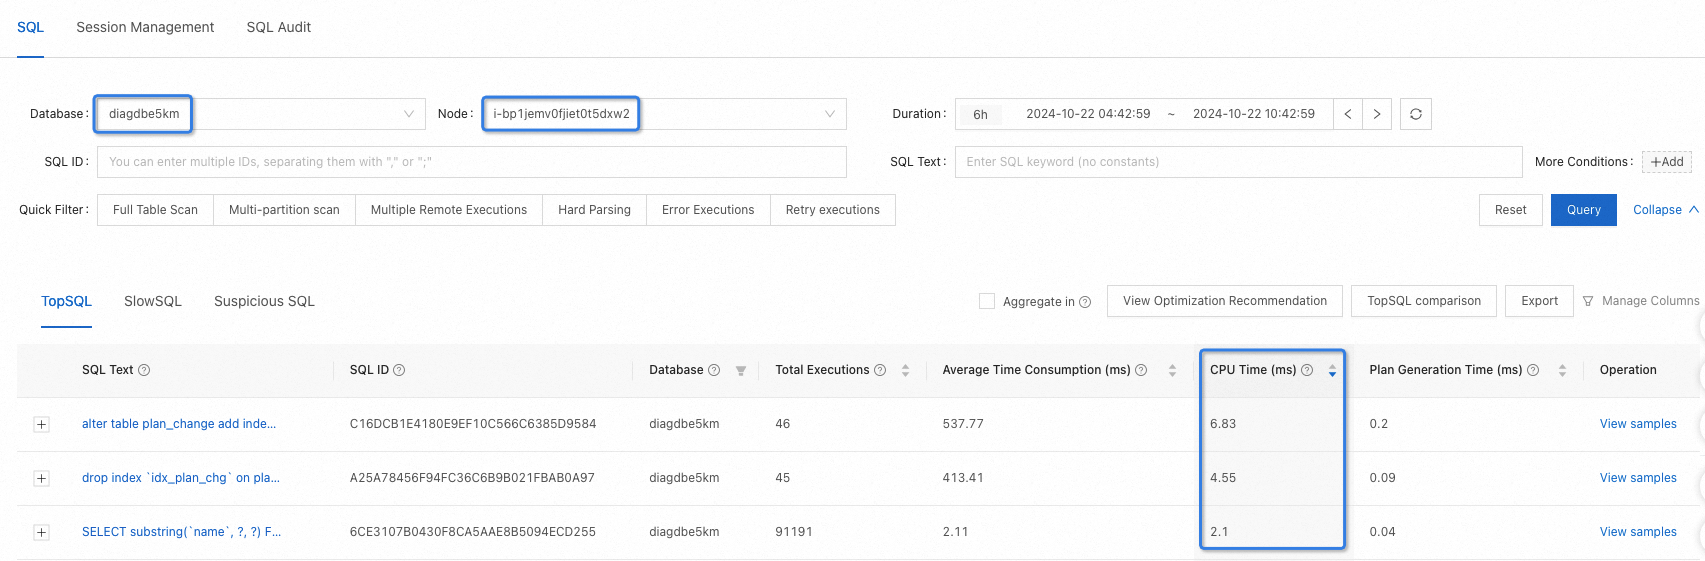
When the CPU utilization of a host is too high, you can filter the top SQL statements by database and node, and then sort these SQL statements by the CPU time in descending order to locate the SQL statements that need to be optimized the most.
SlowSQL
SlowSQL refers to SQL statements whose execution time exceeds 500 ms.
Filter SlowSQL by quick filters, such as Full Table Scan, Multi-partition scan, and Multiple Remote Executions.
Click View Samples in the Operation column to view the SQL statement.
In the Operation column of a specific SQL, click on
and select Set Throttling. You can check multiple SQLs to set throttling in batches.Check Aggregate in at the top right of the list to display SQLs according to Aggregation IN, but this will not affect the statistical data. You can select multiple SQLs (including those with Aggregation IN) to set throttling in batches.
To customize the slow SQL threshold, select ... > Modify Slow SQL Threshold at the top right of the list. In the pop-up window, adjust the slow SQL threshold and then click OK.
Suspicious SQL
Suspicious SQL refers to SQL statements that may cause performance issues and are filtered out based on rules and algorithms. The following table lists common diagnostic results and troubleshooting suggestions.
Diagnostic result | Troubleshooting suggestion |
Hint with no effect | It indicates an abnormal SQL statement that requires the database administrator (DBA) to determine whether to fix the execution plan by using an outline. |
Full table scan with poor performance | Analyze the execution plan and table structure to ensure that SQL has appropriate indexes available. |
Poor performance despite the use of indexes | Check whether the performance is acceptable in your business scenarios. If not, improve the business logic or optimize the indexes. |
Performance degradation | Check data distribution changes, request surges, and execution plan changes. |
Plan change accompanied by performance degradation | Check with the DBA. You can use an outline to fix the execution plan to verify whether the SQL statement is abnormal. |
Execution spikes | Check the business volume. A spike in the number of executions of an SQL statement may cause the overall performance to decrease. |
Overhigh CPU load | Check your business scenarios, data distribution changes, request increases, and execution plan changes. |
Suspected lock conflict | SQL is being retried, which may be caused by a lock conflict. Please investigate the business logic to determine if a lock conflict scenario exists. |
Too many partitions are accessed by the DML statement | Rewrite the SQL statement so that it supports partition pruning. |
Suspected buffer table | Check whether the related table is being frequently updated. |
There may be large and small account numbers | Check whether there is a data skew issue. |
Execution plan instability | Check whether there are issues with plan regression. |
Plan generation time is too long | Check whether there are issues such as low plan hit rate. |
The Suspicious SQL tab displays SQL Text, SQL ID, Database, Diagnostic Results, and so on.