With the one-click diagnostics feature, you can view the SQL performance monitoring data and diagnostic reports of the cluster within a specified time period.
View the performance monitoring data
Log on to the ApsaraDB for OceanBase console.
In the left-side navigation pane, choose Autonomy Service > Diagnostics Center.
In the Instance Details section, click the name of the target instance.
The system automatically redirects to the diagnostics center.
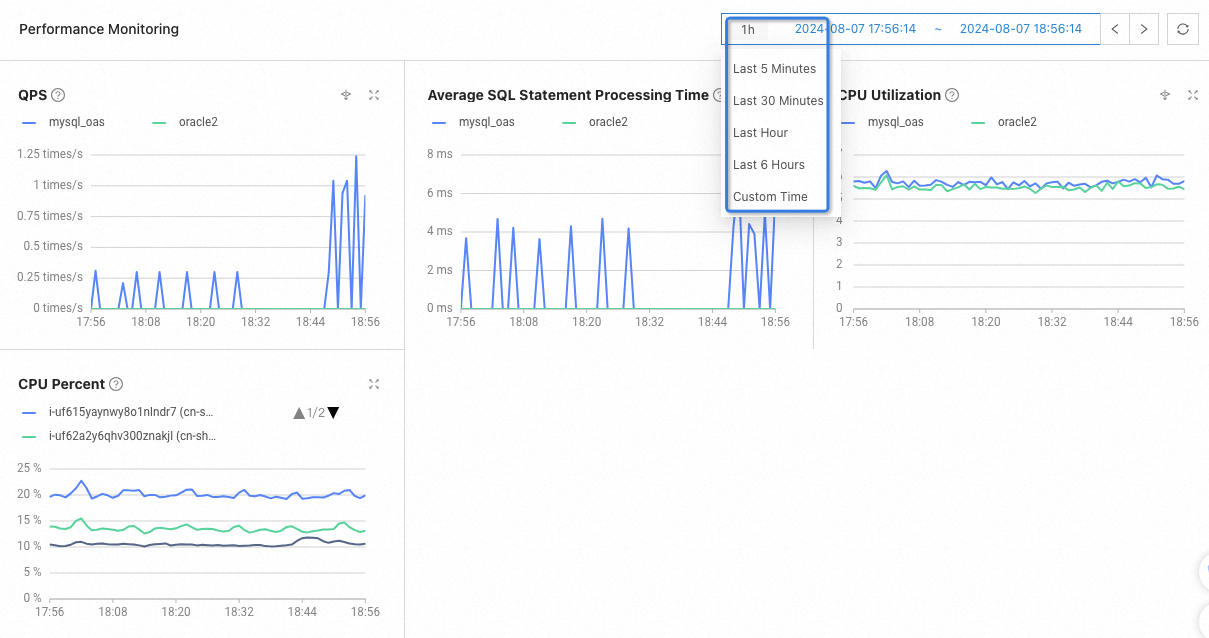
In the Performance Monitoring section, view the data of performance monitoring metrics, such as QPS, Average SQL Statement Processing Time, and CPU Utilization.
By default, the system displays the data within the last hour.
In the time selector in the top right corner of the page, you can also click 1h and choose Last 5 Minutes, Last 30 Minutes, Last Hour, Last 6 Hours or Custom Time from the drop-down list.
Hover the cursor over the question mark icon
 to view the description of a performance monitoring metric.
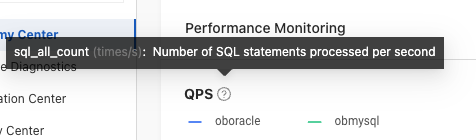
Click the icon
 next to the tenant name to view the performance monitoring data of the tenant. For example, the following figure shows the QPS of the forMySQLTenant tenant.
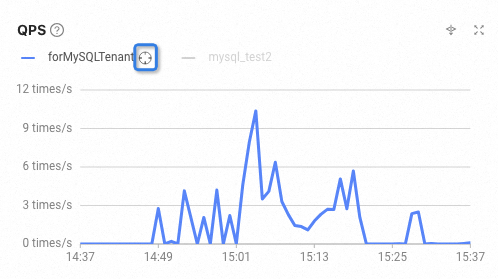
Click the icon
 to view the breakdown of a performance monitoring metric.
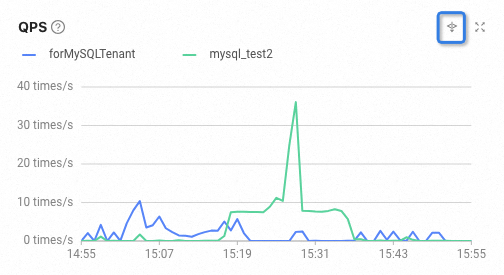
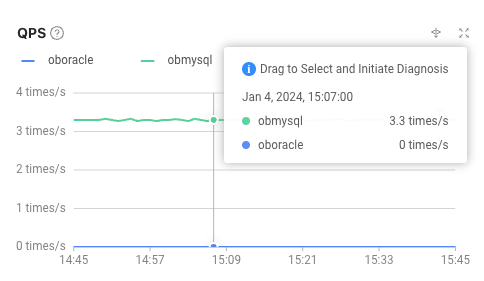
Place the cursor at a certain time point to view the data at that time point.
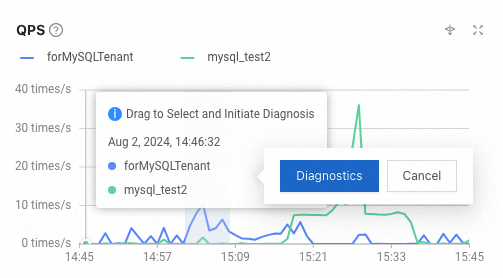
Press and hold the left mouse button to drag, select a time period, and click Diagnostics in the pop-up window to diagnose the monitoring metric within the time period.
View the diagnostic results in the Diagnostics Report section below.
View the diagnostics report
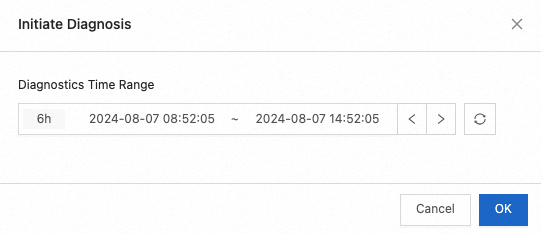
By default, the diagnostics report displays the diagnostic results within the last hour, including Abnormal Event, SQL Diagnostics, Session Diagnostics, Optimization Center, Capacity Center, and Security Center. You can also click the Initiate Diagnosis button on the right side of Diagnosis Report, customize the time period in the Initiate Diagnosis pop-up dialog box, and click OK.
The following is an introduction to the contents of each module in the diagnostics report.
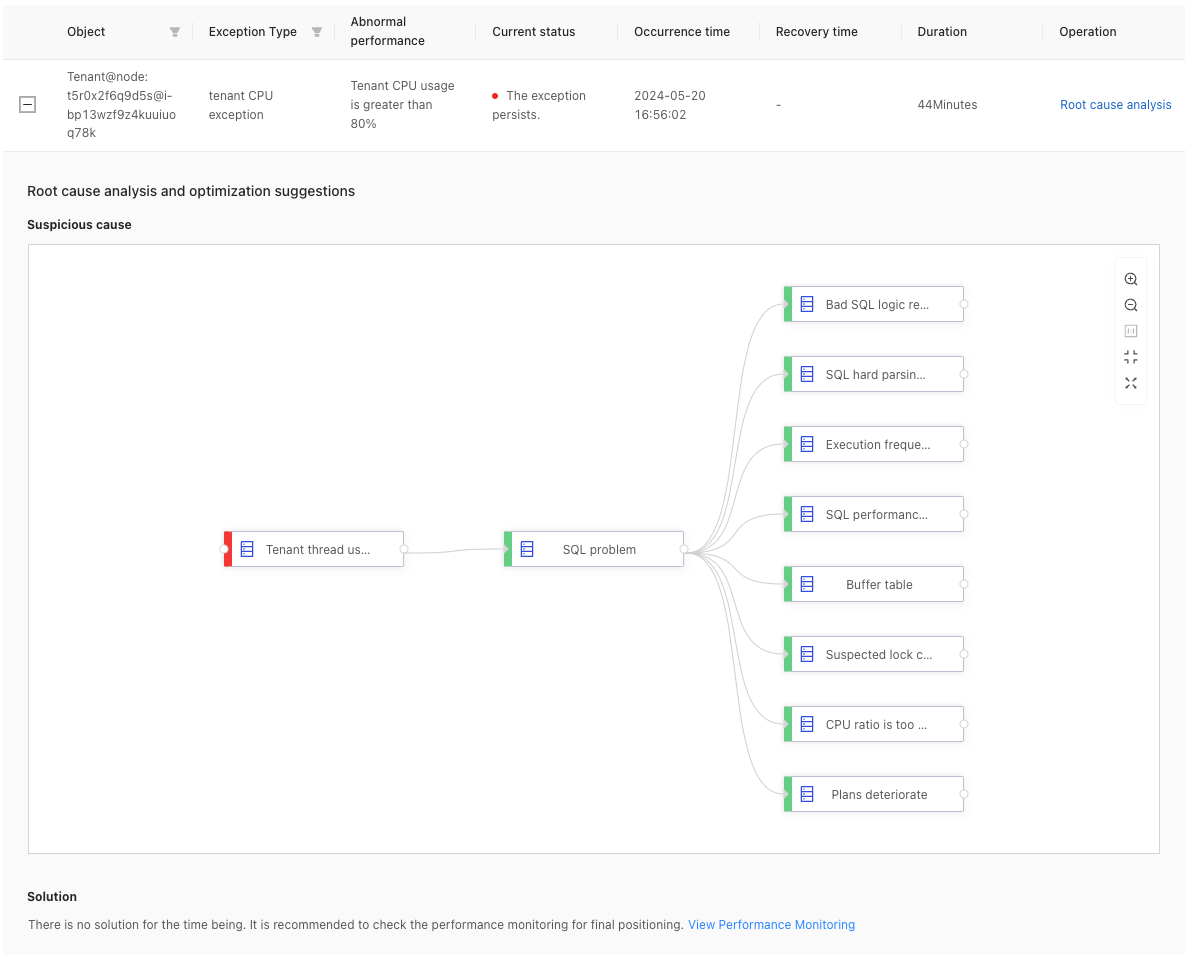
Abnormal Event: Displays abnormal events that occurred within a specified time period.
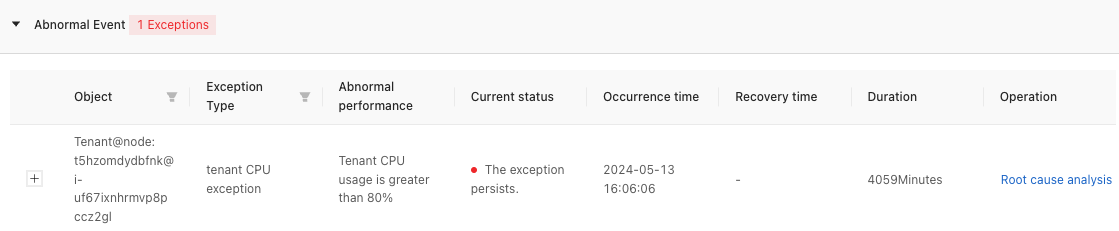
You can view the Object, Exception Type, Abnormal Performance, Current Status, Occurrence Time, Recovery Time, Duration, and Operation of an abnormal event.
Click the Root Cause Analysis in the Operation column of a single abnormal event to view the root cause analysis and optimization suggestions for the abnormal event.
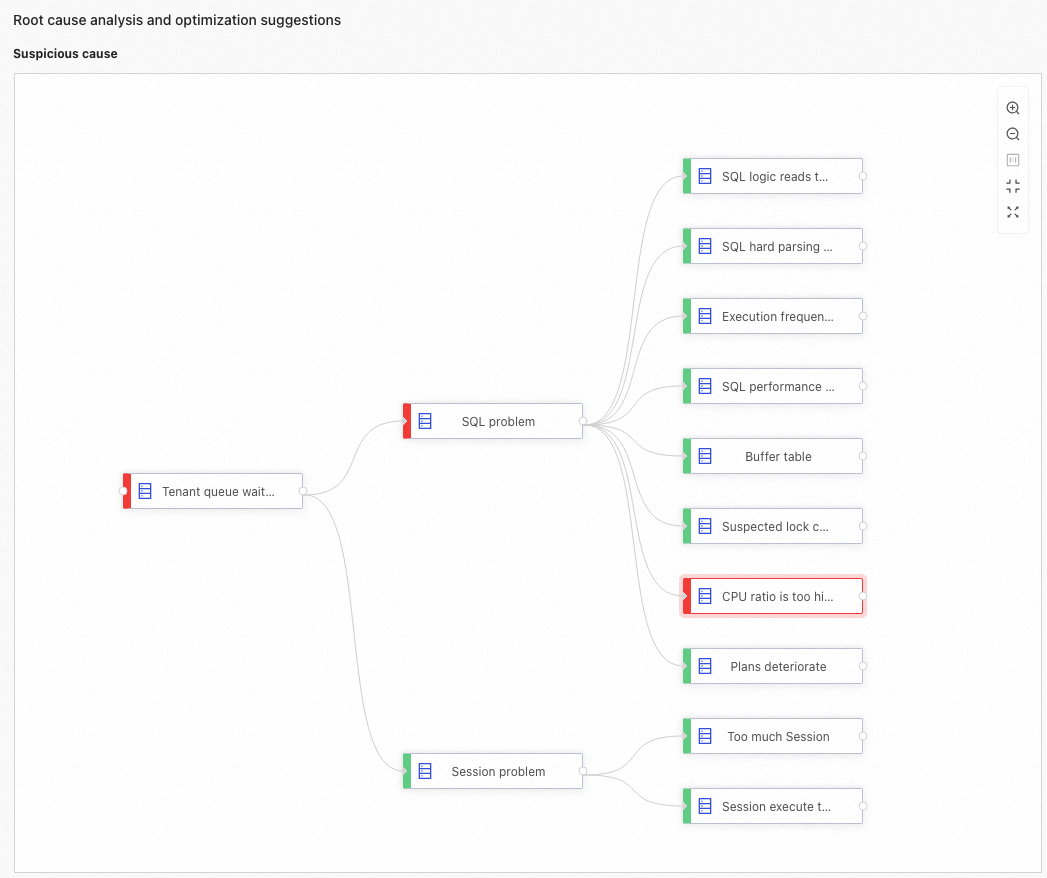
If the cause of the abnormal event is in the analysis graph, the system will highlight the cause in red and provide optimization suggestions.
NoteIn the analysis graph, each node represents an analysis rule. When performing root cause analysis, the system traverses the graph to find the root cause node. The root cause node is highlighted in red, while the green node indicates that the rule does not hit the root cause.
The following is an example:
Upon detecting Tenant Queue Waiting Becomes Longer within the specified time period, the system provides a prompt that the CPU usage is too high. In the Suspicious Cause section, you can click the red highlighted box to view the corresponding root cause analysis.
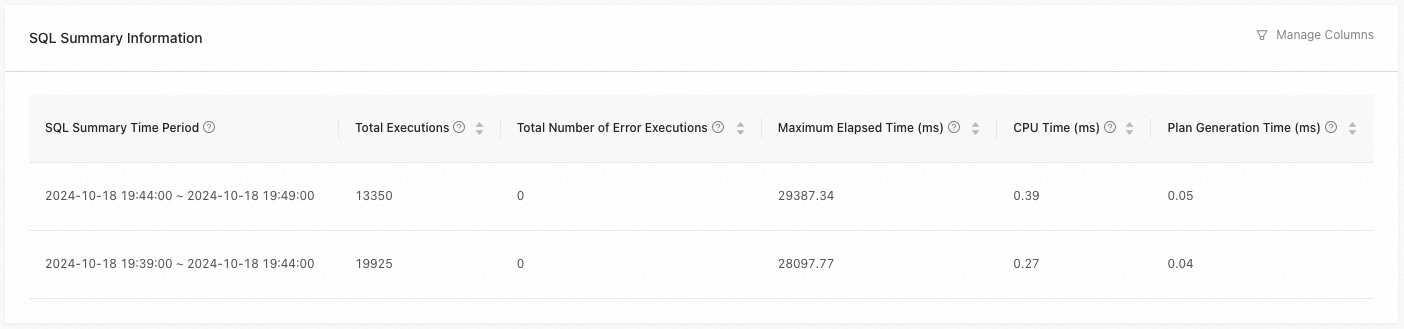
In the SQL Summary Information section, the system displays SQL Summary Time Period, Total Executions, Total Number of Error Executions, Maximum Elapsed Time, CPU Time, and Plan Generation Time by default. You can view more information by clicking Manage Columns.
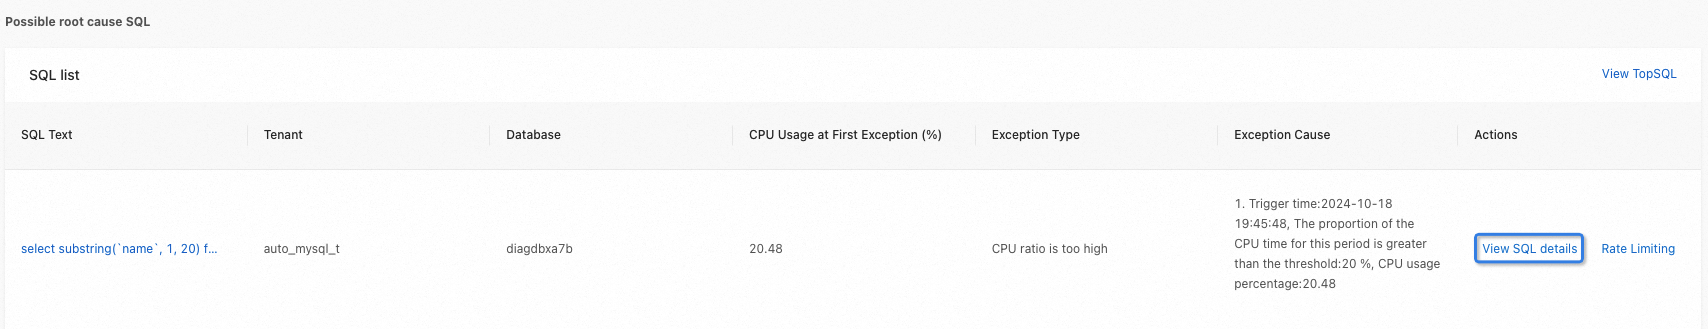
In the Possible Root Cause SQL section, you can view the SQL that may cause the problem and click View SQL Details in the Actions column.
If the cause of the abnormal event is not in the analysis graph, the system will provide optimization suggestions in the Solution section.
The following is an example:
Upon detecting Tenant CPU Exception, the system will still display the analysis graph and provide optimization suggestions in the Solution section.
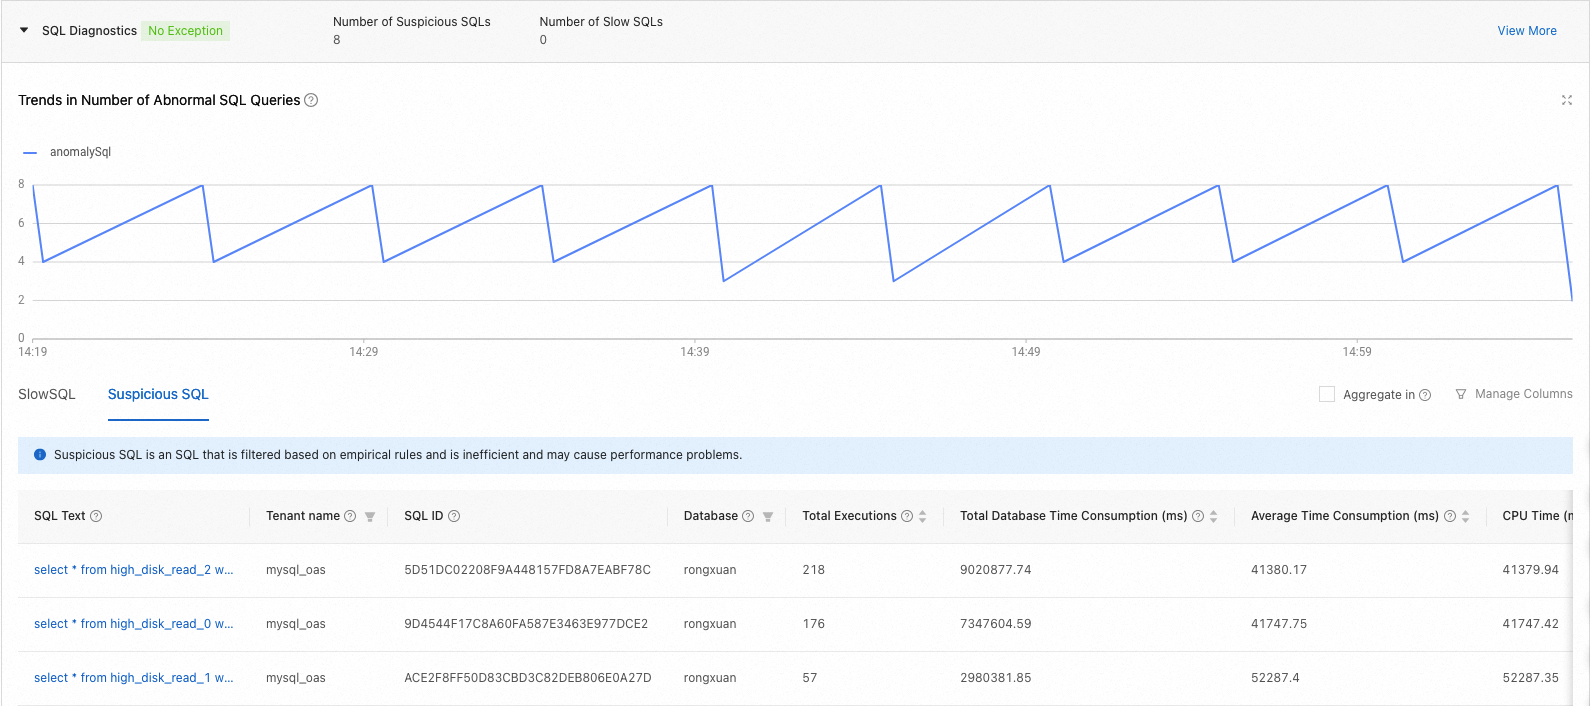
SQL Diagnostics: Displays the Number of Suspicious SQLs and Number of Slow SQLs generated during the specified time period.
Click View More to go to the SQL Insights page. For details, see SQL basic information.
In the Trends in Number of Abnormal SQL Queries chart, you can view the number of abnormal SQLs in the specified time period.
On the SlowSQL tab, you can view the details about Slow SQLs generated during the specified time period.
Click the SQL text to go to the SQL diagnostic details page. For details, see SQL details.
Click View Samples in the Operation column to directly view the SQL statement.
On the SuspiciousSQL tab, you can view the details about suspicious SQLs generated during the specified time period. Click the SQL text to go to the SQL diagnostic details page. For details, see SQL details.
Session Diagnostics: Displays the number of active sessions. Click View More to go to the Session Statistics page. For details, see Session diagnostics.
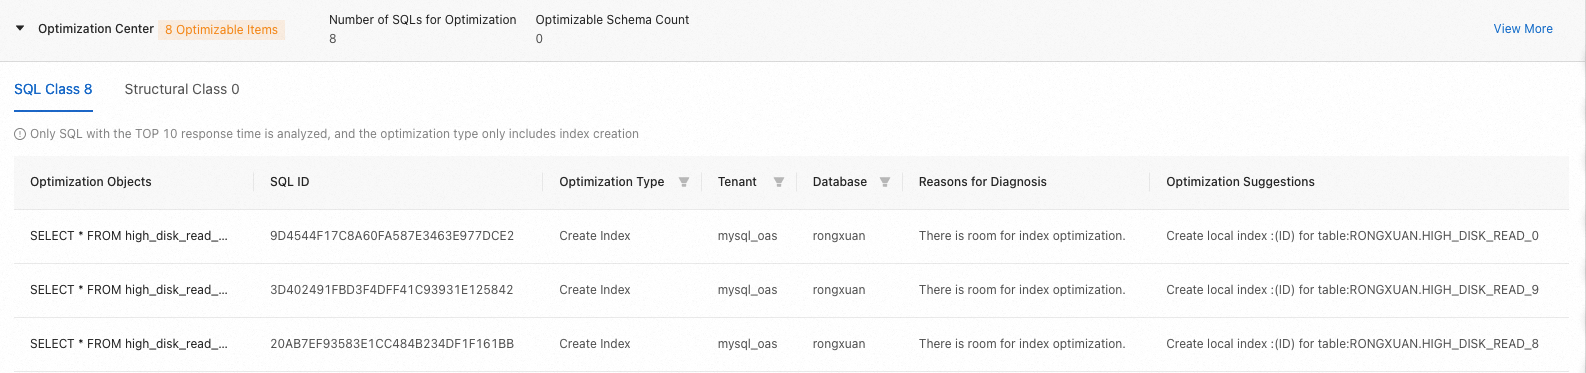
Optimization Center: Displays the diagnostic results of the SQL class and the structural class.
Click View More to go to the Optimization Center page. For details, see View optimization suggestions.
On the SQL Class and Structural Class tabs, you can view the optimization object details.
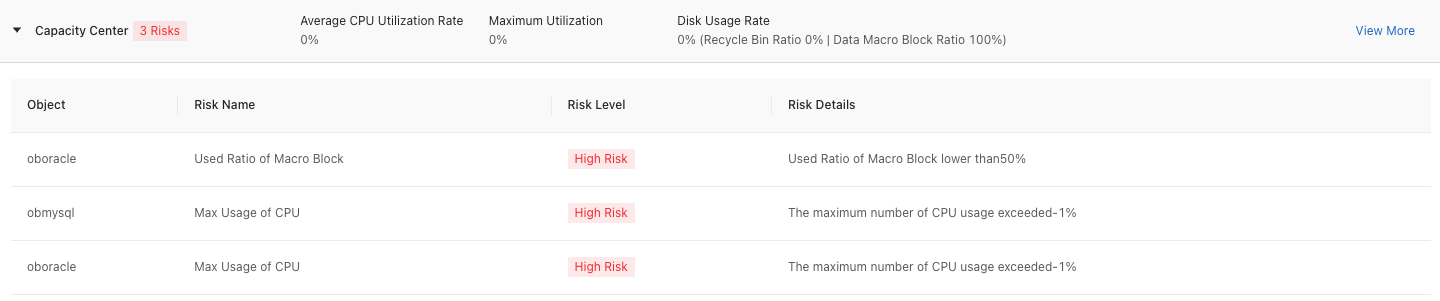
Capacity Center: Displays CPU and disk usage and risk reminders within a specified period. Click View More to go to the Capacity Center page. For details, see Capacity diagnostics.
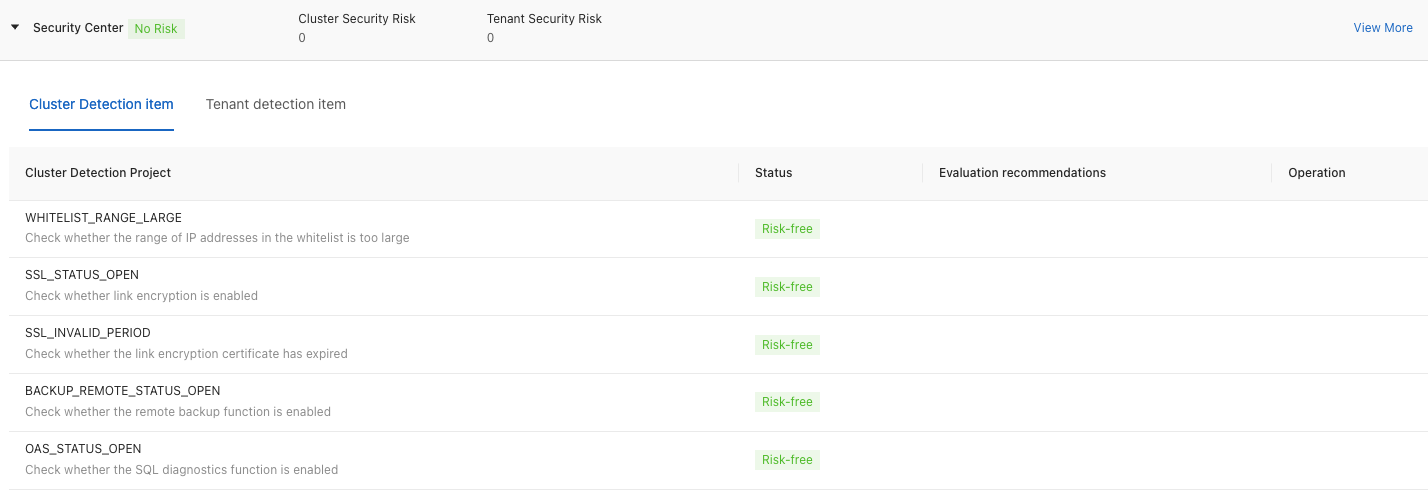
Security Center: Displays the security detection results of the cluster and tenant. Click View More to go to the Security Assessment page. For details, see Security assessment.