This topic describes how to view session diagnostics information, including session statistics, session status, etc.
View session statistics overview
Log in to the ApsaraDB for OceanBase console.
In the left-side navigation pane, choose Autonomy Service > Diagnostics Center.
In the Instance Details section, click the name of the target instance.
The system automatically redirects to the diagnostics center.
In the left-side navigation pane, click Session Diagnostics.
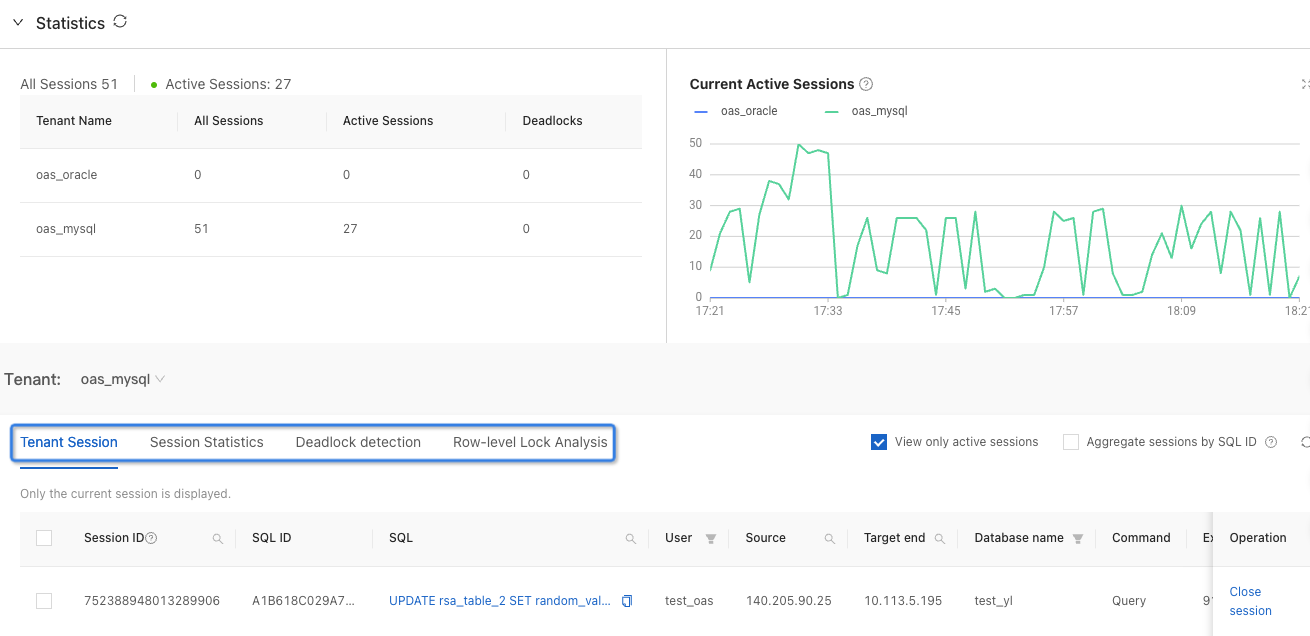
In the Statistics section, view the current session statistics and tenant session details, including active and idle sessions. You can select a tenant and view the corresponding details through the Tenant Session, Session Statistics, Deadlock Detection, and Row-level Lock Analysis tabs.

View tenant sessions
On the Tenant Session tab:
Proxy Session ID is the session ID recorded by the database proxy server.
Database Session ID is the session ID recorded by the OBServer and is used to identify a unique database connection on the OBServer.
The Tenant Session tab only displays the current session. One proxy session corresponds to multiple database sessions, but only one database session is displayed. If there is an active database session, this session is displayed. If there is no active database session, a random one is displayed.
Select View Only Active Sessions to search for active sessions. You can select multiple active sessions to set throttling in batches.
NoteIf the Database Name that corresponds to the selected session contains No_database (meaning a database name was not specified during the connection), throttling cannot be set in batches.
Select Aggregate Sessions by SQL ID to aggregate sessions with the same SQL ID.
NoteAggregating by SQL ID can help you analyze the traffic and consumption comparison of different SQL IDs, confirming the consumers of system resources.
The prerequisite for selecting Aggregate Sessions by SQL ID is that View Only Active Sessions is already selected.
Select Show Sessions by Aggregation in SQL to show sessions according to the Aggregation IN SQL, but this will not affect the statistical data. You can select multiple active sessions to set throttling in batches.
NoteAggregation IN SQL refers to ignoring the number of constant parameters in the IN clause of SQL statements and treating each IN clause as having only one constant parameter. Following this rule, SQL statements are parameterized, and the SQL ID is calculated; SQLs with the same SQL ID are considered to be of the same category and are aggregated.
The prerequisite for selecting Show Sessions by Aggregation in SQL is that Aggregate Sessions by SQL ID is already selected.
If the Database Name that corresponds to the selected session contains No_database (meaning a database name was not specified during the connection), throttling cannot be set in batches.
Filter sessions by User and Database Name.
Search for sessions by Proxy Session ID, Database Session ID, SQL ID, SQL, Source, Target End, and Database Node.
Sort sessions by Execution Time (s) and CPU Time (s).
Click an SQL statement go to the SQL Execution Details page.
For SQL statements that meet one of the following conditions, the SQL Execution Details page will display the operator execution plan and operator execution details, as shown in the figure below.
SQL that uses the MONITOR Hint
SQL that uses hints related to parallel execution
Slow SQL (execution time exceeds 5 seconds)
 Note
NoteThe OBServer must be V4.0 or later.
For operators that execute quickly, statistics may not be displayed.
For information about the MONITOR Hint, see MONITOR Hint. For information about hints related to parallel execution, see Hints related to parallel execution.
For other SQL statements, the SQL Execution Details page only displays the operator execution plan.
Close the target sessions.
To close a single session: Click Close Session in the Operation column of the target session.
To close multiple sessions: Select the check boxes before the target sessions, and then click Close Sessions in Batches below.
To close all sessions:
Select the check box to the left of Proxy Session ID, and then click Close Sessions in Batches below.
Select any session, click Select All below, and then click Close Sessions in Batches.
NoteAfter closing the session, you can check the task status in Optimization Management > Optimization Records.
Set throttling.
Set throttling for a single session:
Click Set Throttling in the Operation column of the target session.
In the pop-up dialog box, enter the maximum concurrency and click OK.
In the pop-up dialog box, click OK.
Set throttling in batches:
Select the check boxes in front of the target sessions, and click Batch Set Throttling below.
In the pop-up dialog box, enter the maximum concurrency and click OK.
In the pop-up dialog box, click OK.
NoteAfter setting throttling, you can check the task status in Optimization Management > Optimization Records.
If the Database Name that corresponds to the selected session contains No_database (meaning a database name was not specified during the connection), throttling cannot be set in batches.
View session statistics details
On the Session Statistics tab:
View or export the number of active sessions and the total number of sessions of the current cluster by user, access source, or database.

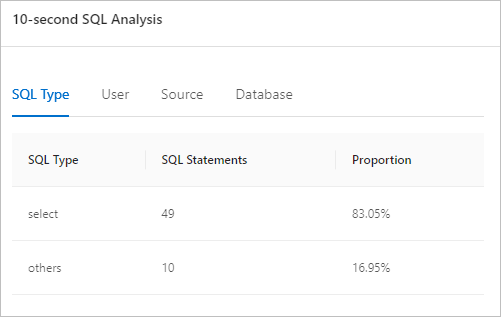
Click 10-second SQL Analysis in the upper-right corner to analyze the executions of SQL statements in the tenant within 10 seconds. You can view the analysis results by SQL Type, User, Source, and Database.

View deadlock detection
On the Deadlock Detection tab:
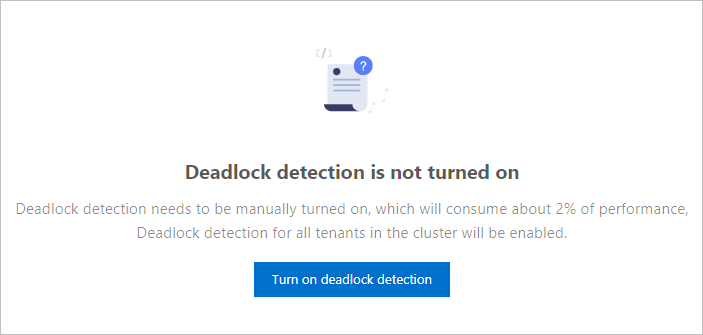
If you use deadlock detection for the first time, click Turn on Deadlock Detection. After deadlock detection is enabled, ApsaraDB for OceanBase detects and handles deadlock events in real time, which consumes about 2% of the system resources. Choose whether to enable deadlock detection based on your cluster conditions.
NoteDeadlock detection is only supported by ApsaraDB for OceanBase V4.x.

After deadlock detection is enabled, the system will detect whether there are deadlocks in the tenants of the cluster and provide detection results in the Deadlock Details section. The results will be retained for 7 days.

Click Turn off Deadlock Detection in the upper-right corner to disable deadlock detection or click the refresh icon to refresh deadlock detection details.
View row-level lock analysis
On the Row-level Lock Analysis tab:
View the row information and the number of sessions involved in the lock.
Select the target tenant to view its row lock information.
To release a session that holds a lock, you can close the session. Before closing the session, make sure that the session and the business SQL statements running on it can be terminated safely.
NoteRow lock analysis is a real-time query feature that only displays row locks and related session information with the lock waiting time exceeding 20 ms at the time of query. This feature is only supported by ApsaraDB for OceanBase Database V4.2.0 and later.
Row lock information may experience delays. If the session ID of the lock holder is not displayed, it indicates that the transaction might have already been completed.
