If you want to identify the cause of an error by reproducing the environment when it occurred, you need the full picture: every page load, API call, JavaScript (JS) error, and user operation that led to it. Session tracing in Application Real-Time Monitoring Service (ARMS) Browser Monitoring uses distributed tracing to reconstruct that complete behavior trail. It correlates all events within a session into a single timeline by username or user ID, so you can pinpoint root causes instead of guessing.
Use cases
| Problem | How session tracing helps |
|---|---|
| A user reports an error but cannot describe steps to reproduce it | View the full sequence of page loads, clicks, and API calls that led to the error |
| API failures occur intermittently | Search sessions and inspect the request timeline to identify the context around each failure |
| Pages load slowly for specific users | Identify slow loads in the session path and correlate them with the device, browser, or network conditions recorded in the session |
| JS errors spike for a subset of users | Search sessions by username or user ID to see the exact error context and preceding actions |
Prerequisites
Before you begin, make sure that you have:
An ARMS Browser Monitoring application configured and receiving data
(Optional) A username set in your SDK configuration, if you want to search sessions by username. For details, see SDK reference
Search and filter sessions
Log on to the ARMS console.
In the left-side navigation pane, choose Browser Monitoring > Browser Monitoring. Click the name of your application.
In the left-side navigation pane, choose Application > Session Traces.
(Optional) Enter a Username or User ID, then click Search.
To narrow results, click Expand and add filters:
| Filter | Description | Example |
|---|---|---|
| Session ID | Unique identifier for the session | Use when you already have a session ID from an alert or log |
| Visitor IP | IP address of the user | 203.0.113.42 |
| Page Url | URL of the page visited during the session | /checkout/payment |
| Browser | Browser type | Chrome, Firefox, Safari |
| Browser Version | Specific version of the browser | 120.0.6099 |
| Connection Type | Network connection type | WiFi, 4G |
| Geography | Geographic location of the user | Filter by region to isolate location-specific issues |
View session details
In the Session List section, click a session ID in the Session ID column to open the Session Tracking Details page. This page has two sections: Summary and Session Path.
Summary
The Summary section displays session-level metrics at a glance:
| Field | Description |
|---|---|
| Username | Login name of the user |
| User ID | Unique user identifier |
| Session ID | Unique session identifier |
| PVs | Total page views in this session |
| JS errors | Total JS errors recorded |
| API calls | Total API calls made |
| API failures | Total API calls that returned errors |
| Slow loads | Number of slow loads in this session |
| Device | Device used by the user |
| Region | Geographic region of the user |
| Browser | Browser of the user |
| IP address | IP address of the user |
| Network system | Network system of the user |
Session path
The Session Path section displays the pages the user visited in chronological order. Use it to trace the exact sequence of actions that led to an error or performance issue.
Click the + icon to the left of a page to expand the user behavior traces for that page. Each trace shows page loads, API calls, JS errors, and user operations in the order they occurred.
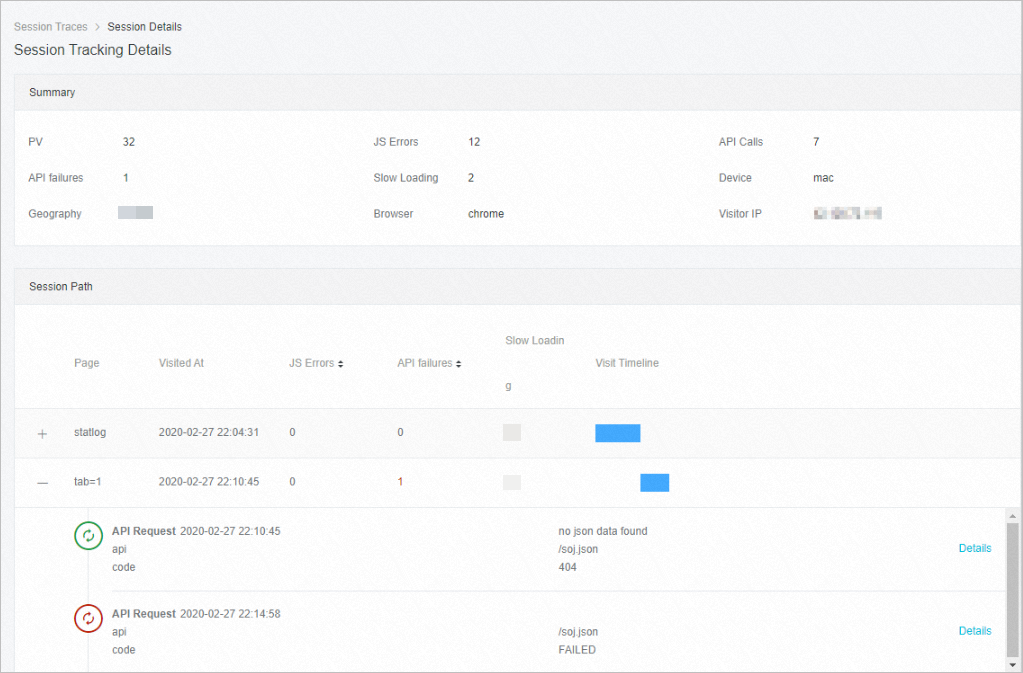
Click Details next to a specific event to view detailed information about an API call, slow load, or JS error.
Access session tracing from other pages
You can also reach session traces from other ARMS Browser Monitoring pages when investigating specific issues:
| Source page | How to access |
|---|---|
| Page Speed | Choose Application > Page Speed. In the Slow Page Session Trace (TOP20) section, click a session ID in the Session ID column. |
| JS Error Diagnosis | Choose Application > JS Error Diagnosis. On the Frequent Errors tab, click Diagnose in the Operation column. On the details page, click View Session in the User Behavior Trace section. |
| API Details | Choose Application > API Details. On the API Requests tab, click the error count in the Error Number column. On the details page, click View Session in the Network Request Information section. |
| View Details | Choose Application > View Details. In the Log List section, click View Session in the Operation column. |