Slow page loads drive users away and hurt search rankings, but pinpointing the bottleneck -- DNS, server response, resource loading, or client-side rendering -- requires granular timing data from real users. The Page Speed page in ARMS browser monitoring collects Navigation Timing API metrics from actual browser sessions and breaks them down by loading phase, geography, device, network, and browser version so you can identify exactly where time is lost.
After you connect your application to ARMS browser monitoring, the Page Speed page displays:
Page load time trends for key metrics (FPT, TTI, Load, and more)
A waterfall chart showing time spent in each loading phase
Load speed distribution across your user base
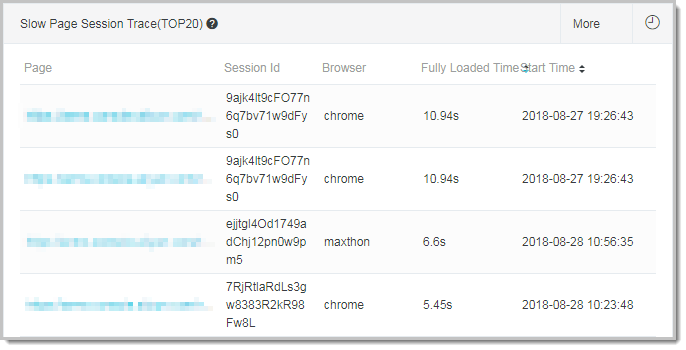
The 20 slowest page session traces with resource-level detail
Breakdowns by geography, device, network, and browser version
To report custom performance metrics such as first paint time or time to interact, see SDK methods.
Open the Page Speed page
Log on to the ARMS console.
In the left-side navigation pane, choose .
In the top navigation bar, select a region, then click the application name.
In the left-side navigation pane, choose .
In the Page Speed section, rank pages by FPT or page views (PVs). Click the upward or downward arrow to change the sort order.
Diagnose page load issues
Start with Page Load Time Details to spot anomalies, use the Page Load Waterfall Plot to isolate the slow phase, check the Performance Distribution to gauge user impact, then inspect individual sessions in Slow Page Session Trace(TOP20).
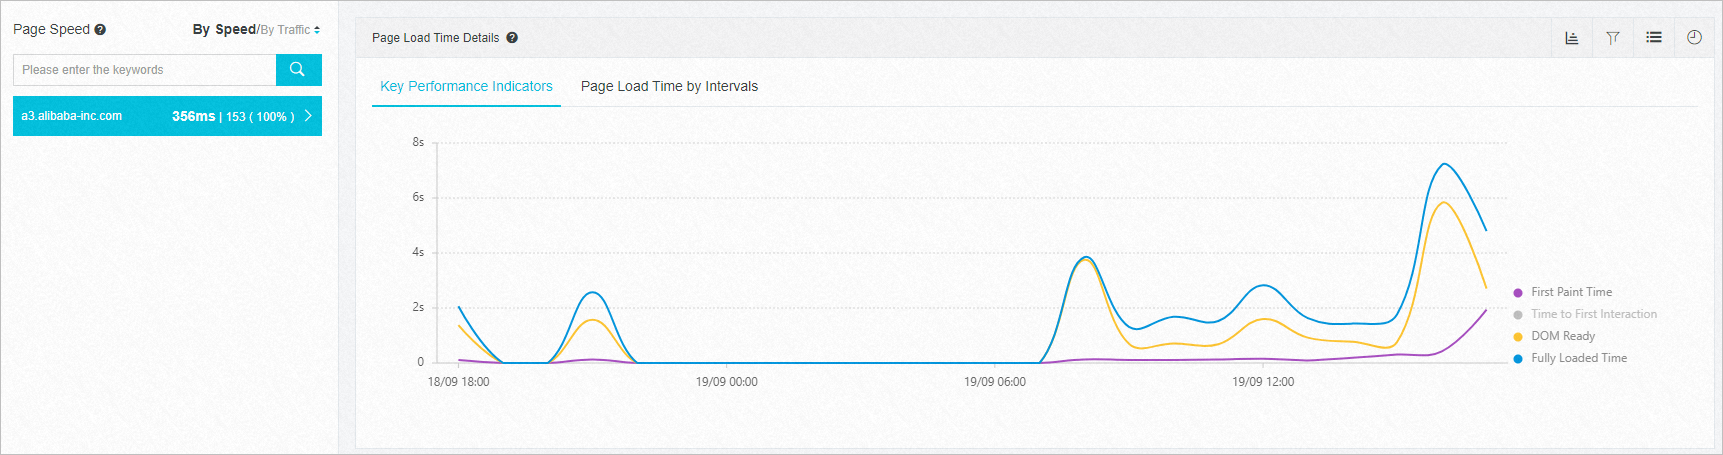
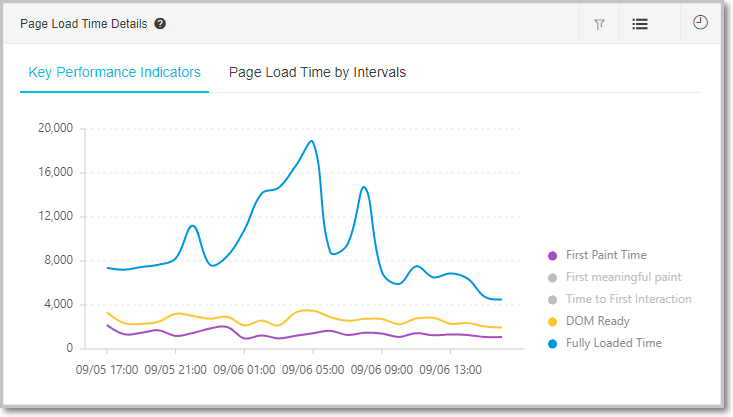
Page Load Time Details
This section plots metric trends over time. The curve chart displays average values for each metric within the selected time range.
Averages are sensitive to outliers. A single slow request on a weak network can skew the average. To filter out extreme values, click the
 icon in the upper-right corner.
Investigate spikes immediately. If a metric increases sharply, use the Performance Sample Distribution and Slow Page Session Trace(TOP20) sections to identify the cause.
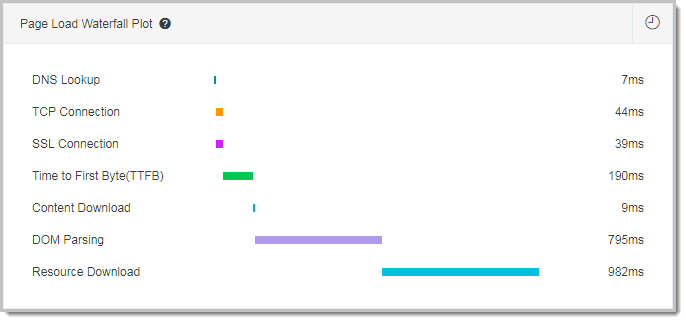
Page Load Waterfall Plot
The waterfall chart shows time spent in each loading phase -- DNS lookup, TCP connection, TTFB, data transfer, DOM parsing, and resource loading -- in sequence. Each bar represents the average duration for that phase. A disproportionately long bar points directly to the bottleneck.
| Long bar | Likely cause | Recommended action |
|---|---|---|
| DNS | Slow DNS resolution | Use DNS prefetching or switch to a faster DNS provider |
| TCP | Network latency or congestion | Check network path, consider a CDN closer to users |
| TTFB | Server-side latency | Optimize backend performance or CDN configuration |
| Trans | Large response payload | Enable compression, reduce payload size |
| DOM | Complex HTML or blocking scripts | Simplify DOM structure, defer non-critical scripts |
| Res | Heavy resource loading | Optimize asset sizes, set caching headers, load resources in parallel |
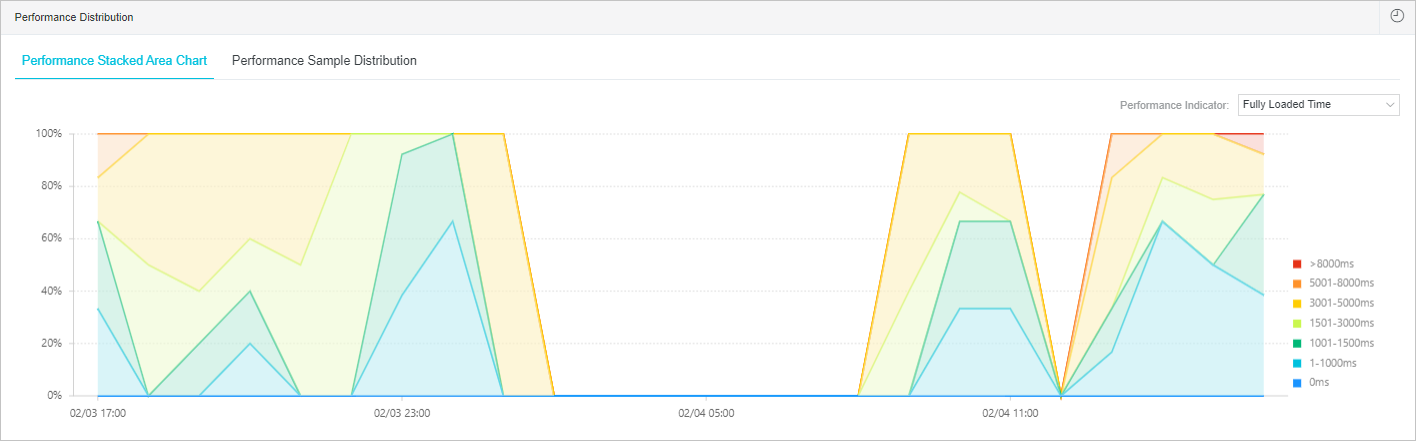
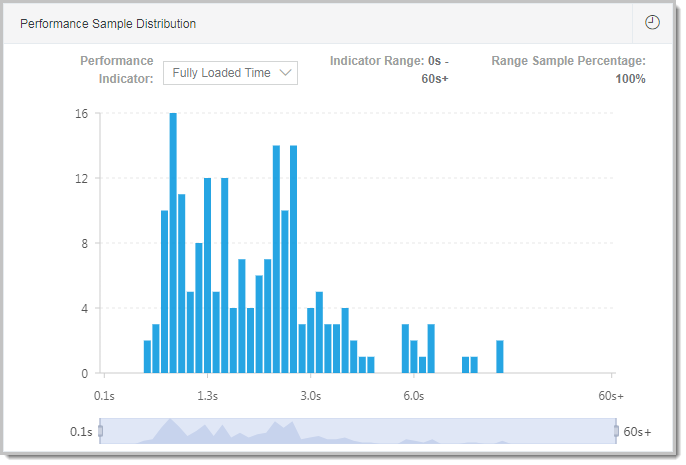
Performance distribution
The Performance Distribution section shows how load times are distributed across your user base.
Performance Stacked Area Chart tab
A stacked area chart with time on the horizontal axis, showing how the proportion of fast vs. slow page loads changes over time.
Performance Sample Distribution tab
Shows the proportion of pages at each load speed. Use this tab to answer questions such as: what percentage of pages load within 1 second? How large is the long tail of slow-loading pages?
Slow Page Session Trace(TOP20)
Lists the 20 slowest page sessions with a resource-level waterfall chart for each. Inspect the static resource loading sequence to pinpoint bottlenecks -- a large uncompressed image, a render-blocking script, or a slow third-party request.
For deeper analysis, see Session tracing.
Analyze performance by dimension
Page load speed depends on more than your code. The user's geographic location, network quality, device type, and browser version all play a role. The Page Speed page provides four breakdowns to isolate these factors:
| Breakdown | What it reveals |
|---|---|
| Geographic distribution | Regions with consistently slow load times -- potential CDN coverage gaps |
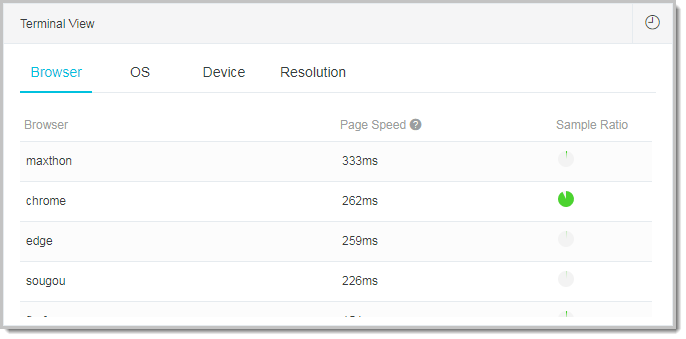
| Terminal distribution | Device types (desktop vs. mobile, OS, screen resolution) correlated with performance |
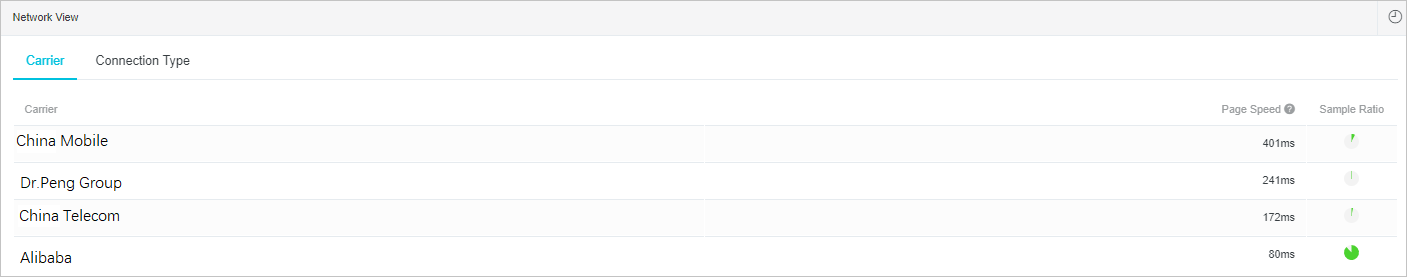
| Network distribution | Impact of carrier or connection type (4G, Wi-Fi, broadband) on load times |
| Version distribution | Performance differences across browser or app versions |
Performance metrics reference
ARMS browser monitoring collects metrics based on the Navigation Timing API. The metrics fall into two categories: key performance indicators that reflect the overall user experience, and phase timing fields that measure individual loading stages.
Key performance metrics
| Metric | Full name | Formula | What it measures |
|---|---|---|---|
| FMP | First Meaningful Paint | N/A | When the primary content becomes visible. A high FMP means users stare at a blank or incomplete page before seeing meaningful content. |
| FPT | First Paint Time | responseEnd - fetchStart | Time from request initiation to when the browser begins to parse the first batch of HTML documents. |
| TTI | Time to Interactive | domInteractive - fetchStart | When the browser finishes resolving all HTML documents and constructing the DOM, and starts loading resources. |
| Ready | HTML load complete | domContentLoadEventEnd - fetchStart | Time to fully construct the DOM. If synchronous JavaScript runs on the page, script execution time equals Ready minus TTI. |
| Load | Full page load | loadEventStart - fetchStart | Total time to load the page completely, including all resources. Calculated as: FPT + DOM + (Ready - TTI) + Res. |
| FirstByte | Time to first byte | responseStart - domainLookupStart | Time until the browser receives the first byte from the server. A high FirstByte value typically points to DNS, network, or server-side issues. |
Phase timing fields
| Field | Full name | Formula | What it measures |
|---|---|---|---|
| DNS | DNS query time | domainLookupEnd - domainLookupStart | Time spent resolving the domain name. |
| TCP | TCP connection time | connectEnd - connectStart | Time to establish the TCP connection. |
| TTFB | Time to first byte | responseStart - requestStart | Server response time from when the request is sent to when the first byte is received. For details on how ARMS calculates TTFB, see the Google developer reference. |
| Trans | Data transfer time | responseEnd - responseStart | Time to transfer the response body. |
| DOM | DOM parsing time | domInteractive - responseEnd | Time for the browser to parse HTML and construct the DOM tree. |
| Res | Resource loading time | loadEventStart - domContentLoadedEventEnd | Time to load synchronous resources (scripts, stylesheets, images) on the page. |
| SSL | SSL handshake time | connectEnd - secureConnectionStart | Time to complete the TLS/SSL handshake. Only populated for HTTPS connections. |