Application Real-Time Monitoring Service (ARMS) automatically detects outbound calls from your application to external services such as databases, message queues, and third-party APIs. Use the External Calls page to:
Identify slow calls and errors across all external dependencies.
Analyze response time, request count, and error count trends over time.
Trace problematic external calls back to the internal API operations that triggered them.
ARMS collects external call data from your instrumented application. You do not need to install agents on the external services themselves.
Prerequisites
Before you begin, make sure that you have:
An application connected to ARMS Application Monitoring (see Application Monitoring overview)
Access to the ARMS console
Open the External Calls page
Log on to the ARMS console.
In the left-side navigation pane, choose Application Monitoring > Applications.
On the Applications page, select a region in the top navigation bar, then click the name of the application that you want to manage.
Note If the
 icon appears in the Language column, the application is connected to Application Monitoring. If a hyphen (-) appears, the application is connected to Tracing Analysis.
In the left-side navigation pane, click External Calls.
The left-side pane lists all external calls made by the application. Sort calls by response time, request count, error count, or exception count to surface the most problematic dependencies first.
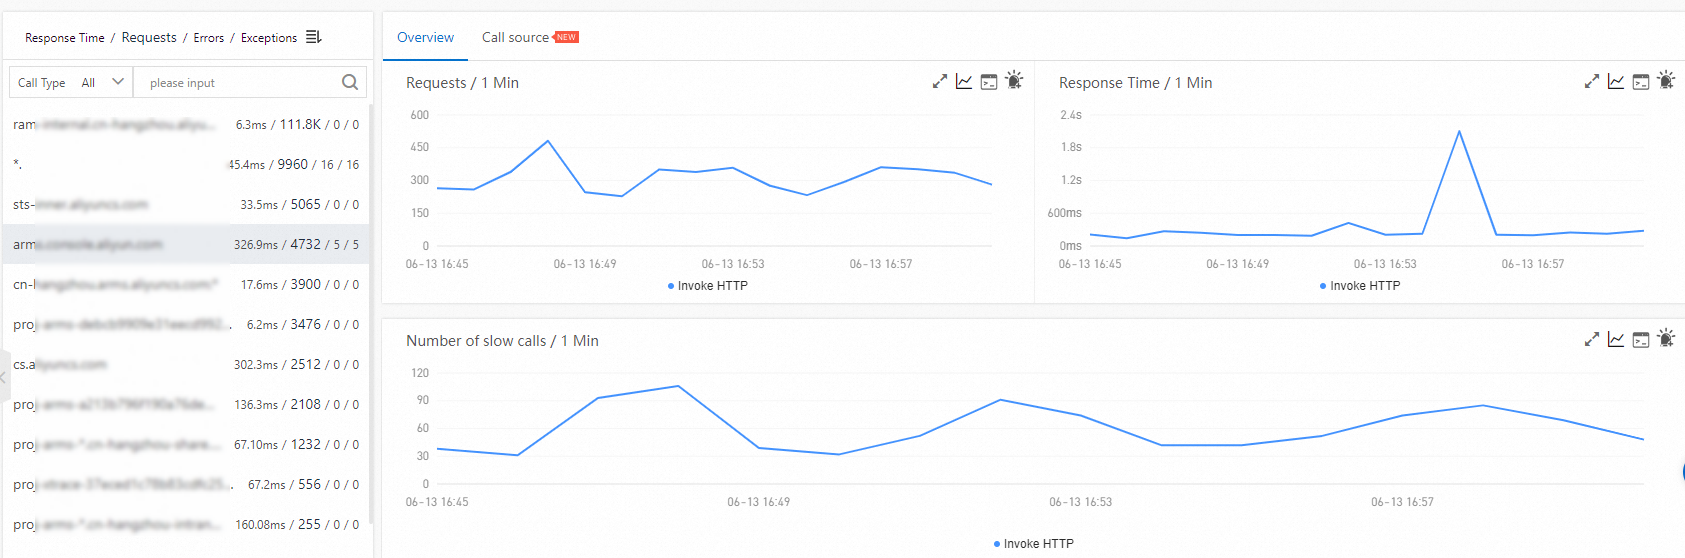
Analyze external call performance
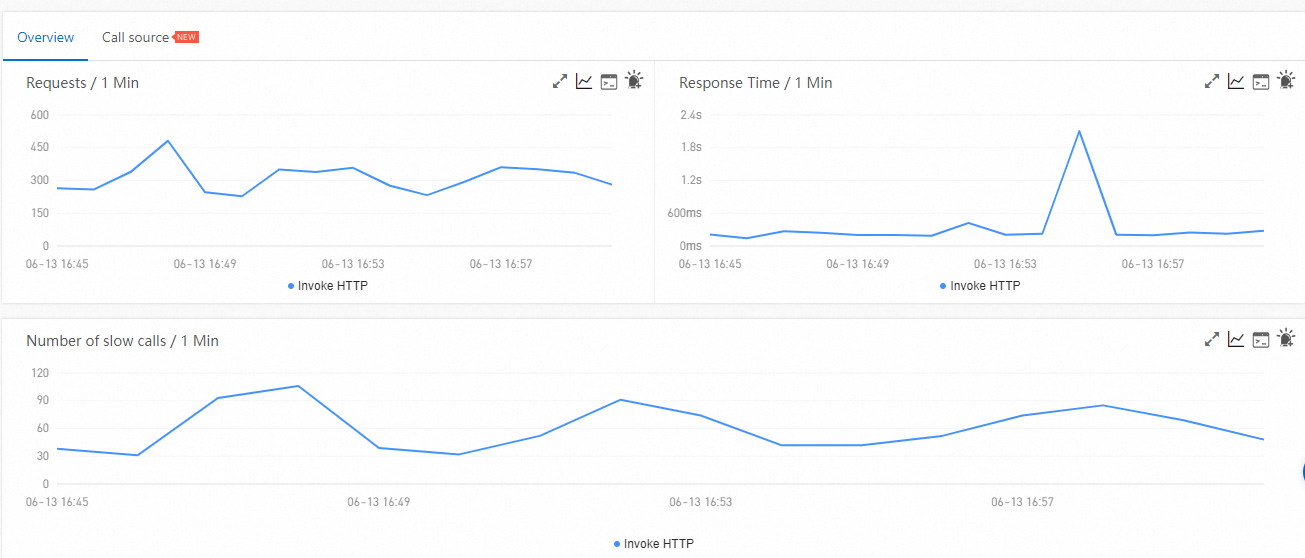
Select an external call from the left-side pane to view its performance metrics on the Overview tab. This tab displays time series charts for the following metrics:
| Metric | Description |
|---|---|
| Request count | Number of requests over time. |
| Response time | Average latency per time interval. |
| Error count | Number of failed requests over time. |
Identify call sources
The Call Source tab shows which internal API operations triggered the selected external call. For each call source, time series charts display response time, request count, and error count. Use this tab to pinpoint which part of your application is responsible for problematic external calls.
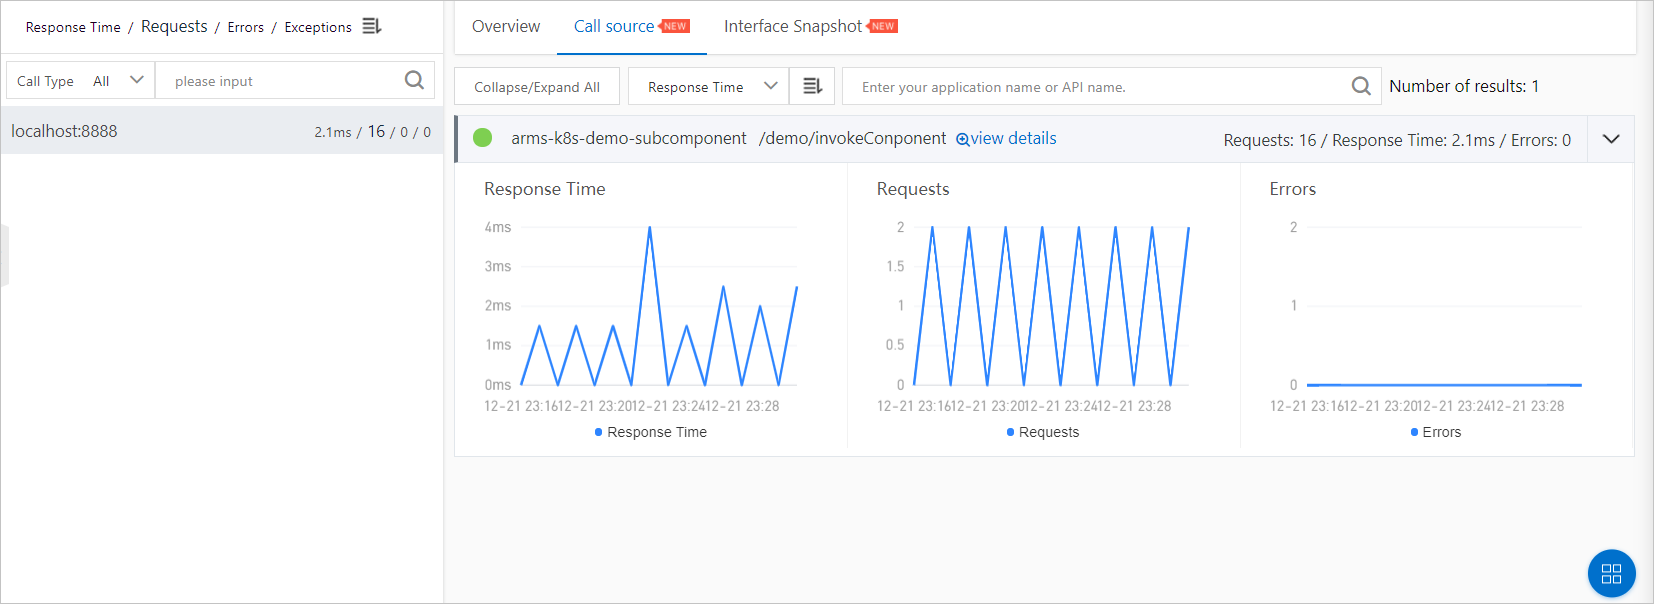
The following table describes the actions available on the Call Source tab:
| Action | Steps |
|---|---|
| Expand or collapse all API operations | Click Expand/Collapse All at the top of the tab. |
| Search for a specific API operation | Enter an application name or API name keyword in the search box, then click the Search icon. |
| Show or hide metrics for a single API operation | Click the collapse panel or the arrow icon at the end of the row. |
| View traces for a specific call source | Click view details next to the API operation. For more information, see View interface snapshots. |
Diagnose a latency issue
The following example walks through a typical troubleshooting workflow on the External Calls page:
Identify the slow external call. Sort by response time to find the slowest dependency. Select it to open the Overview tab.
Check the timeline. Review the response time chart. Determine when the latency started increasing and whether it correlates with a deployment or traffic change.
Find the call source. Switch to the Call Source tab. Identify which internal API operations are calling the slow dependency.
Inspect traces. Click view details next to the problematic API operation to view distributed traces. Examine individual traces to find the root cause, such as a slow query, a network timeout, or a retry loop.
Related topics
Trace query: Search for traces by duration, status, or tag to investigate individual requests.
API monitoring: Monitor the performance of your application's own API operations.