Application Real-Time Monitoring Service (ARMS) Alert Management is upgraded. Some features and relevant pages are removed, added, or modified. This topic describes the changes of Alert Management to help you better understand the differences between the old and new Alert Management sub-services and get started with the new Alert Management sub-service.
New features
Create and manage a notification policy
The notification policy feature is added to dispatch, handle, and send alert events that are generated. When alert rules are triggered, the system sends alert notifications to contacts by using the specified notification method. This way, the contacts can resolve alerts at the earliest opportunity.
Configure an escalation policy
You can escalate alert notifications for alerts that remain unresolved within a specified period of time. After you add an escalation policy, the system sends alert notifications to contacts by using the specified notification method. This way, the contacts can resolve alerts at the earliest opportunity.
Alert notifications in DingTalk groups
The new version of the alert management module allows you to send alert notifications to DingTalk groups in the form of alert cards. You can block or claim alerts in DingTalk groups.
The new version of the alert management module is integrated with ARMS by default. You can integrate alert notifications from other monitoring services with ARMS, such as open source Prometheus, Log Service, and CloudMonitor.
Modifications
- Alert Policies page
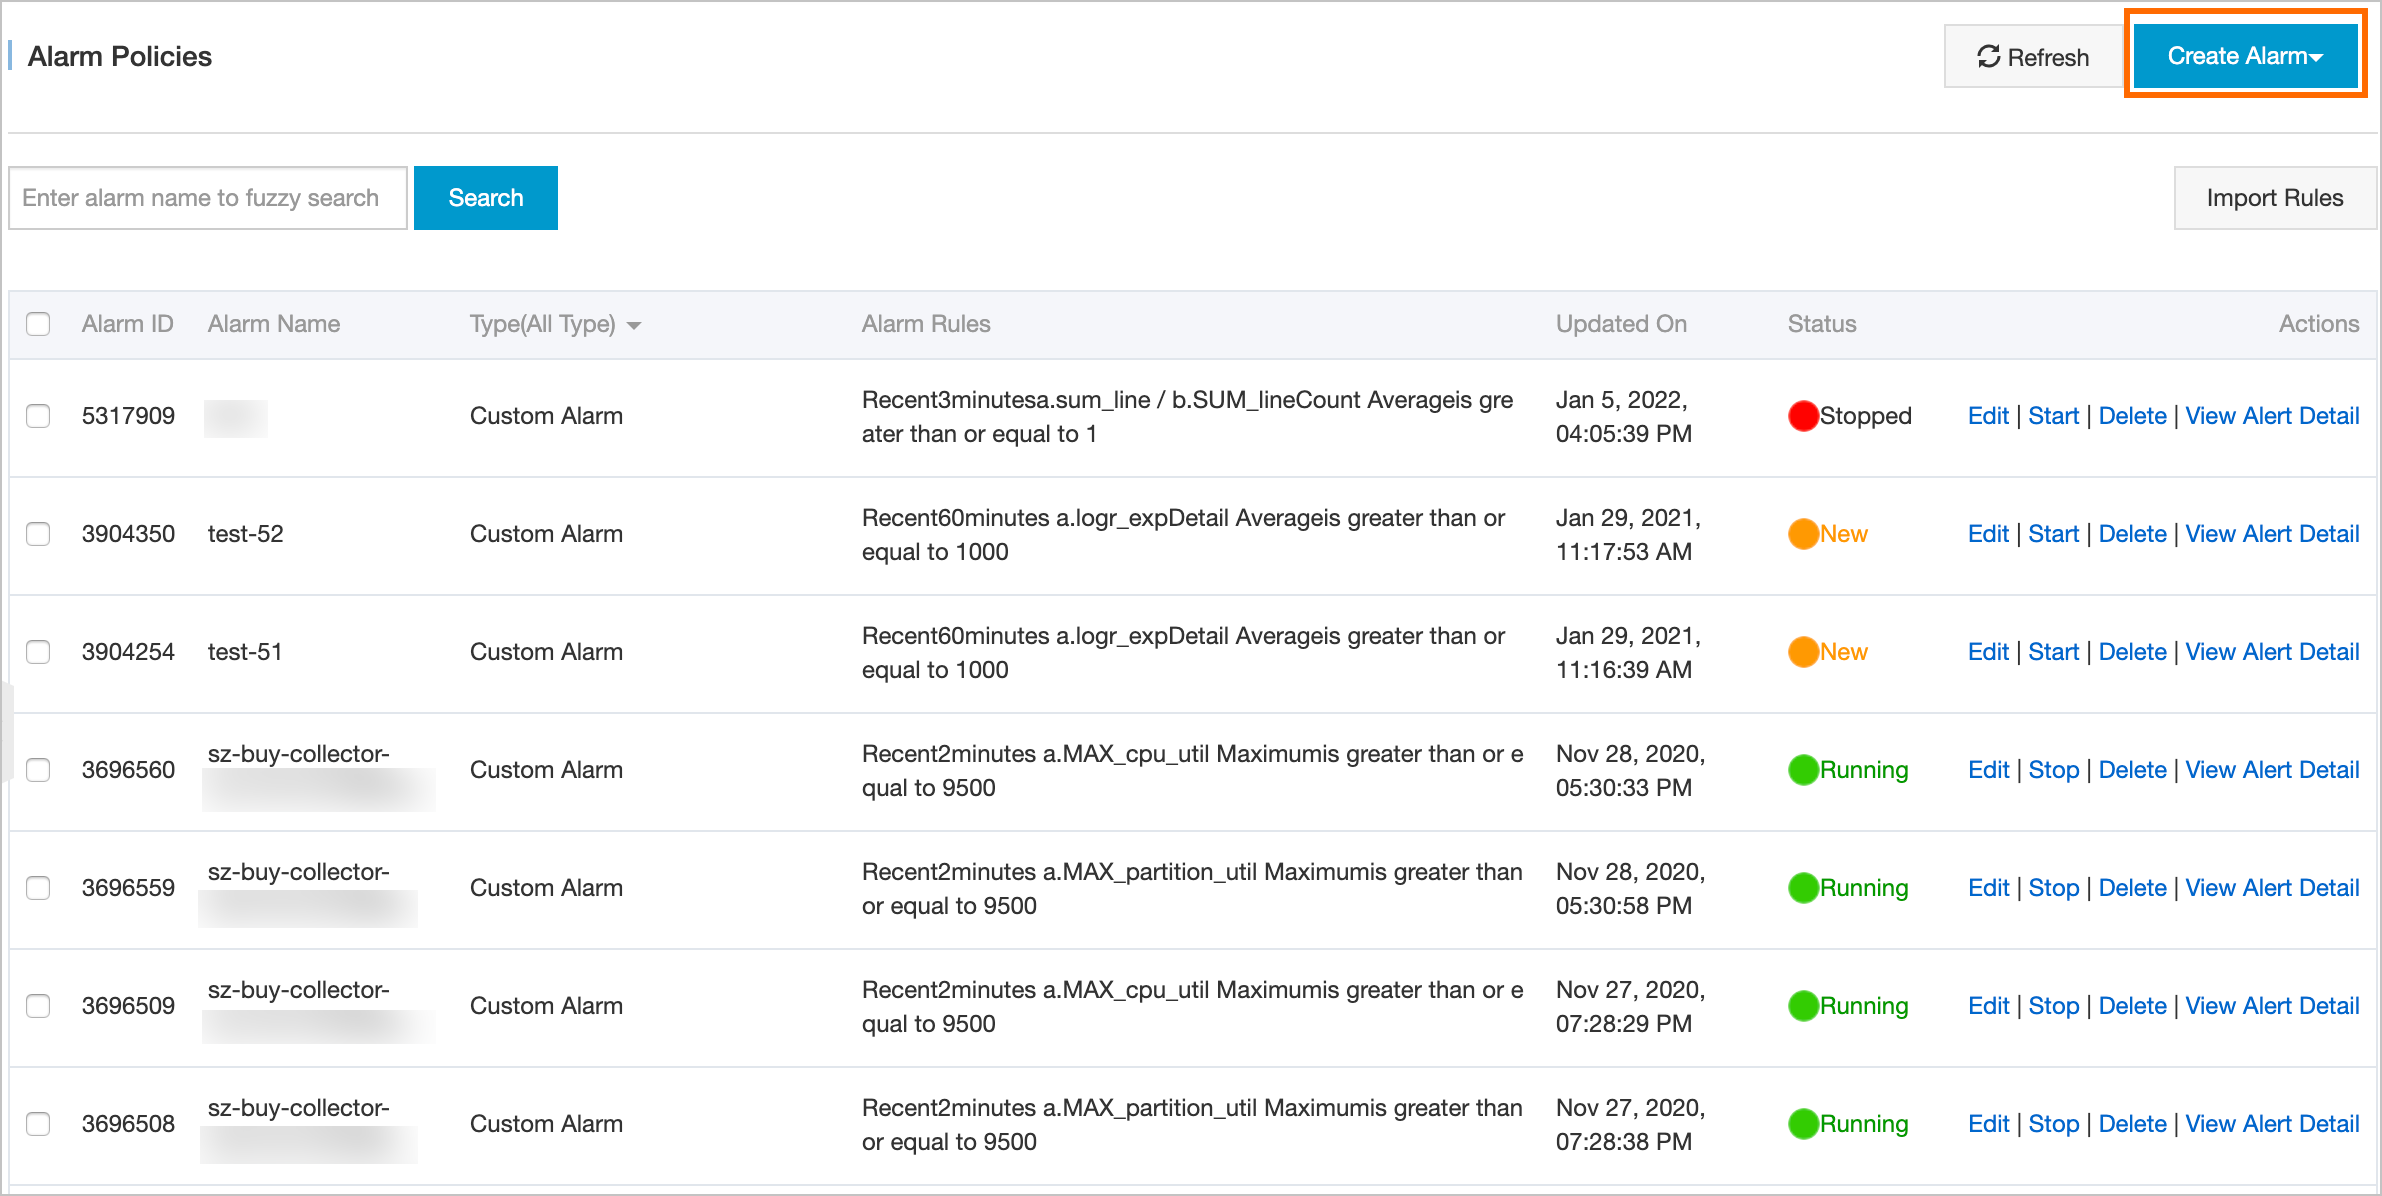
The Alert Policies page and the Create Alert tab are removed. You can view, modify, or manage existing alert rules for each sub-service.
- Alert Rules page
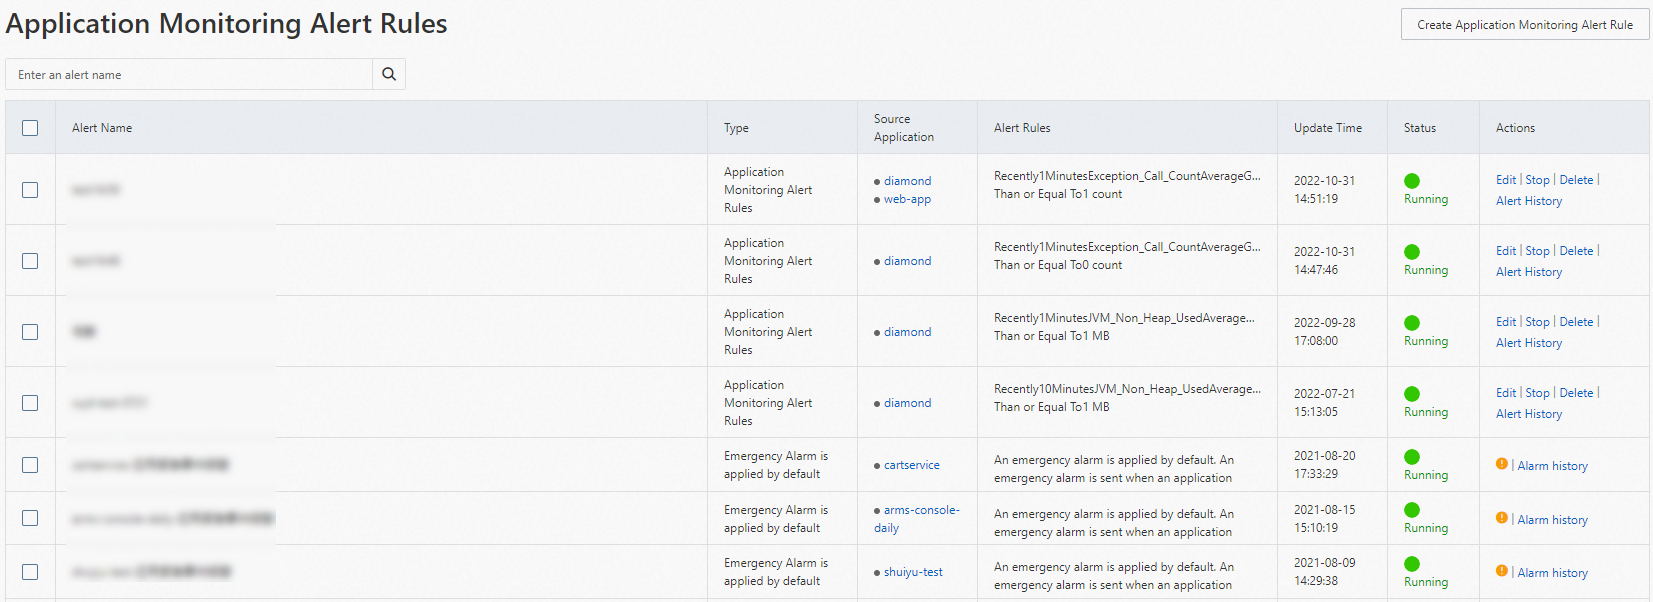
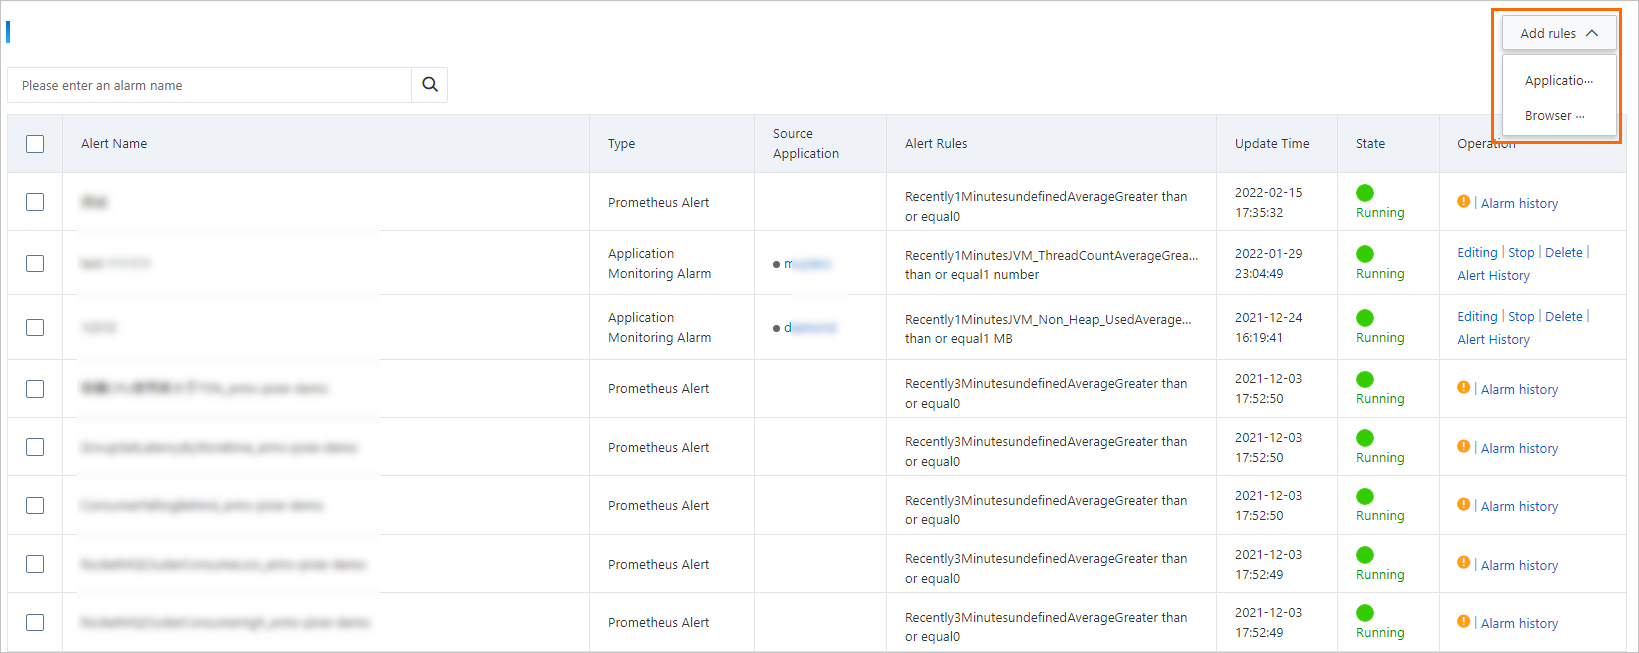
The Alert Rules page is removed. The Browser Monitoring Alert Rules page is added to Browser Monitoring and the Application Monitoring Alert Rules page is added to Application Monitoring. You can create, view, modify, or manage alert rules.
- Notification settings
You cannot modify the notification settings for alert rules that you created in the old sub-service after the upgrade. These settings include the alert contacts, notification templates, alert clearance notifications, intervals between repeated notifications, and the validity period of alert rules. To modify these settings, you need to migrate the settings to the Notification Policy page in the new sub-service. Then, you can modify these settings on the Notification Policy page.
- The alert template management feature is removed.
- Default alert rules
Default alert rules are no longer automatically created for applications connected to Application Monitoring or websites connected to Browser Monitoring.
Changes to the Alert Policies page


Changes to the Alert Rule page


Changes to notification method settings
In both the old and new Alert Management sub-service, you can specify contacts or contact groups, notification templates, silence period, and validity period for alert rules. If an alert is triggered, the system sends alert notifications based on the alert rule settings.
After the upgrade, the Notification Policy feature is added. You can use this feature to configure alert notification settings. When you create notification policies, you can specify rules that are used to dispatch alert events generated by alert rules, methods that are used to handle and group alert events, contacts, notification methods, notification templates, silence periods, and escalation policies. When you create alert rules, you must create notification policies or select existing notification policies. You cannot directly specify parameters of notifications as in the earlier version.
We recommend that you create notification policies based on your business requirements in advance. This way, when you create alert rules, you can select existing notification policies to handle and send alert events. Alternatively, you can choose not to specify notification policies when you create alert rules. Then, when you create notification policies, you can create dispatch rules that support fuzzy match to handle and send alert events that match the specified dispatch conditions in dispatch rules.
- For alert rules that are created in the old Alert Management sub-service, if the rules are not coupled with notification policies, alert events and alert notification records that are generated based on the rules cannot be viewed in the new Alert Management sub-service. To view the alert events and alert notification records, choose in the left-side navigation pane and click Previous Version.
- When you modify alert rules that are created in the old Alert Management sub-service,
parameters for notification methods cannot be modified. To modify these parameters,
click Quick Migration on the editing page to migrate the settings of these parameters to the Notification
policy page as notification policies. You can modify and save the migrated notification
policies. Take note of the following information:
- Make sure that the migrated notification policies meet your business requirements. The system automatically sets some of the new parameters to the default values. You can refer to the documentation and modify these parameters based on your business requirements.
- After you migrate settings to the Notification Policy page, the format and content of alert notifications may change. Make sure that the keywords for DingTalk group chats are included in the notification content that you set on the Notification policy page. Otherwise, DingTalk group chats cannot receive alert notifications.
- Alert rules and notification policies are loosely coupled. An alert event that is generated by an alert rule can be coupled with different notification policies. A notification policy can be coupled with alert events that are generated by different alert rules.
Removal of the alert template feature
The alert template feature is removed in the new Alert Management sub-service. In the new Alert Management sub-service, you can apply an alert rule to different applications. We recommend that you use this method to achieve the effect of alert templates.
Changes to default alert rules
Before the upgrade, when you add or import applications to Application Monitoring, websites to Browser Monitoring, or clusters to Prometheus Monitoring, ARMS automatically creates default alert rules based on alert templates.
After the upgrade, when you add or import applications to Application Monitoring or websites to Browser Monitoring, ARMS does not automatically create default alert rules. However, the existing default alert rules can still be triggered. When you add or import clusters to Prometheus Monitoring, ARMS still automatically creates default alert rules.