After adding your website to an Anti-DDoS Proxy instance, you can enable the log analysis feature to collect, store, and query your website's traffic and attack logs.
The Full Logs tab lets you run ad hoc queries against raw log data — useful for investigating specific attack events or tracing suspicious requests. The Log Reports tab provides pre-built dashboards with aggregated traffic and attack metrics — useful for routine monitoring and trend analysis.
Prerequisites
Before you begin, ensure that you have:
An Anti-DDoS Proxy instance with your website added. For more information, see Add one or more websites
Simple Log Service (SLS) activated. If this is your first time accessing the Simple Log Service console, activate SLS as prompted
Storage and query limits
Before purchasing the log analysis feature, review these limits:
| Item | Limit |
|---|---|
| Log retention | 180 days (rolling window — logs from day 181 overwrite day 1) |
| Queryable range | Last 180 days |
| Time range precision | Query results may include logs generated up to 1 minute outside the specified range |
| Storage exhausted | New logs cannot be stored |
| Feature expired | New logs cannot be stored after the validity period ends |
For storage capacity calculations and log sampling details, see Overview of the log analysis feature.
Step 1: Enable the log analysis feature
Log on to the Anti-DDoS Proxy console.
In the top navigation bar, select the region of your instance:
Anti-DDoS Proxy (Chinese Mainland): Select Chinese Mainland.
Anti-DDoS Proxy (Outside Chinese Mainland): Select Outside Chinese Mainland.
In the left-side navigation pane, choose Investigation > Log Analysis.
On the Log Analysis page, click Buy Now.
On the Log Service page, configure the following parameters, click Buy Now, and complete the payment.
Parameter Description Edition Select the instance type of Anti-DDoS Proxy. Log Storage Select the log storage capacity in TB. Logs are retained in a 180-day rolling window. After storage is exhausted, new logs cannot be stored. Duration Select the validity period. After the period expires, new logs cannot be stored.
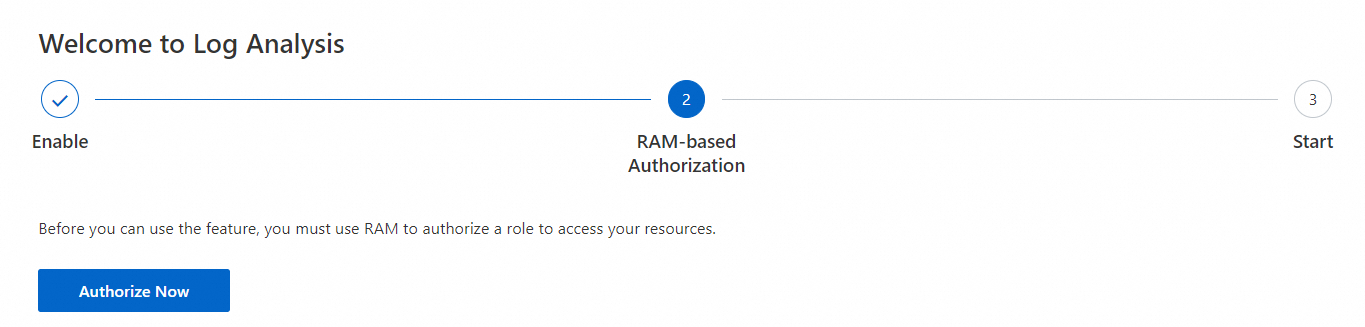
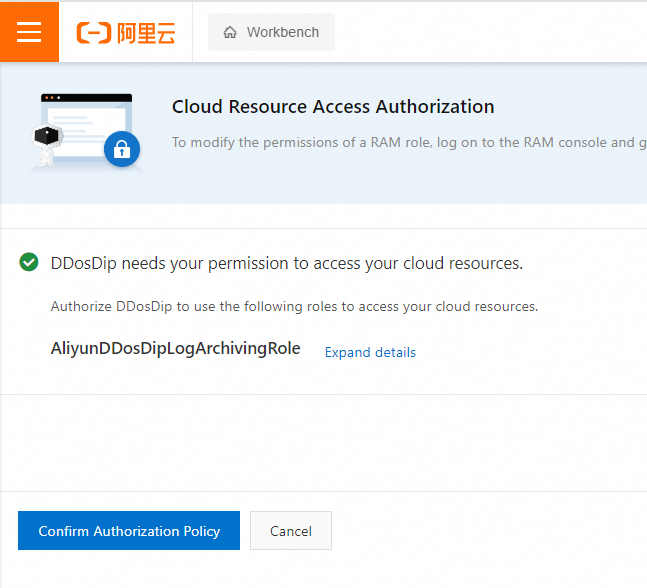
Step 2: Authorize Anti-DDoS Proxy to access Simple Log Service
Return to the Log Analysis page and complete the authorization as prompted. The system automatically creates the service-linked role AliyunDDoSCOOLogArchiveRole. Anti-DDoS Proxy uses this role to access Simple Log Service and store logs in a dedicated Logstore.
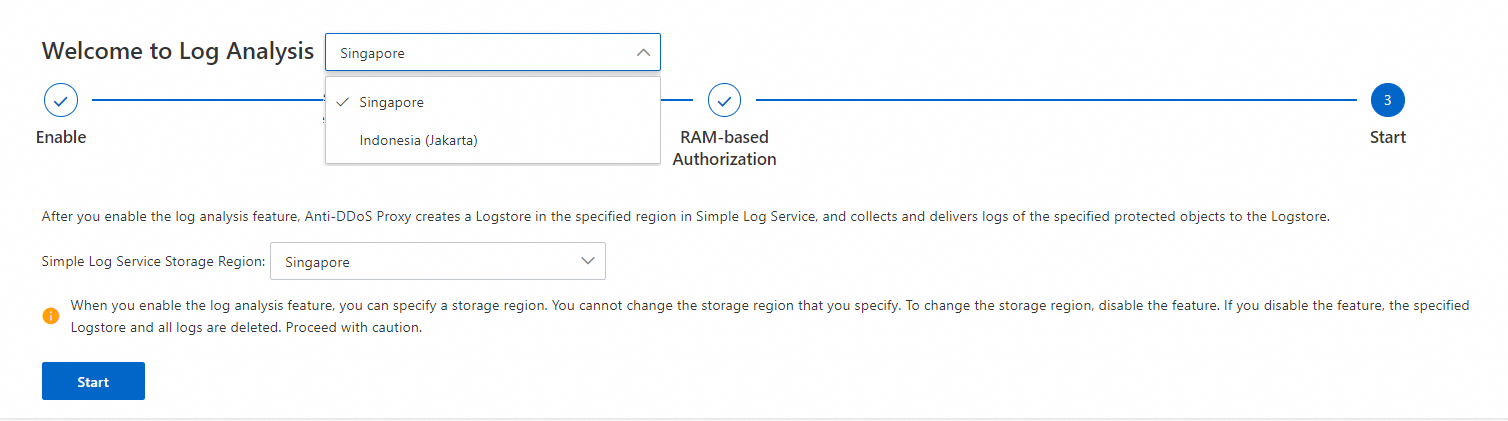
For Anti-DDoS Proxy (Outside Chinese Mainland) instances only: select a region for the dedicated Logstore. Logs for the instance are stored in the selected region. Available regions: Singapore, Indonesia (Jakarta), US (Virginia), China (Hong Kong), UK (London), Germany (Frankfurt), Japan (Tokyo), Malaysia (Kuala Lumpur).
ImportantAfter you select a region, you cannot change it directly. To switch regions, disable the log analysis feature and re-enable it. Disabling the feature permanently deletes the Logstore and all log data. Proceed with caution.
For Anti-DDoS Proxy (Chinese Mainland) instances, no region selection is required. Logs are stored in the China (Hangzhou) region by default.
After authorization is complete, Anti-DDoS Proxy creates a dedicated Logstore in the specified region and begins delivering log data to it.
Step 3: Enable log collection for your websites
On the Log Analysis page, enable log collection for the domain names you want to monitor.
Single domain name: Select a domain name from the Select Domain Names drop-down list, then turn on Status.
Multiple domain names: Click Batch Configure in the upper-right corner. In the Batch Configure panel, select the domain names and click Batch Enable.
After log collection is enabled, Simple Log Service automatically creates a dedicated project for Anti-DDoS Proxy. The project contains the following resources:
| Resource | Details |
|---|---|
| Dedicated project | Visible on the Simple Log Service console home page. Chinese Mainland instances use the prefix Simple Log Service consoleddoscoo-project; Outside Chinese Mainland instances use ddosdip-project. |
| Dedicated Logstore | Named ddoscoo-logstore (Chinese Mainland) or ddosdip-logstore (Outside Chinese Mainland). |
| Preset dashboards | Two dashboards: DDoS Access Center and DDoS Operation Center. |
Step 4: (Optional) Query and analyze logs
Use the Full Logs tab to run ad hoc queries against raw log data. This is useful for investigating specific attack events, tracing suspicious requests, or extracting custom metrics.
For pre-built visualizations and traffic summaries, use the Log Reports tab instead (see Step 5).
Run a query
On the Log Analysis page, select a domain name from the Select Domain Names drop-down list.
Click the Full Logs tab and specify a time range.
Enter a query statement in the search box and click Search & Analyze.
A query statement consists of a search statement and an analytic statement, separated by a vertical bar (|): <Search statement> | <Analytic statement>.
| Component | Required | Description |
|---|---|---|
| Search statement | No | Filters logs by keyword, numeric value, range, or wildcard (*). A space or * returns all logs. See Search syntax and log field reference. |
| Analytic statement | No | Aggregates or computes data from search results. Omit the FROM log clause. Returns the first 100 entries by default; use a LIMIT clause to adjust. See Log analysis overview. |
Results appear as a table by default and can be switched to line charts, column charts, pie charts, and other formats.
Common query examples
The following queries cover the most frequent investigation scenarios. Use them as starting points and adapt the filters to your needs.
Check overall traffic volume by domain
Useful when you want to see which domains are receiving the most requests.
* | SELECT COUNT(*) as times, host GROUP by host ORDER by times desc limit 100Identify attack types being blocked
Useful when an alert fires and you need to understand what kind of attack is occurring.
* | select cc_action, cc_phase, count(*) as t group by cc_action, cc_phase order by t desc limit 10Check queries per second (QPS)
Useful for detecting traffic spikes and correlating them with attack events.
* | select time_series(__time__,'15m','%H:%i','0') as time, count(*)/900 as QPS group by time order by timeFind which domains are under attack
Useful when you suspect a specific domain is being targeted.
and cc_blocks:1 | select cc_action, cc_phase, count(*) as t group by cc_action, cc_phase order by t desc limit 10Find which URLs are being attacked
Useful for identifying the specific endpoints targeted by CC attacks.
and cc_blocks:1 | select count(*) as times, host, request_path group by host, request_path order by timesInspect individual request details
Useful for tracing a specific request or investigating a reported issue from a user.
| select date_format(date_trunc('second',__time__),'%H:%i:%s') as time, host, request_uri, request_method, status, upstream_status, querystring limit 10Diagnose 5XX errors
Useful when origin servers are returning errors and you need to pinpoint which hosts and upstream paths are affected.
and status>499 | select host, status, upstream_status, count(*) as t group by host, status, upstream_status order by t descAnalyze request latency distribution
Useful for identifying slow upstream responses that may indicate origin performance issues.
| SELECT count_if(upstream_response_time<20) as "<20",
  count_if(upstream_response_time<50 and upstream_response_time>20) as "<50",
  count_if(upstream_response_time<100 and upstream_response_time>50) as "<100",
  count_if(upstream_response_time<500 and upstream_response_time>100) as "<500",
  count_if(upstream_response_time<1000 and upstream_response_time>500) as "<1000",
  count_if(upstream_response_time>1000) as ">1000"
To set up alert rules based on query results, see Overview.
Step 5: (Optional) View log reports
Use the Log Reports tab to view pre-built dashboards with aggregated traffic and attack metrics. This is useful for routine monitoring and trend analysis, without writing queries.
Two dashboards are available: DDoS Access Center and DDoS Operation Center.
On the Log Analysis page, select a domain name from the Select Domain Names drop-down list.
Click the Log Reports tab, then click Select Time Range to set a time range.
NoteEach chart has its own default time range (for example, 1 hour for access metrics and 1 week for trend charts). Selecting a time range applies it to all charts on the current page.
View the dashboards.
DDoS Access Center
DDoS Operation Center
Shows overall operations status, including inbound and outbound traffic trends, request and interception trends, attacker information, and visited websites.
To receive dashboard data by email or DingTalk, click Subscribe in the upper-right corner of the Log Reports tab. For setup instructions, see Add a subscription.
References
非中国内地