With the proliferation of IoT, cloud-native technologies, and microservices architectures, the volume of time series data generated by systems is growing exponentially. Traditional monitoring and storage solutions often struggle with the real-time ingestion, rapid querying, and long-term storage of this massive amount of data. AnalyticTimeMetrics is a high-performance, cost-effective, and highly available time series database designed for large-scale metrics monitoring and analysis.
Core features
AnalyticTimeMetrics provides the following core features:
Extreme performance: AnalyticTimeMetrics delivers outstanding write throughput and low query latency. Optimized for time series data, it ingests data at high speeds and supports complex queries with millisecond-level response times.
High cost-effectiveness: Compared to similar products, AnalyticTimeMetrics excels in data compression. Its efficient compression algorithms significantly reduce disk I/O and storage costs, making long-term retention of large volumes of historical data affordable.
High-availability deployment mode: The cluster edition is designed for very large-scale scenarios. It supports horizontal scaling, has no single point of failure, and allows for linear scaling of write and query capabilities.
Prometheus compatibility: Seamlessly compatible with the Prometheus remote read/write protocol and PromQL query language, enabling users in the existing Prometheus ecosystem to migrate smoothly without changing their current monitoring configurations.
Architecture
The core architecture of the AnalyticTimeMetrics cluster edition is as follows:
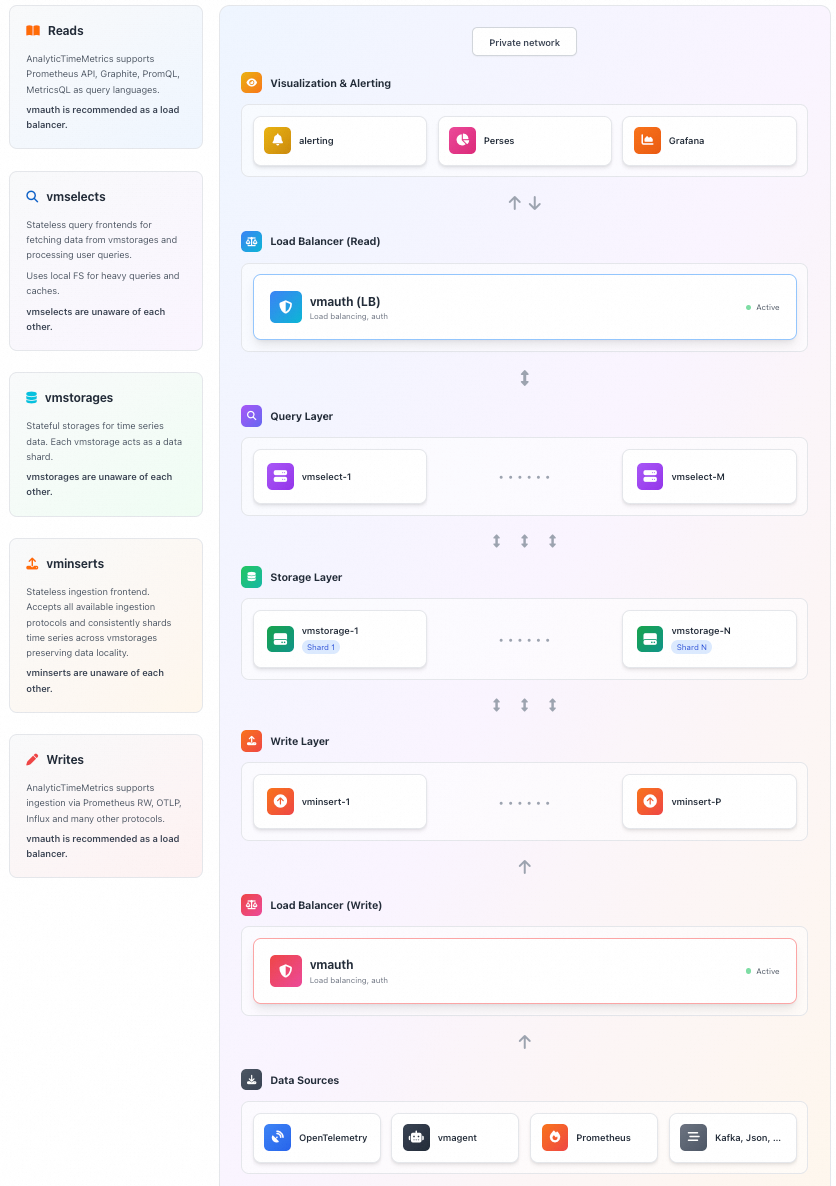
Core components
Component | Type | Description |
vminsert | Ingestion layer | Receives data and handles sharding and load balancing. |
vmstorage | Storage layer | Handles persistent storage of data, data compression, and indexing. |
vmselect | Query layer | Receives query requests, fetches data, and aggregates the results. |
Ecosystem components
Component | Description |
vmagent | Scrapes metrics and sends them via remote write. |
vmalert | Executes alerting and recording rules. |
Performance analysis
Write performance
The write performance of AnalyticTimeMetrics is highly optimized. In the cluster edition, the vminsert component serves as the entry point for writes. It can handle high-concurrency write requests from Prometheus, vmagent, or other clients. vminsert is responsible for data validation, compression, and sharding, efficiently distributing data to the backend storage nodes. AnalyticTimeMetrics supports out-of-order data ingestion and is optimized for high-concurrency write scenarios, easily handling millions or even tens of millions of data points per second.
Query performance
The vmselect component handles query requests. It accepts queries in PromQL or the AnalyticTimeMetrics-enhanced MetricsQL, dispatches them to the relevant storage nodes, and aggregates the results before returning them. AnalyticTimeMetrics builds efficient inverted indexes. These indexes make label-based filtering and aggregation very fast. Additionally, the query cache mechanism further improves response times for repeated queries.
Performance comparison: vmagent vs. Prometheus scraping
The following benchmark test demonstrates the performance advantages of vmagent over the native Prometheus scraping component.
Test environment: Intel Core i7-6700 CPU, 32 GB RAM, 1 TB SSD
Test scenario: A simulated large-scale microservices monitoring environment with 10,000 scrape targets, approximately 1 million unique time series, and a 30-second scrape interval.
Metric | Prometheus 2.37.0 | vmagent | Comparison |
Memory usage (RSS) | Approx. 1.8 GB | Approx. 400 MB |
|
Peak CPU utilization | Approx. 70% (single core) | Approx. 25% |
|
Scrape latency and stability (under sudden increases in targets or scrape interval fluctuations) | Error rate approx. 0.5% (occasional scrape timeouts or lost samples) | Error rate below 0.01% | Because of its asynchronous, non-blocking architecture, |
Cost advantage
Storage cost
AnalyticTimeMetrics uses a columnar storage format to store massive amounts of data at a very low cost, typically achieving compression ratios of 10:1 to 50:1 or even higher. It stores timestamps, values, and labels separately and applies different compression strategies for each data type.
Type | Core algorithm | Principle | Effect |
Timestamp | Delta-of-Delta (DoD) | Encodes the delta of deltas | Converts timestamps into small integers, often close to zero. |
Floating-point value | Gorilla (XOR) | Uses XOR to store only the bits that change | Achieves a high compression ratio for values with small fluctuations. |
Integer value | ZSTD / LZ4 | General-purpose compression algorithms | Provides fast and high-ratio compression. |
Label/metadata | Dictionary encoding + ZSTD | Global deduplication and compression | Eliminates duplicate strings to significantly reduce index size. |
Hardware cost
AnalyticTimeMetrics's high resource efficiency allows it to run on lower-spec hardware or process more data on the same hardware. This high resource efficiency reduces the total cost of ownership (TCO).
By default, it uses high-efficiency ESSD cloud disks (PL1). If you have high read/write requirements, you can submit a ticket to upgrade to PL2 or PL3.
High availability
High-availability architecture
The AnalyticTimeMetrics cluster edition is designed with no single point of failure, and all core components can be scaled horizontally:
Single availability zone, multi-replica deployment: For high availability, run at least two nodes for each service.
Failover: When a node becomes unavailable, the system automatically routes writes and queries to other healthy nodes. The remaining nodes share the load, ensuring uninterrupted service.
Data security
Data replication: AnalyticTimeMetrics does not provide native cross-node data replication (to simplify the architecture). We recommend deploying the cluster within the same subnet and use cloud storage replication features or external tools to ensure data security.
Consistency: With precise configuration, it can handle duplicate and out-of-order data to ensure data consistency.
Operational recommendations
Deploy in the same subnet: Deploy all cluster components within the same high-bandwidth, low-latency subnet to improve performance and availability and to avoid network instability across availability zones.
Use multiple smaller storage nodes: Instead of using a few large-capacity nodes, run multiple smaller ones. This approach ensures that if a node fails, the load increase on the remaining nodes is more gradual.
Ease of use
Rich component ecosystem
AnalyticTimeMetrics provides a complete suite of tools that cover all stages of monitoring:
vmagent: A high-performance scraping component that can be used as a replacement for Prometheus. It supports service discovery and remote write.
vmalert: Responsible for executing alerting and recording rules by pulling and calculating metrics from data sources.
vmalertmanager: Compatible with Prometheus Alertmanager, it handles alert routing, grouping, silencing, and notifications, with support for email, DingTalk, Lark, and more.
Intuitive visualization
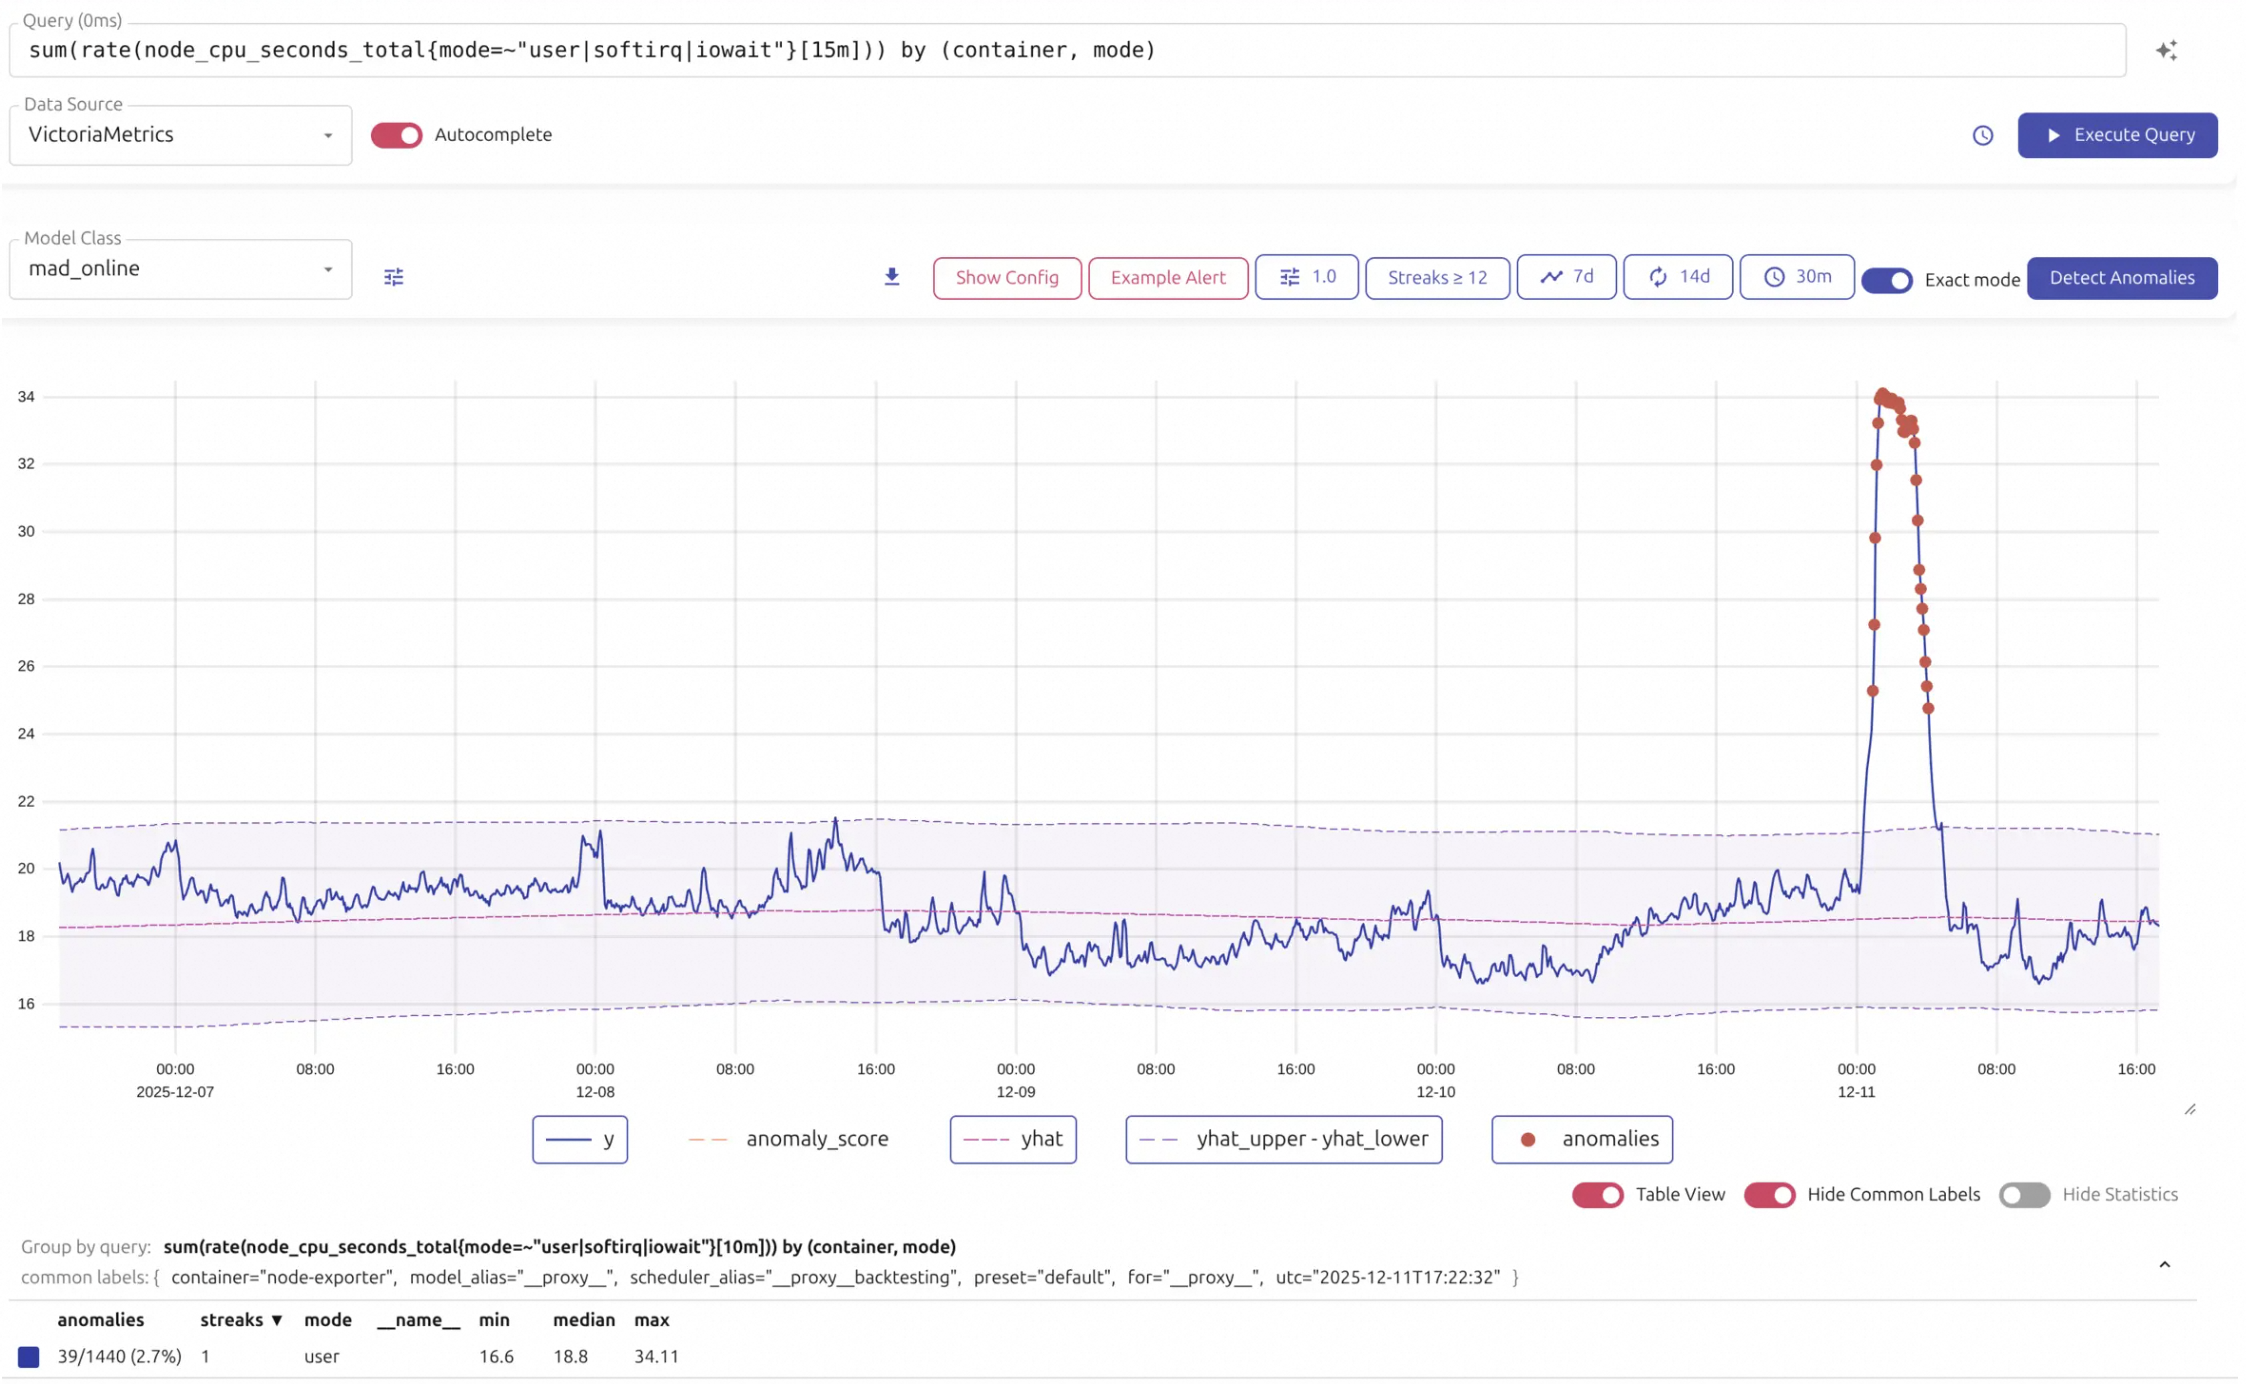
AnalyticTimeMetrics includes a powerful, lightweight, web-based visual UI designed to provide a convenient query and visualization experience. It lets you perform daily data exploration without relying on external tools.
Visual query and exploration: The UI displays query results as a chart or table and supports zooming, scrolling, and dragging to easily view data trends over different time ranges. It supports entering MetricsQL/PromQL statements in a query box with an auto-complete feature.
Production troubleshooting: When investigating issues in a production environment, the Raw Query feature lets you view raw sample data. This is highly effective for debugging unexpected query results. It also displays Top Queries and Active Queries, helping operators identify frequent or slow queries to optimize system performance.
Managing high cardinality: To address the common problem of high cardinality (where an excessive number of metric labels causes data bloat), the visual UI provides specialized tools to help discover metrics with high cardinality. With these tools, you can quickly locate poorly designed labels, perform periodic inspections, and effectively control data volume, which improves query efficiency and saves storage resources.