Service Mesh (ASM) provides two independent access log features that you can enable separately based on your observability needs:
| Feature | Description |
|---|---|
| Log generation | The gateway prints access logs to standard output. You can customize which fields are included. |
| Log collection | Generated logs are sent to Simple Log Service (SLS) for storage, querying, analysis, and dashboard visualization. |
Prerequisites
Before you begin, make sure that you have:
Activated Simple Log Service for your Alibaba Cloud account
Installed the logtail-ds component in the data-plane cluster
ASM does not charge for collecting logs to SLS. However, SLS itself charges in either pay-by-feature or pay-by-ingested-data billing mode. For details, see Billing overview.
Enable access log generation
Configure which fields the gateway prints to standard output. For details, see Customize access logs of clusters on the data plane.
Enable access log collection
Set up SLS to collect the access logs generated by the gateway. For details, see Use Log Service to collect access logs on the data plane.
View access logs
The method for viewing collected access logs depends on your ASM instance version.
ASM versions earlier than 1.17.2.35
For ASM instances earlier than 1.17.2.35, see Use Log Service to collect access logs on the data plane.
ASM version 1.17.2.35 or later
ASM 1.17.2.35 and later provides built-in log viewing in the console.
Log on to the ASM console.
In the left-side navigation pane, choose Service Mesh > Mesh Management.
On the Mesh Management page, click the name of your ASM instance.
In the left-side navigation pane, choose ASM Gateways > Ingress Gateway or ASM Gateways > Egress Gateway.
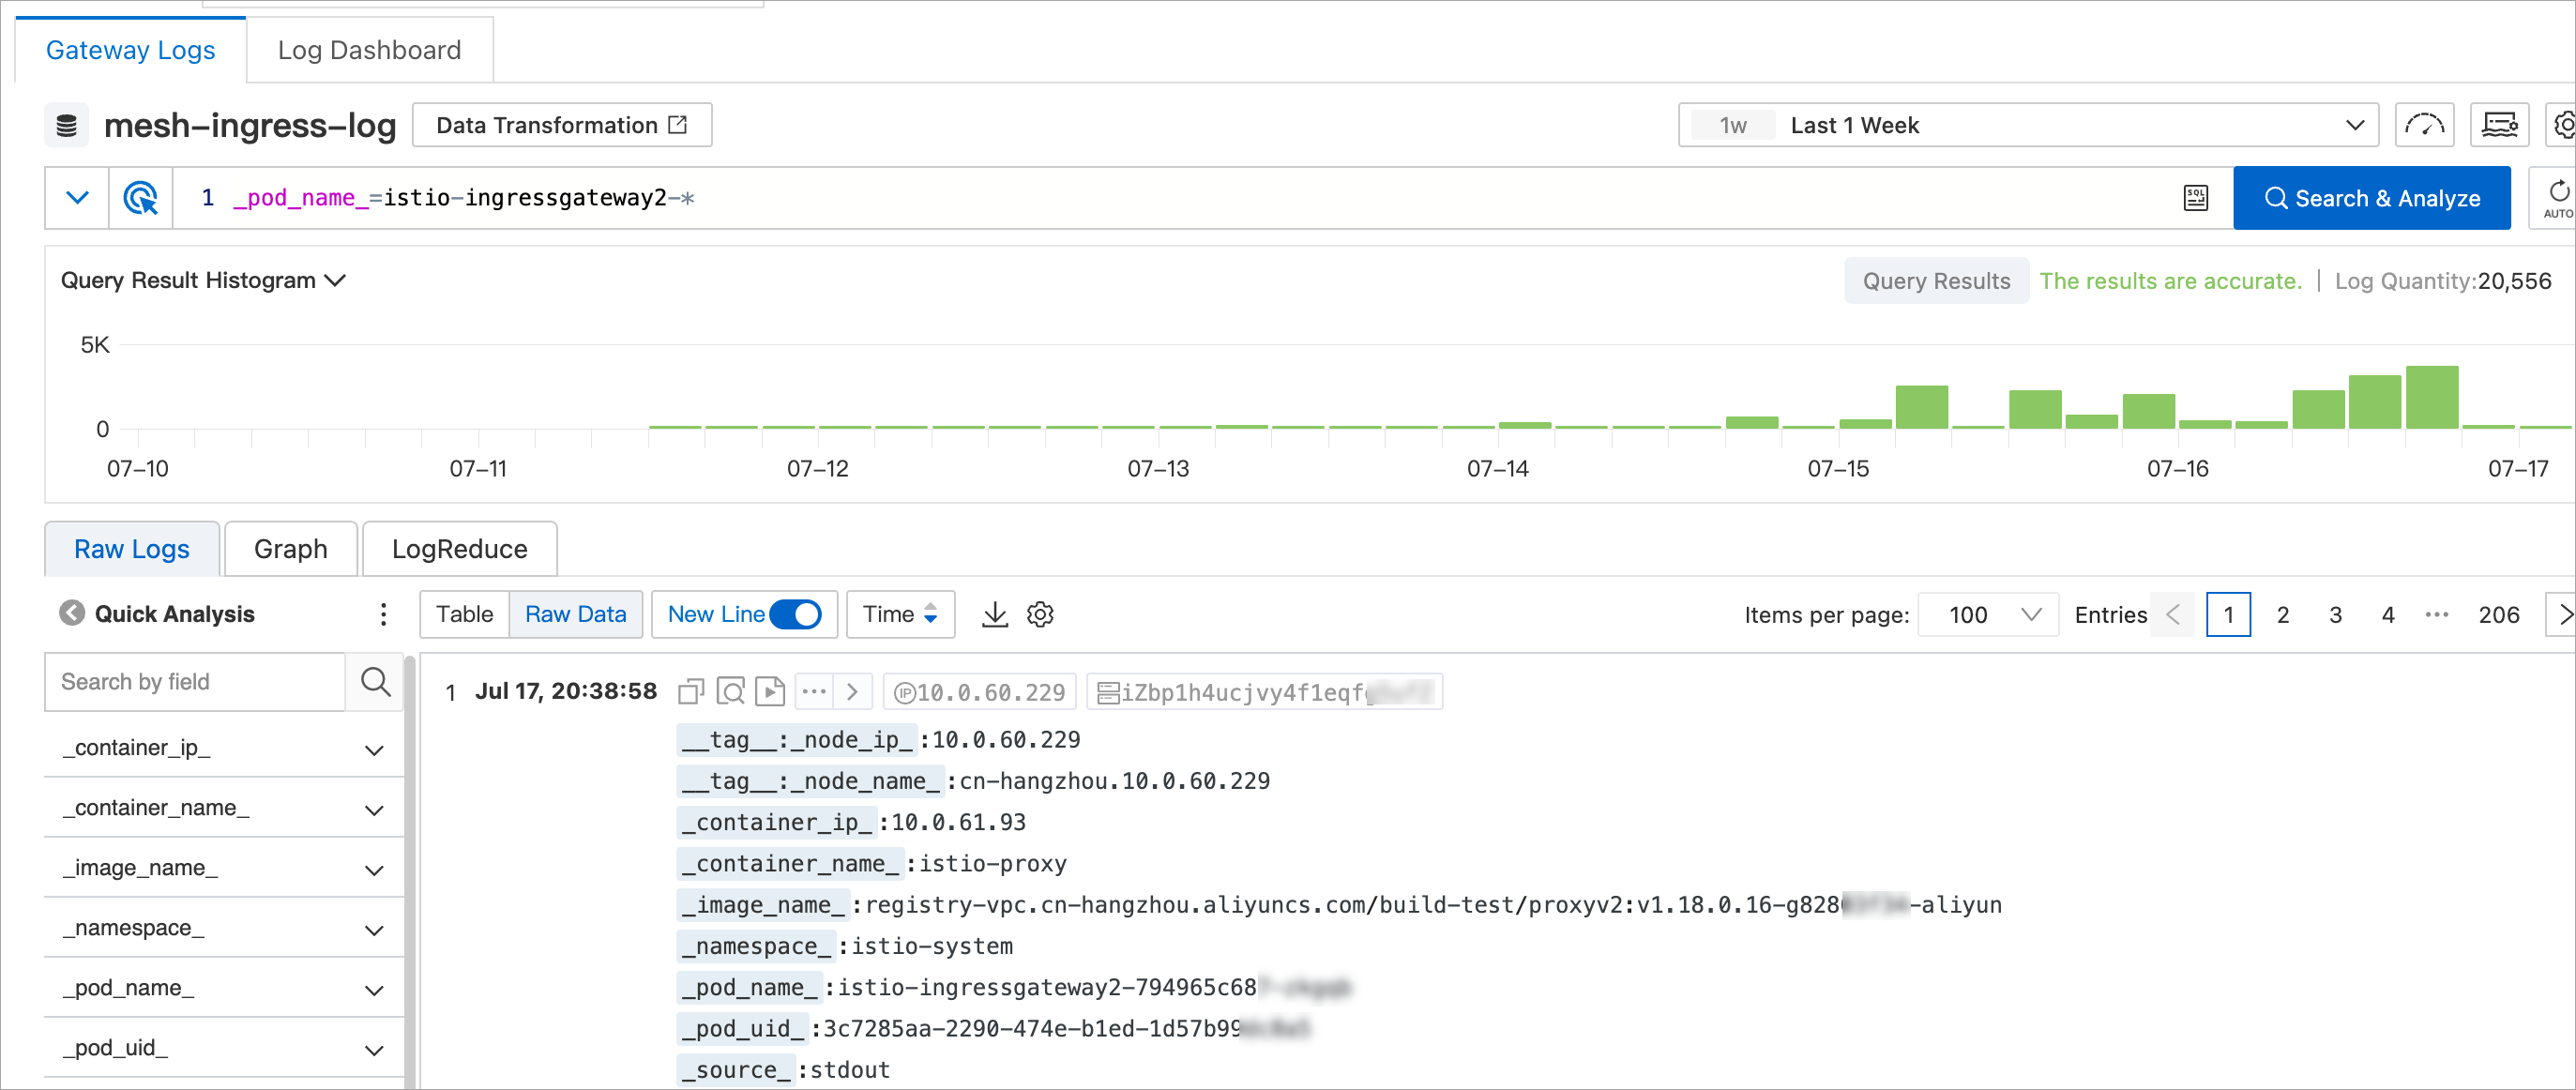
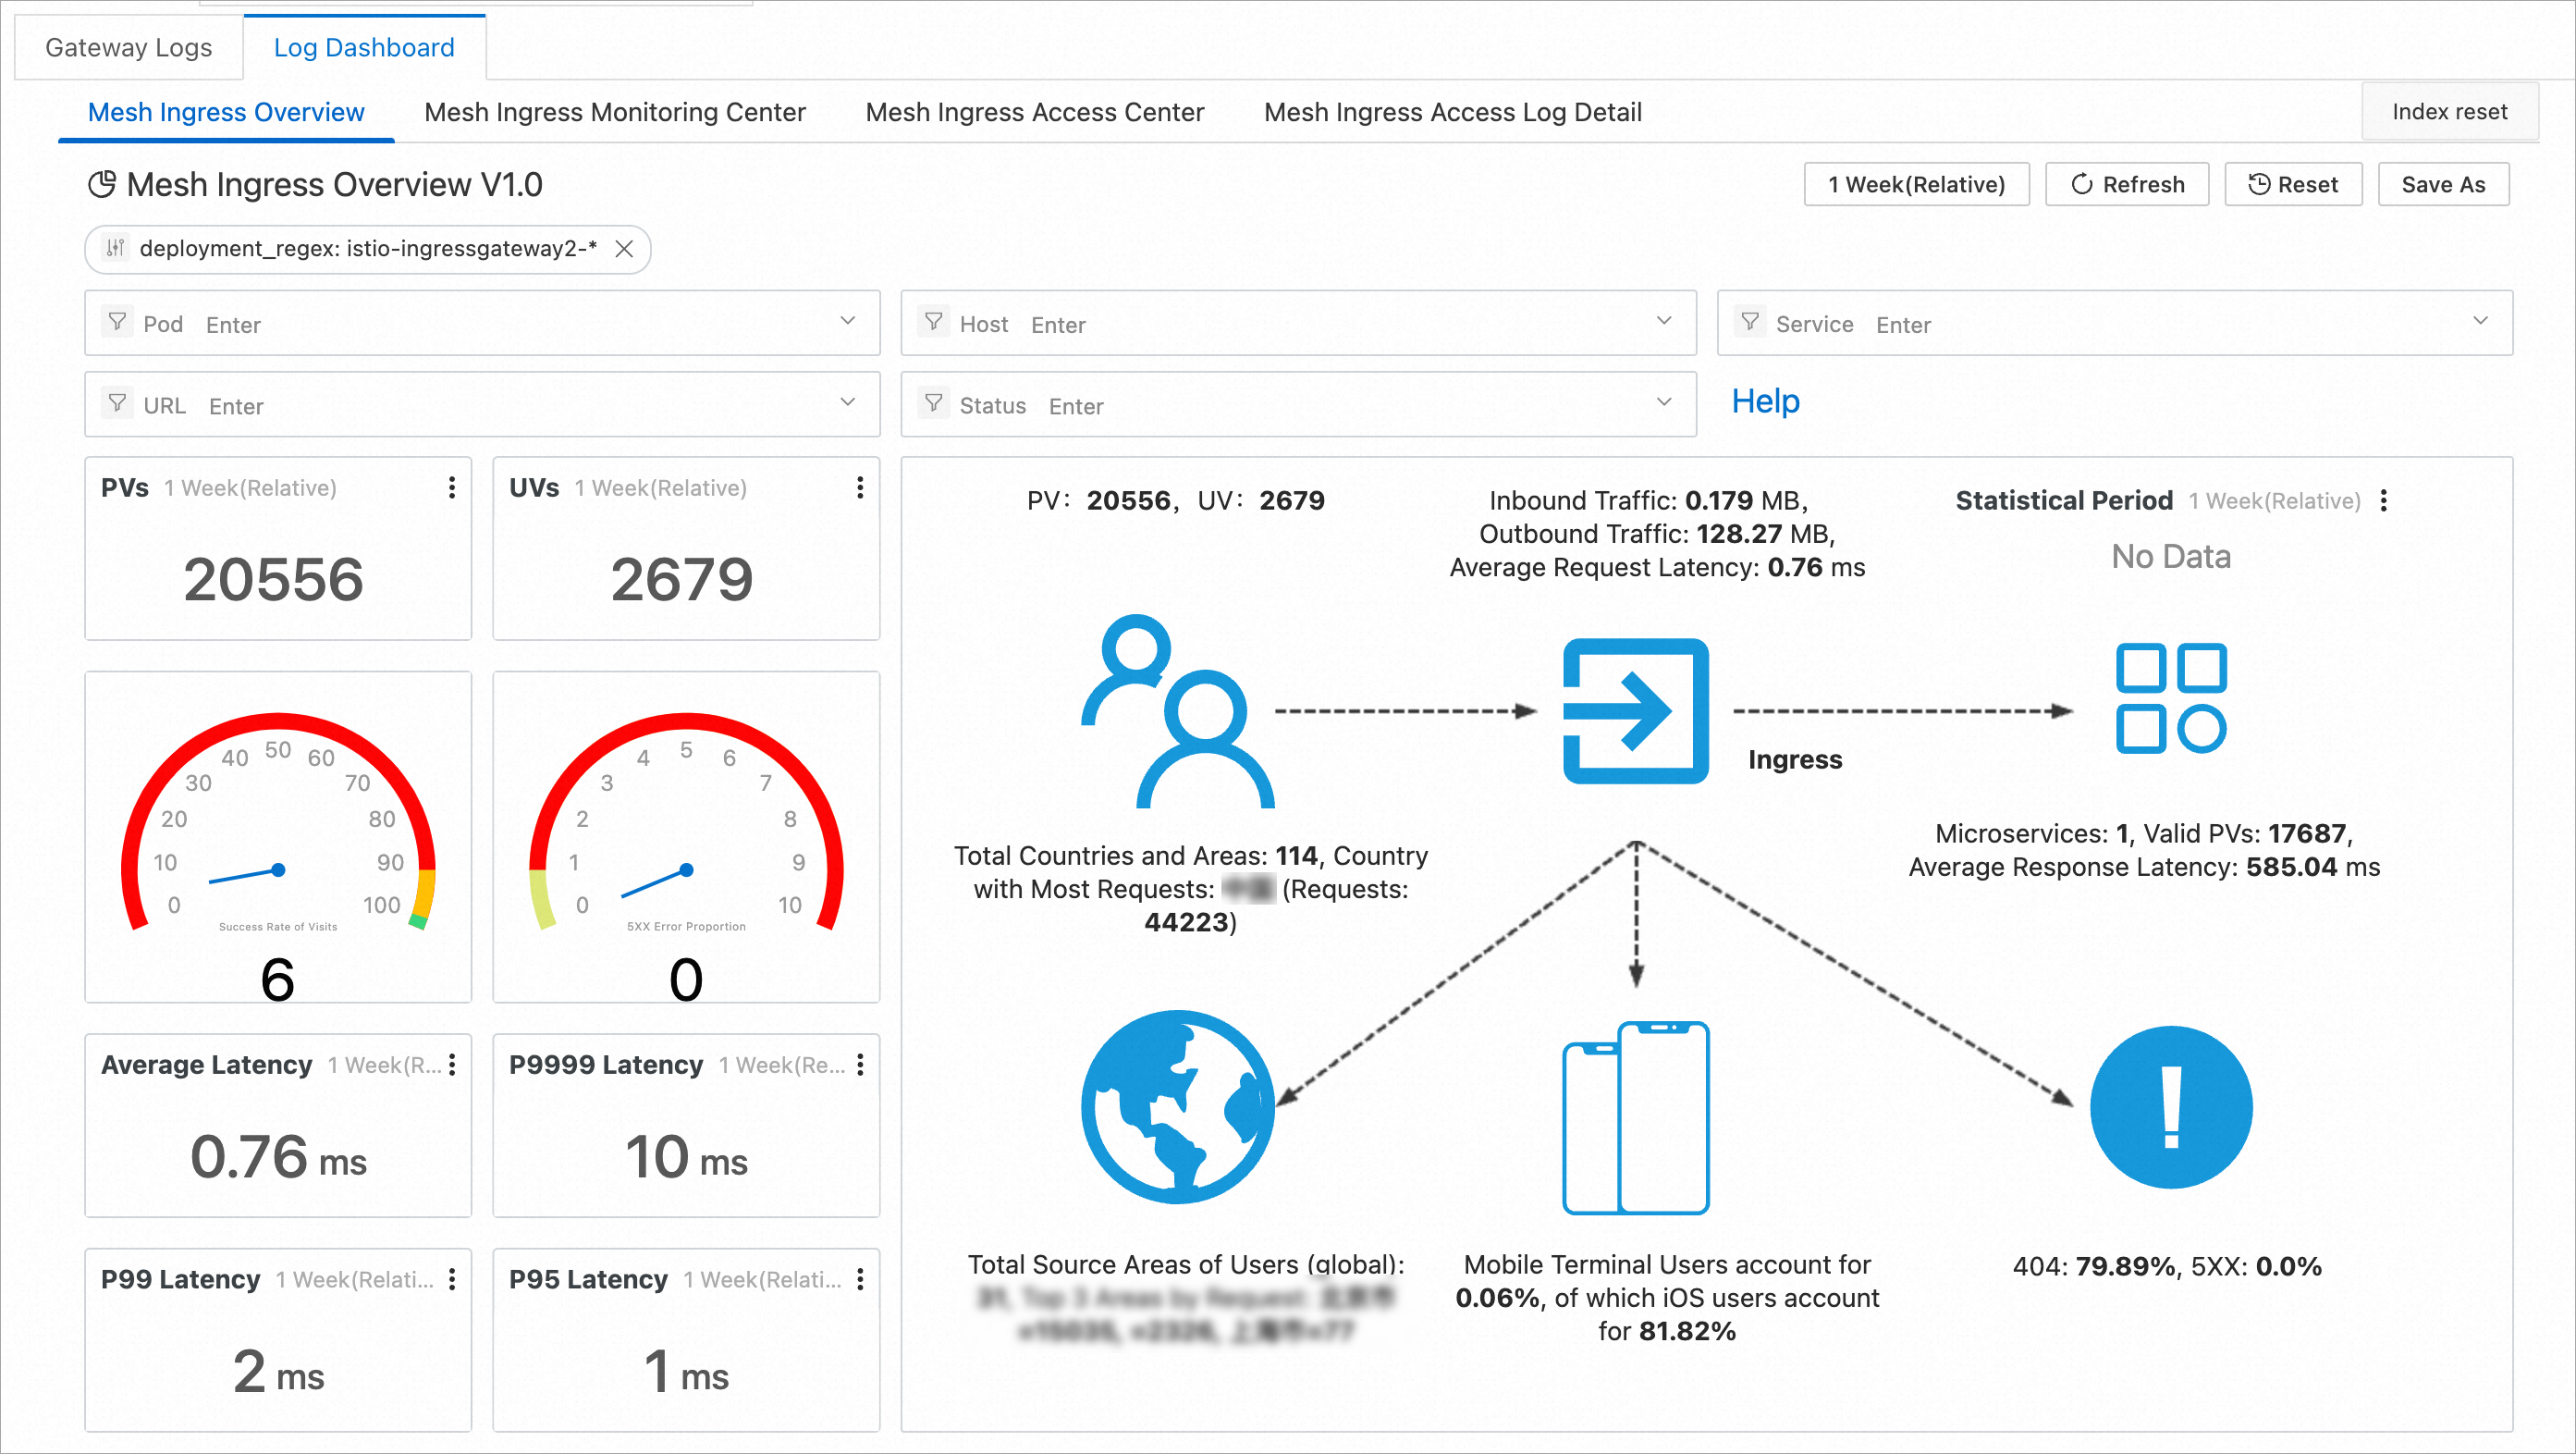
In the Observability section of the target gateway, click Log Center or Log Dashboard.
View Description Gateway Logs Displays only the access logs of the current gateway. Log Dashboards Displays only the log analysis results of the current gateway.