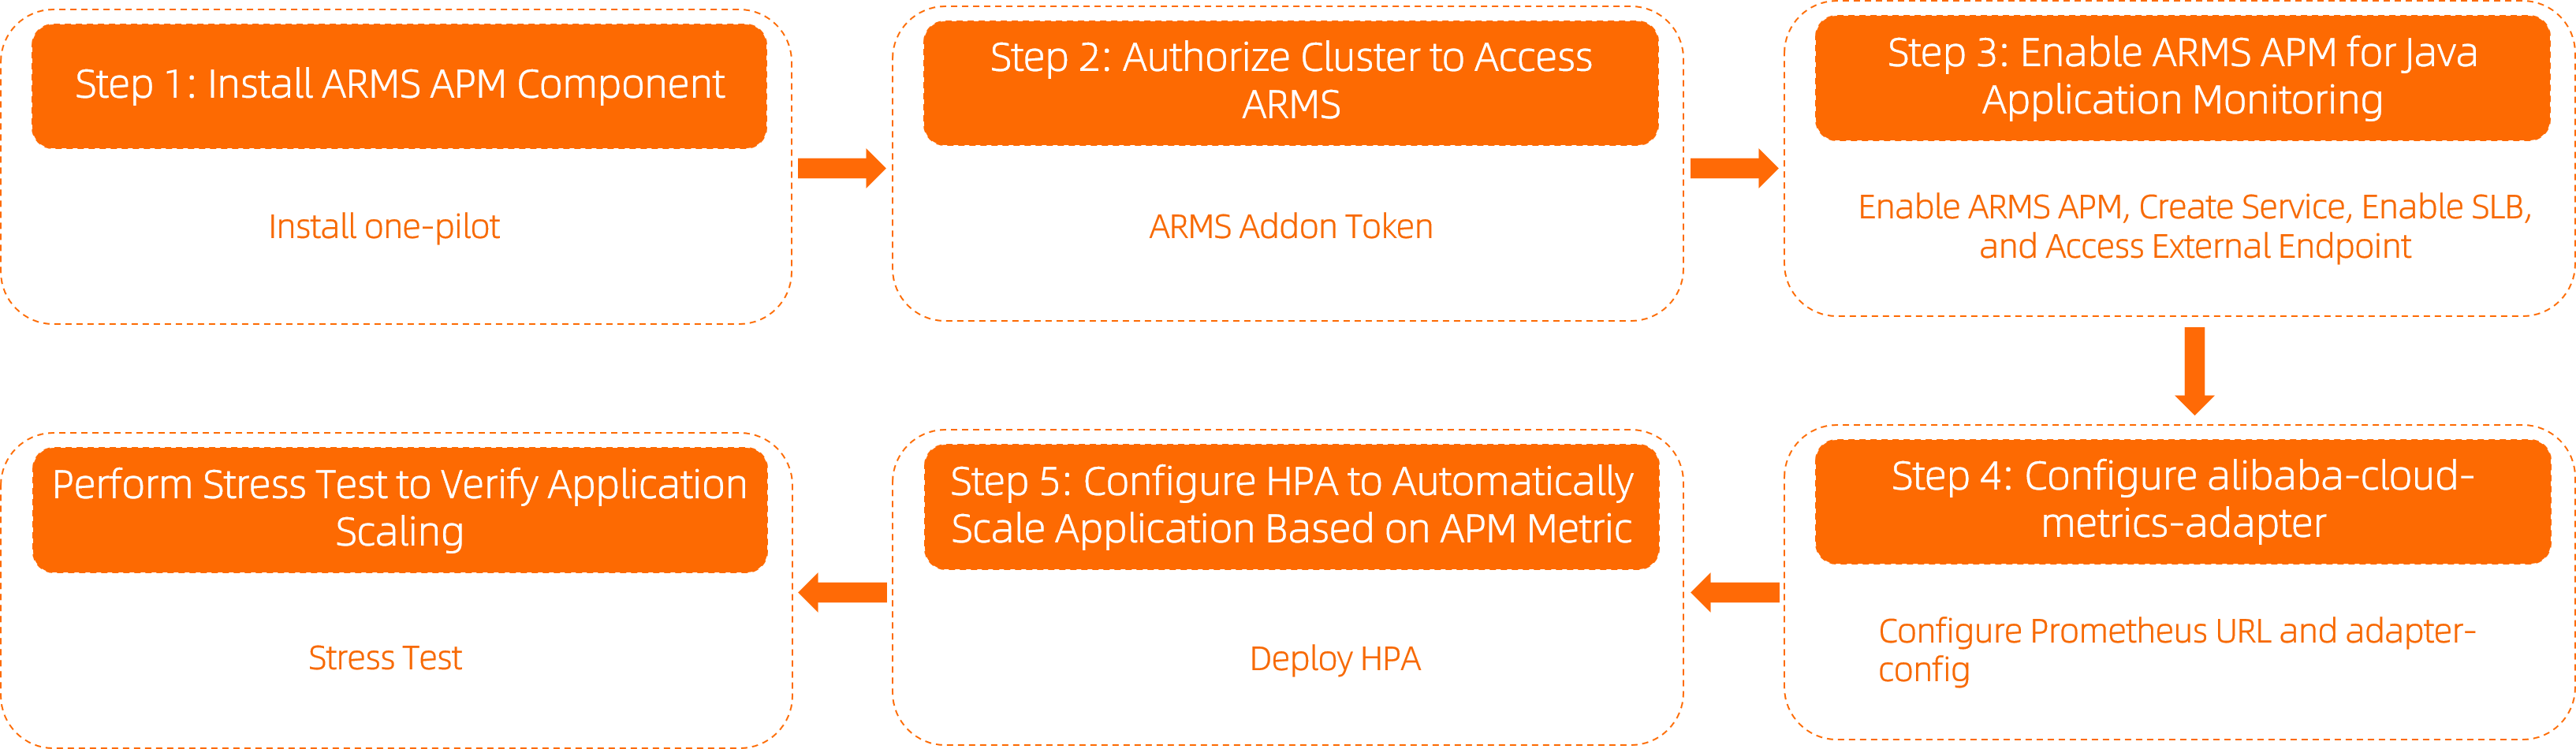
When API traffic spikes, your application needs to scale fast enough to keep up. This guide shows you how to drive a Horizontal Pod Autoscaler (HPA) from live QPS (queries per second) data collected by ARMS Application Monitoring—so your pods scale based on real request load, not just CPU or memory.
How it works
ARMS Application Monitoring instruments your Java application and exposes per-API request counts as Prometheus metrics. The ack-alibaba-cloud-metrics-adapter component reads those Prometheus metrics and presents them to the Kubernetes HPA through the External Metrics API. The HPA then scales your Deployment up or down based on the threshold you configure.
The full data path is:
ARMS Application Monitoring collects per-API request counts from your Java application → Alibaba Cloud Prometheus stores the metrics → ack-alibaba-cloud-metrics-adapter converts the Prometheus data into Kubernetes External Metrics API format → Kubernetes HPA reads the metric and scales your Deployment up or down.
This guide uses the arms-springboot-demo application and its /demo/queryUser/10 endpoint as a working example throughout.
Prerequisites
Before you begin, make sure you have:
-
Alibaba Cloud Prometheus monitoring deployed in your cluster. See Use Alibaba Cloud Prometheus for monitoring.
-
The
ack-alibaba-cloud-metrics-adaptercomponent deployed in thekube-systemnamespace, with itsprometheus.urlfield configured. See Deploy ack-alibaba-cloud-metrics-adapter. Configure `prometheus.url`-
Log on to the ACK console. In the left navigation pane, click Clusters.
-
On the Clusters page, click the cluster name. In the left navigation pane, choose Applications > Helm.
-
On the Helm page, find ack-alibaba-cloud-metrics-adapter and click Update in the Actions column.
-
In the Update Release panel, set
alibabaCloudMetricsAdapter.prometheus.urlto your Prometheus data request URL, then click OK. > For how to get the Prometheus data request URL, see How to obtain the Prometheus data request URL. For a description of the full configuration file, see ack-alibaba-cloud-metrics-adapter configuration reference.
-
-
A namespace created for the demo. This guide uses
arms-demo. See Manage namespaces and quotas. -
A Java Development Kit (JDK) installed. For supported JDK versions, see Java components and frameworks supported by ARMS.
Step 1: Install the ARMS Application Monitoring component
Install the ack-onepilot component to connect your application to ARMS Application Monitoring.
-
Log on to the ACK console. In the left navigation pane, click Clusters.
-
On the Clusters page, click the cluster name. In the left navigation pane, click Add-ons.
-
Search for ack-onepilot, configure its parameters, and complete the installation.
Step 2: Grant ARMS access permissions
The required authorization depends on your cluster type.
For ACK Serverless clusters or applications connected to ECI:
Complete the authorization on the RAM Quick Authorization page, then restart all pods of the ack-onepilot component.
For standard ACK clusters:
Check whether an ARMS Addon Token exists in the cluster.
-
Log on to the ACK console. In the left navigation pane, click Clusters.
-
On the Clusters page, click the cluster name. In the left navigation pane, choose Configurations > Secrets.
-
At the top of the page, set Namespace to kube-system and check whether
addon.arms.tokenexists.
-
If the token exists: ARMS performs password-free authorization automatically.
ACK managed clusters include an ARMS Addon Token by default. Some older managed clusters may not have one—in that case, grant permissions manually using the steps below.
-
If the token does not exist: Grant permissions manually.
-
Create a custom policy with the following content. See Step 1: Create a custom policy. ``
json { "Action": "arms:*", "Resource": "*", "Effect": "Allow" }`` -
Attach the custom policy to the cluster's worker RAM role. See Step 2: Grant permissions to the worker RAM role of the cluster.
-
Step 3: Enable ARMS Application Monitoring for your Java application
Enable monitoring by adding labels to your Deployment's spec.template.metadata section.
-
Log on to the ACK console. In the left navigation pane, click Clusters.
-
On the Clusters page, click the cluster name. In the left navigation pane, choose Workloads > Deployments.
-
On the Deployments page, click Create from YAML.
-
Select a template from Sample Templates. In the Templates field, add the following labels to
spec.template.metadata:Enabling Application Security incurs additional charges. See What is Application Security? and Billing.
labels:
  armsPilotAutoEnable: "on"
  armsPilotCreateAppName: "<your-deployment-name>"  # Required: replace with your application name
  one-agent.jdk.version: "OpenJDK11"               # Required only for JDK 11
  armsSecAutoEnable: "on"                           # Optional: enables Application Security
The complete YAML below deploys the
arms-springboot-demoapplication with ARMS monitoring enabled. Complete YAML sample (Java)apiVersion: v1 kind: Namespace metadata: name: arms-demo --- apiVersion: apps/v1 kind: Deployment metadata: name: arms-springboot-demo namespace: arms-demo labels: app: arms-springboot-demo spec: replicas: 2 selector: matchLabels: app: arms-springboot-demo template: metadata: labels: app: arms-springboot-demo armsPilotAutoEnable: "on" armsPilotCreateAppName: "arms-k8s-demo" one-agent.jdk.version: "OpenJDK11" spec: containers: - resources: limits: cpu: 0.5 image: registry.cn-hangzhou.aliyuncs.com/arms-docker-repo/arms-springboot-demo:v0.1 imagePullPolicy: Always name: arms-springboot-demo env: - name: SELF_INVOKE_SWITCH value: "true" - name: COMPONENT_HOST value: "arms-demo-component" - name: COMPONENT_PORT value: "6666" - name: MYSQL_SERVICE_HOST value: "arms-demo-mysql" - name: MYSQL_SERVICE_PORT value: "3306" --- apiVersion: v1 kind: Service metadata: labels: name: arms-springboot-demo name: arms-springboot-demo namespace: arms-demo spec: ports: - name: arms-demo-svc port: 6666 targetPort: 8888 selector: app: arms-springboot-demo --- apiVersion: apps/v1 kind: Deployment metadata: name: arms-springboot-demo-subcomponent namespace: arms-demo labels: app: arms-springboot-demo-subcomponent spec: replicas: 2 selector: matchLabels: app: arms-springboot-demo-subcomponent template: metadata: labels: app: arms-springboot-demo-subcomponent armsPilotAutoEnable: "on" armsPilotCreateAppName: "arms-k8s-demo-subcomponent" one-agent.jdk.version: "OpenJDK11" spec: containers: - resources: limits: cpu: 0.5 image: registry.cn-hangzhou.aliyuncs.com/arms-docker-repo/arms-springboot-demo:v0.1 imagePullPolicy: Always name: arms-springboot-demo-subcomponent env: - name: SELF_INVOKE_SWITCH value: "false" - name: MYSQL_SERVICE_HOST value: "arms-demo-mysql" - name: MYSQL_SERVICE_PORT value: "3306" --- apiVersion: v1 kind: Service metadata: labels: name: arms-demo-component name: arms-demo-component namespace: arms-demo spec: ports: - name: arms-demo-component-svc port: 6666 targetPort: 8888 selector: app: arms-springboot-demo-subcomponent --- apiVersion: apps/v1 kind: Deployment metadata: name: arms-demo-mysql namespace: arms-demo labels: app: mysql spec: replicas: 1 selector: matchLabels: app: mysql template: metadata: labels: app: mysql spec: containers: - resources: limits: cpu: 0.5 image: registry.cn-hangzhou.aliyuncs.com/arms-docker-repo/arms-demo-mysql:v0.1 name: mysql ports: - containerPort: 3306 name: mysql --- apiVersion: v1 kind: Service metadata: labels: name: mysql name: arms-demo-mysql namespace: arms-demo spec: ports: - name: arms-mysql-svc port: 3306 targetPort: 3306 selector: app: mysql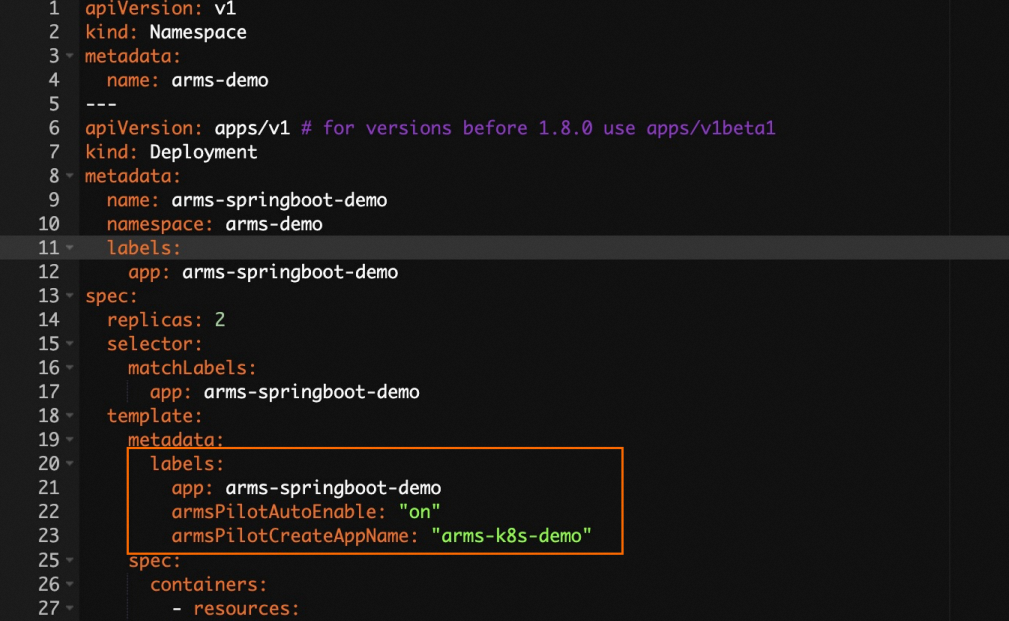
-
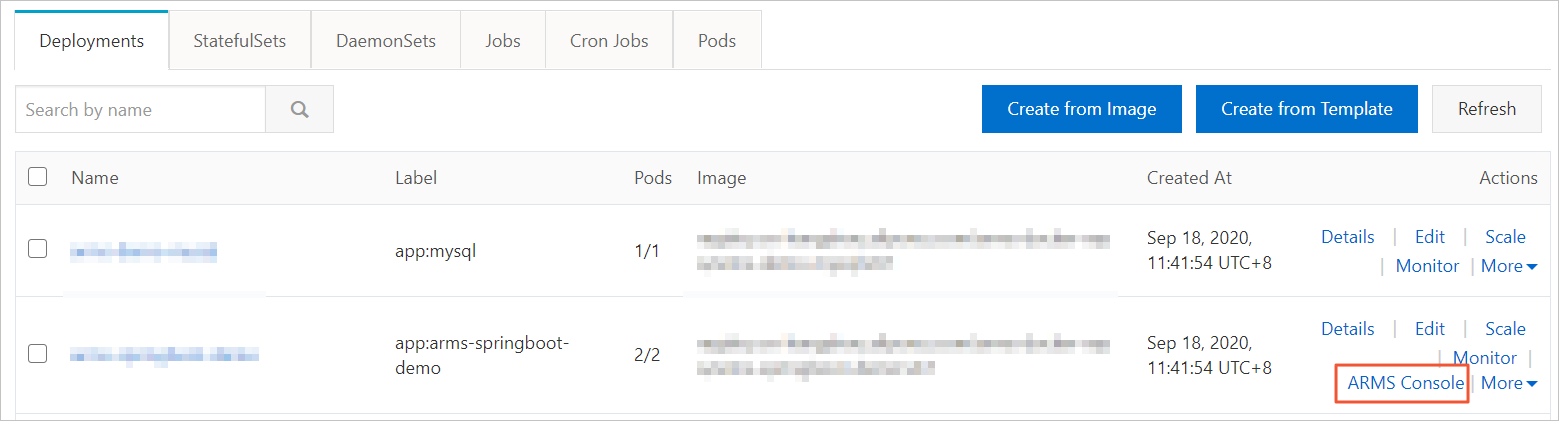
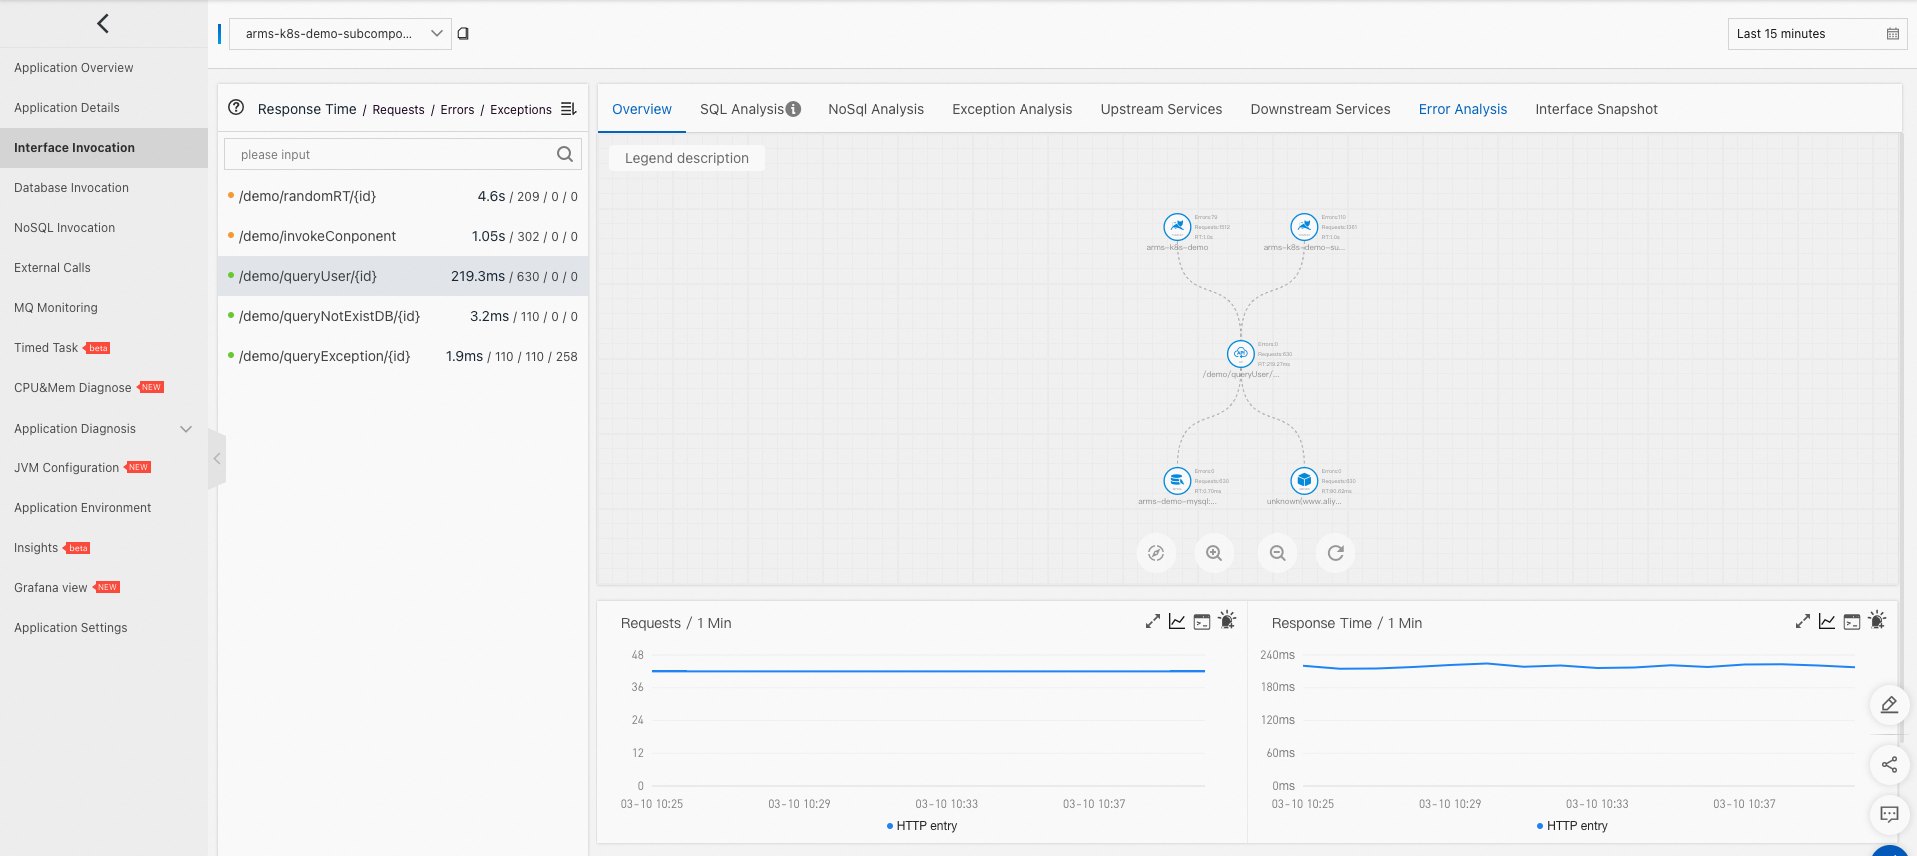
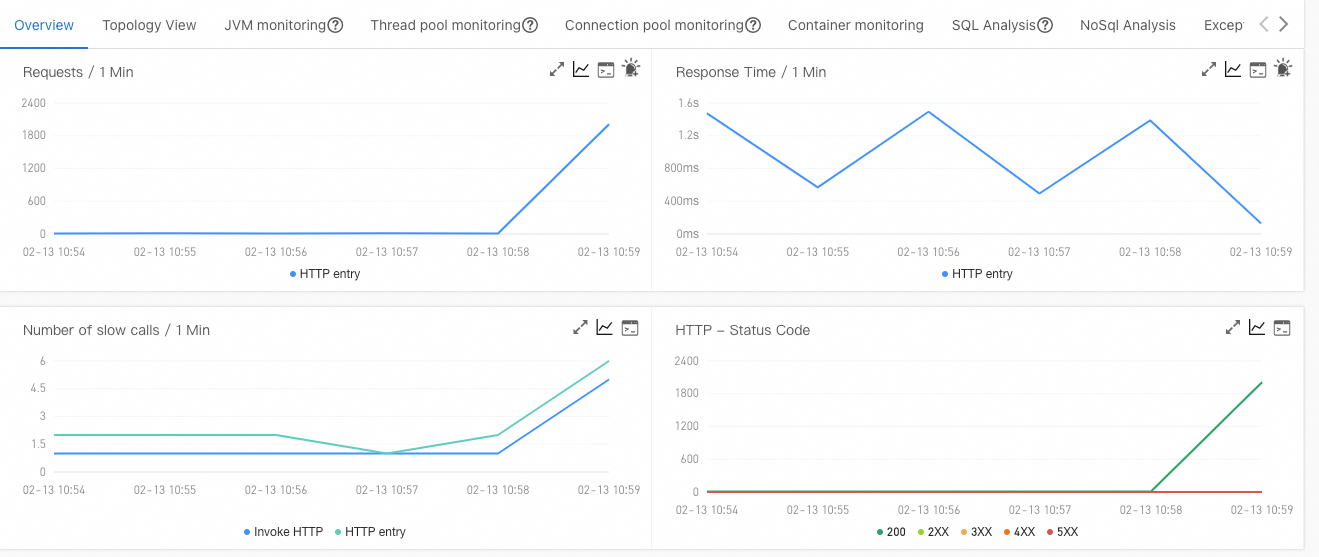
Verify the deployment. On the Deployments page, the ARMS Console button appears in the Actions column for the target application. Click ARMS Console to view monitoring data. In the left navigation pane, click Interface Invocation to see access details for HTTP interfaces. The demo application automatically generates continuous interface calls.
-
Create a Service for
arms-springboot-demoand enable load balancing.-
On the Clusters page, click the cluster name. In the left navigation pane, choose Network > Services.
-
Click Create, configure the Service, then click OK. See Create a Service for configuration details.
-
After the Service is created, record the External IP of
arms-demo-svc(for example,47.94.XX.XX:8080). -
Test the endpoint: ``
shell curl http://47.94.XX.XX:8080/demo/queryUser/10`Expected output:`json {"id":1,"name":"KeyOfSpectator","password":"12****"}``
-
Step 4: Configure the metrics adapter
Alibaba Cloud Prometheus monitoring and the ack-alibaba-cloud-metrics-adapter component (deployed in kube-system) must both be running before you proceed.
This step maps ARMS APM request-count data to a named external metric that the HPA can consume. The metric name used in hpa.yaml (Step 5) is generated from the name.as field you configure here.
4.1 Get the Prometheus URL
-
Log on to the ARMS console.
-
In the left navigation pane, choose Managed Service for Prometheus > Instances.
-
Click the target instance name (format:
arms_metrics_{RegionId}_XXX). In the left navigation pane, click Settings. -
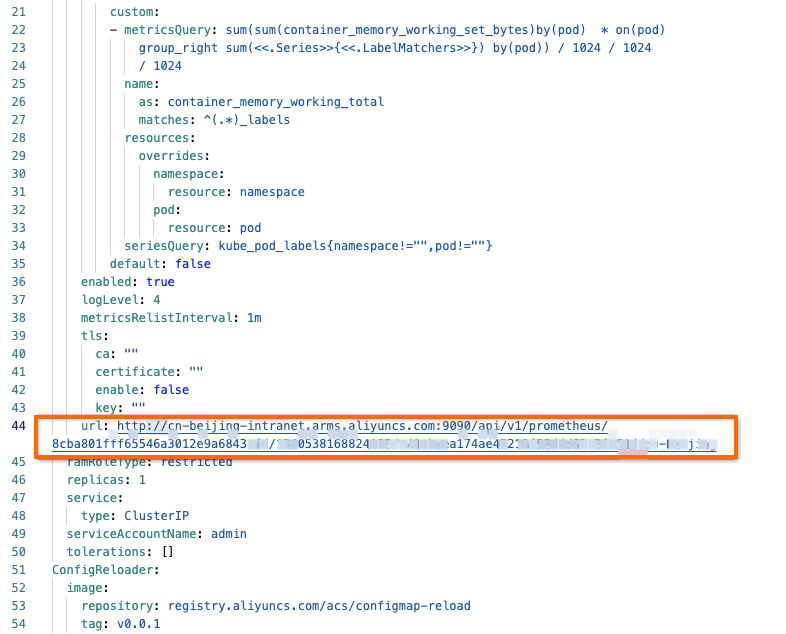
At the bottom of the Settings tab, record the HTTP API URL (Grafana Read URL). This is your Prometheus URL.

4.2 Set the Prometheus URL in the adapter
-
Log on to the ACK console. In the left navigation pane, click Clusters.
-
On the Clusters page, click the cluster name. In the left navigation pane, choose Applications > Helm.
-
On the Helm page, find ack-alibaba-cloud-metrics-adapter and click Update in the Actions column.
-
In the Update Release panel, insert the Prometheus URL you recorded above.
4.3 Add an ARMS metric rule to adapter-config
-
On the Helm page, click ack-alibaba-cloud-metrics-adapter.
-
On the Basic Information tab, click adapter-config.
-
In the upper-right corner, click Edit YAML.
-
Add the following rule to
adapter-config:rules: - metricsQuery: sum(sum_over_time_lorc(<<.Series>>{service="arms-k8s-demo",clusterId="cc13c8725******a9839190b7d1695d7",serverIp=~".*",callKind=~"http|rpc|custom_entry|server|consumer|schedule",source="apm",<<.LabelMatchers>>}[1m])) or vector(0) # ^^ Replace with your ARMS service name # ^^ Replace with your cluster ID name: as: "${1}_per_second" # Generates the HPA metric name: arms_app_requests_per_second matches: "^(.*)_count_ign_destid_endpoint_ppid_prpc" resources: namespaced: false seriesQuery: arms_app_requests_count_ign_destid_endpoint_ppid_prpc{service="arms-k8s-demo",clusterId="cc13c8725******a9839190b7d1695d7"} # ^^ Replace with your ARMS service name and cluster IDReplace
arms-k8s-demowith your ARMS service name andcc13c8725****a9839190b7d1695d7` with your cluster ID. Completeadapter-config` example**apiVersion: v1 data: config.yaml: > rules: - metricsQuery: sum(<<.Series>>{<<.LabelMatchers>>}) by (<<.GroupBy>>) name: as: ${1}_bytes_per_second matches: ^(.*)_bytes resources: overrides: namespace: resource: namespace pod: resource: pod seriesQuery: container_memory_working_set_bytes{namespace!="",pod!=""} - metricsQuery: sum(rate(<<.Series>>{<<.LabelMatchers>>}[1m])) by (<<.GroupBy>>) name: as: ${1}_core_per_second matches: ^(.*)_seconds_total resources: overrides: namespace: resource: namespace pod: resource: pod seriesQuery: container_cpu_usage_seconds_total{namespace!="",pod!=""} - metricsQuery: sum(sum_over_time_lorc(<<.Series>>{service="arms-k8s-demo",clusterId="cc13c8725******a9839190b7d1695d7",serverIp=~".*",callKind=~"http|rpc|custom_entry|server|consumer|schedule",source="apm",<<.LabelMatchers>>}[1m])) or vector(0) name: as: "${1}_per_second" matches: "^(.*)_count_ign_destid_endpoint_ppid_prpc" resources: namespaced: false seriesQuery: arms_app_requests_count_ign_destid_endpoint_ppid_prpc{service="arms-k8s-demo",clusterId="cc13c8725******a9839190b7d1695d7"} kind: ConfigMap metadata: annotations: meta.helm.sh/release-name: ack-alibaba-cloud-metrics-adapter meta.helm.sh/release-namespace: kube-system creationTimestamp: '2024-04-02T02:29:32Z' labels: app.kubernetes.io/managed-by: Helm managedFields: - apiVersion: v1 fieldsType: FieldsV1 fieldsV1: 'f:data': .: {} 'f:config.yaml': {} 'f:metadata': 'f:annotations': .: {} 'f:meta.helm.sh/release-name': {} 'f:meta.helm.sh/release-namespace': {} 'f:labels': .: {} 'f:app.kubernetes.io/managed-by': {} manager: rc operation: Update time: '2024-04-02T02:40:52Z' name: adapter-config namespace: kube-system resourceVersion: '8223891' uid: 294634e6-aeae-4048-9e69-365a4ce4b2cd
4.4 Verify the metric is available
-
Check that
arms_app_requests_per_secondappears in the External Metrics API:kubectl get --raw "/apis/external.metrics.k8s.io/v1beta1"Look for
"name":"arms_app_requests_per_second"in the output. -
Check that the metric returns real-time data:
kubectl get --raw "/apis/external.metrics.k8s.io/v1beta1/namespaces/arms-demo/arms_app_requests_per_second" | jq .Expected output:
{
  "kind": "ExternalMetricValueList",
  "apiVersion": "external.metrics.k8s.io/v1beta1",
  "metadata": {},
  "items": [
    {
      "metricName": "arms_app_requests_per_second",
      "metricLabels": {},
      "timestamp": "2025-02-13T02:51:31Z",
      "value": "2"
    }
  ]
}
Step 5: Create the HPA
Create hpa.yaml with the following content.
apiVersion: autoscaling/v2
kind: HorizontalPodAutoscaler
metadata:
  name: test-hpa
  namespace: arms-demo
spec:
  scaleTargetRef:
    apiVersion: apps/v1
    kind: Deployment
    name: arms-springboot-demo
  minReplicas: 1
  maxReplicas: 10
  metrics:
    - type: External
      external:
        metric:
          name: arms_app_requests_per_second   # Must match the name generated by adapter-config (name.as field in Step 4.3)
        target:
          type: AverageValue
          averageValue: 40                     # Scale out when QPS exceeds 40; External metrics support Value and AverageValue only
Apply the HPA:
kubectl apply -f hpa.yamlVerify it is picking up metric data:
kubectl get hpa -n arms-demoExpected output:
NAME       REFERENCE                         TARGETS       MINPODS   MAXPODS   REPLICAS   AGE
test-hpa   Deployment/arms-springboot-demo   12/40 (avg)   1         10        1          113s
A non-empty TARGETS value confirms the HPA is reading metric data successfully.
Step 6: Verify elastic scaling with a stress test
Run a stress test against the demo application. Replace 47.94.XX.XX:8080 with the external endpoint of arms-demo-svc.
ab -c 50 -n 2000 http://47.94.XX.XX:8080/demo/queryUser/10While the test runs, watch the HPA:
kubectl get hpa -n arms-demoExpected output after scaling:
NAME       REFERENCE                         TARGETS           MINPODS   MAXPODS   REPLICAS   AGE
test-hpa   Deployment/arms-springboot-demo   47500m/40 (avg)   1         10        10         6m43s
Check the scaling effect from three views:
-
ARMS console: The request volume for the interface spikes sharply during the stress test.
-
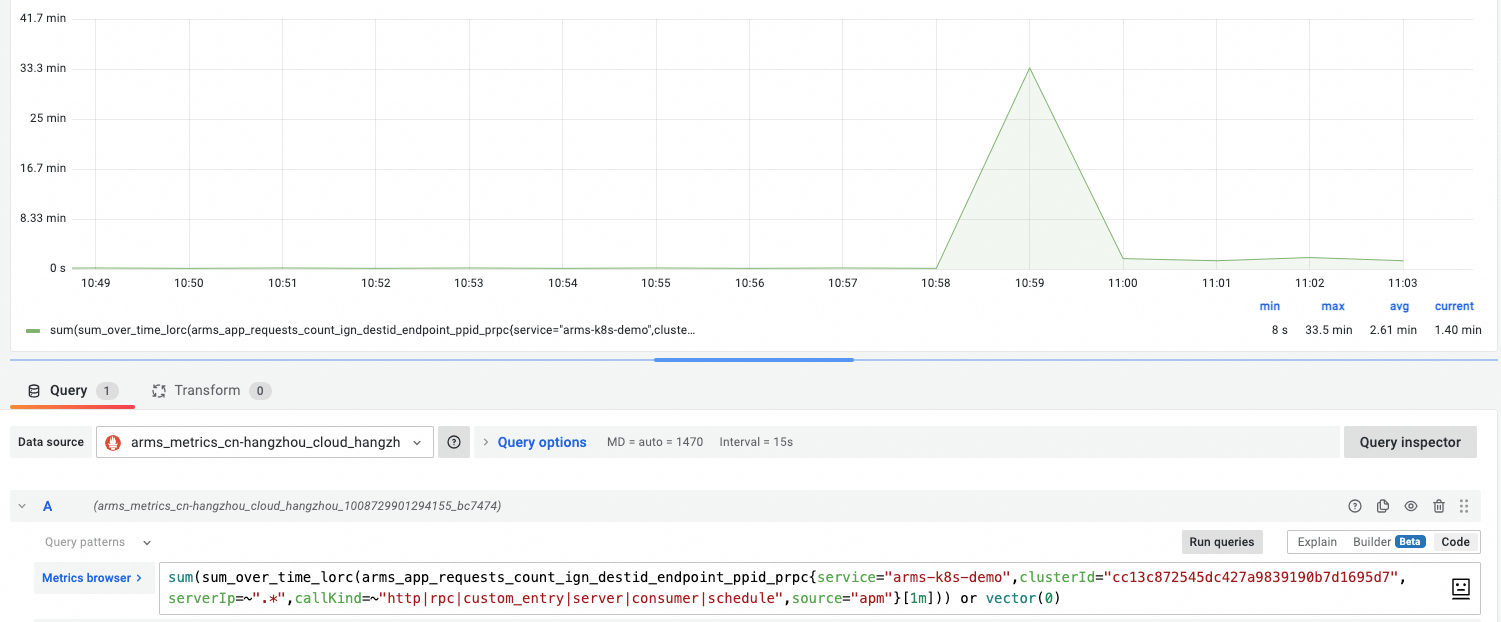
Prometheus dashboard: The HPA triggers scale-out when QPS exceeds the configured threshold.
-
ACK cluster: The pod replica count scales in and out with the QPS of the interface calls.
To view the full scaling event history, run:
kubectl describe hpa test-hpa -n arms-demoAdvanced examples
The following examples show how to configure the metrics adapter for more specific scaling scenarios. All examples use sum_over_time_lorc to aggregate request counts over a 1-minute window.
Scale multiple services independently
Define one rule per service, giving each a unique metric name so the HPA can target them separately.
rules:
- metricsQuery: sum(sum_over_time_lorc(<<.Series>>{service="arms-k8s-demo",clusterId="cc13c8725******a9839190b7d1695d7",serverIp=~".*",callKind=~"http|rpc|custom_entry|server|consumer|schedule",source="apm",<<.LabelMatchers>>}[1m])) or vector(0)
  name:
    as: "${1}_per_second_arms_k8s_demo"
    matches: "^(.*)_count_ign_destid_endpoint_ppid_prpc"
  resources:
    namespaced: false
  seriesQuery: arms_app_requests_count_ign_destid_endpoint_ppid_prpc{service="arms-k8s-demo",clusterId="cc13c8725******a9839190b7d1695d7"}
- metricsQuery: sum(sum_over_time_lorc(<<.Series>>{service="arms-k8s-demo-subcomponent",clusterId="cc13c8725******a9839190b7d1695d7",serverIp=~".*",callKind=~"http|rpc|custom_entry|server|consumer|schedule",source="apm",<<.LabelMatchers>>}[1m])) or vector(0)
  name:
    as: "${1}_per_second_arms_k8s_demo_subcomponent"
    matches: "^(.*)_count_ign_destid_endpoint_ppid_prpc"
  resources:
    namespaced: false
  seriesQuery: arms_app_requests_count_ign_destid_endpoint_ppid_prpc{service="arms-k8s-demo-subcomponent",clusterId="cc13c8725******a9839190b7d1695d7"}
Scale based on a specific RPC endpoint
Add the rpc label to the query to target a single endpoint, rather than all traffic for a service.
rules:
- metricsQuery: sum(sum_over_time_lorc(<<.Series>>{service="arms-k8s-demo",rpc="/demo/queryUser/{id}",clusterId="cc13c8725******a9839190b7d1695d7",serverIp=~".*",callKind=~"http|rpc|custom_entry|server|consumer|schedule",source="apm",<<.LabelMatchers>>}[1m])) or vector(0)
  name:
    as: "${1}_per_second_arms_k8s_demo_queryUser"
    matches: "^(.*)_count_ign_destid_endpoint_ppid_prpc"
  resources:
    namespaced: false
  seriesQuery: arms_app_requests_count_ign_destid_endpoint_ppid_prpc{service="arms-k8s-demo",rpc="/demo/queryUser/{id}",clusterId="cc13c8725******a9839190b7d1695d7"}
- metricsQuery: sum(sum_over_time_lorc(<<.Series>>{service="arms-k8s-demo",rpc="/demo/queryException/{id}",clusterId="cc13c8725******a9839190b7d1695d7",serverIp=~".*",callKind=~"http|rpc|custom_entry|server|consumer|schedule",source="apm",<<.LabelMatchers>>}[1m])) or vector(0)
  name:
    as: "${1}_per_second__arms_k8s_demo_queryException"
    matches: "^(.*)_count_ign_destid_endpoint_ppid_prpc"
  resources:
    namespaced: false
  seriesQuery: arms_app_requests_count_ign_destid_endpoint_ppid_prpc{service="arms-k8s-demo",rpc="/demo/queryException/{id}",clusterId="cc13c8725******a9839190b7d1695d7"}
- metricsQuery: sum(sum_over_time_lorc(<<.Series>>{service="arms-k8s-demo",rpc="/demo/queryNotExistDB/{id}",clusterId="cc13c8725******a9839190b7d1695d7",serverIp=~".*",callKind=~"http|rpc|custom_entry|server|consumer|schedule",source="apm",<<.LabelMatchers>>}[1m])) or vector(0)
  name:
    as: "${1}_per_second__arms_k8s_demo_queryNotExistDB"
    matches: "^(.*)_count_ign_destid_endpoint_ppid_prpc"
  resources:
    namespaced: false
  seriesQuery: arms_app_requests_count_ign_destid_endpoint_ppid_prpc{service="arms-k8s-demo",rpc="/demo/queryNotExistDB/{id}",clusterId="cc13c8725******a9839190b7d1695d7"}
References
-
Application monitoring metric description — full list of ARMS metrics available for use in adapter rules