Resource profiling for container configuration recommendations
ACK offers resource profiling for Kubernetes-native workloads. This feature analyzes historical resource usage data to provide container-level resource specification recommendations, which simplifies the process of configuring container requests and limits. This topic describes how to use the resource profiling feature in the console and on the command line.
Prerequisites and usage notes
-
This feature is only available for ACK Pro clusters that meet the following requirements:
-
The ack-koordinator component (formerly ack-slo-manager) v0.7.1 or later is installed. For more information, see ack-koordinator.
-
The metrics-server component v0.3.8 or later is installed.
-
If a node uses containerd as its container runtime and was added to the cluster before 14:00 on January 19, 2022, you must re-add the node or upgrade the cluster to the latest version. For more information, see Add an existing node and manually upgrade a cluster.
-
-
The resource profiling feature is available for public preview in the Cost Suite and can be used directly.
-
To ensure accurate profiling results, wait at least 24 hours after you enable resource profiling for a workload. This allows the system to collect sufficient data.
Billing
Installing and using the ack-koordinator component is free. However, additional charges may apply in the following scenarios.
-
ack-koordinator is a self-managed component. After installation, it consumes worker node resources. You can configure the resource requests for each module when you install the component.
-
By default, ack-koordinator exposes monitoring metrics for features such as resource profiling and fine-grained scheduling in Prometheus format. If you enable the Enable Prometheus Monitoring for ACK-Koordinator option and use Managed Service for Prometheus, these metrics are reported to Managed Service for Prometheus as basic metrics. If you change the default settings, such as the default retention period, additional charges may apply. For more information, see Billing of Managed Service for Prometheus.
Resource profiling
Kubernetes uses resource requests to describe container resource requirements. When you set a resource request for a container, the scheduler matches the request with the allocatable resources of nodes to schedule the pod to a node. In most cases, resource requests are set based on experience. Administrators review historical utilization, load testing results, and production feedback, and then adjust the values over time.
However, this approach has the following limitations:
-
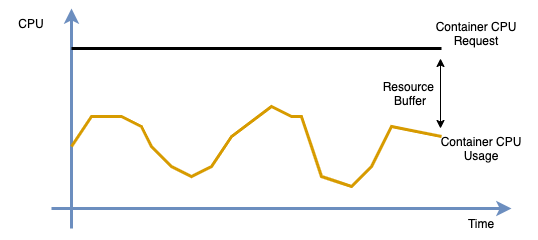
To keep production applications stable, administrators often reserve a large resource buffer to handle traffic fluctuations across upstream and downstream dependencies. As a result, container resource requests are set much higher than actual utilization. This leads to low cluster resource utilization and significant resource waste.
-
When cluster allocation is high, administrators may reduce resource requests to improve cluster utilization and free up more capacity. This increases container density and can affect cluster stability when application traffic increases.
To address these issues, ack-koordinator provides the resource profiling feature. It recommends container-level resource specifications and reduces the complexity of configuring containers. ACK provides this feature in the console, which allows application administrators to quickly assess whether current resource specifications are reasonable and adjust them as needed. You can also use the command line to manage application resource profiles directly through a CRD.
Use resource profiling in the console
Step 1: Install and enable resource profiling
Log on to the ACK console. In the left navigation pane, click Clusters.
On the Clusters page, click the name of your cluster. In the left navigation pane, click .
-
On the Cost Optimization page, click the Resource Profiling tab. In the Resource Profiling section, follow the on-screen instructions to enable the feature.
-
Component installation or upgrade: Follow the on-screen instructions to install or upgrade the ack-koordinator component. If you are using this feature for the first time, you must install the ack-koordinator component.
NoteIf your ack-koordinator component is a version earlier than v0.7.0, you must migrate and upgrade it. For more information, see Migrate ack-koordinator from the application marketplace to the component center.
-
Profiling configuration: After the installation or upgrade, you can select Default Settings to control the profiling scope (recommended). You can also click Profiling Configuration in the console later to adjust the settings.
-
-
Click Enable Resource Profiling to go to the Resource Profiling page.
Step 2: Manage profiling policies
Log on to the ACK console. In the left navigation pane, click Clusters.
On the Clusters page, click the name of your cluster. In the left navigation pane, click .
-
On the Cost Optimization page, click the Resource Profiling tab and then click Profiling Configuration.
You can choose from two configuration modes: Global Configuration and Automated O&M mode. The default mode recommended during component installation is Global Configuration mode. You can modify the mode and parameters here, and then click OK to apply the changes.
Global configuration (recommended)
Global Configuration mode enables resource profiling for all workloads. By default, it excludes the arms-prom and kube-system namespaces.
Parameter
Description
Value range
Excluded Namespace
The namespaces for which resource profiling is disabled, which are typically namespaces for system components. The final profiling scope is the intersection of the specified namespaces and workload types.
Existing namespaces in the current cluster. You can select multiple namespaces. Default value: kube-system and arms-prom.
Workload Type
The workload types for which resource profiling is enabled. The final profiling scope is the intersection of the specified namespaces and workload types.
The supported native Kubernetes workloads are Deployment, StatefulSet, and DaemonSet. You can select multiple workload types.
CPU Redundancy Rate
The safety buffer for generating resource profiling results. For details, see the following description.
A non-negative number. Common options are 70%, 50%, and 30%.
Memory Redundancy Rate
The safety buffer for generating resource profiling results. For details, see the following description.
A non-negative number. Common options are 70%, 50%, and 30%.
Automated O&M configuration
Automated O&M mode enables resource profiling only for workloads in selected namespaces. If your cluster is large (for example, with more than 1,000 nodes), or if you want to try this feature on only a subset of workloads, use this mode to specify the scope as needed.
Parameter
Description
Value range
Namespace
The namespaces for which resource profiling is enabled. The final profiling scope is the intersection of the specified namespaces and workload types.
Existing namespaces in the current cluster. You can select multiple namespaces.
Workload Type
The workload types for which resource profiling is enabled. The final profiling scope is the intersection of the specified namespaces and workload types.
The supported native Kubernetes workloads are Deployment, StatefulSet, and DaemonSet. You can select multiple workload types.
CPU Redundancy Rate
The safety buffer for generating resource profiling results. For details, see the following description.
A non-negative number. Common options are 70%, 50%, and 30%.
Memory Redundancy Rate
The safety buffer for generating resource profiling results. For details, see the following description.
A non-negative number. Common options are 70%, 50%, and 30%.
A resource consumption buffer is the practice of not utilizing 100% of physical resources when administrators assess application capacity, such as Queries Per Second (QPS). This is because of both the limitations of physical resources, such as hyper-threading, and the need for applications to reserve resources to handle load requests during peak periods. If the gap between the profiled value and the original resource request exceeds the safety buffer, a downgrade recommendation is provided. For details on the algorithm, see the description of profiling recommendations in the Application Profiling Overview topic.
Step 3: View the profiling overview
After you configure the resource profiling policy, you can view the resource profiling results for each workload on the Resource Profiling page.
To improve accuracy, the system prompts you to collect at least 24 hours of data when you use this feature for the first time.
The following table describes the columns in the profiling overview.
In the following table, a hyphen (-) indicates that the field is not applicable.
|
Column |
Description |
Values |
Filterable |
|
Workload name |
The name of the workload. |
- |
Yes. You can perform an exact search by name at the top of the page. |
|
Namespace |
The namespace of the workload. |
- |
Yes. By default, the kube-system namespace is excluded from the filter conditions. |
|
Workload type |
The type of the workload. |
Deployment, DaemonSet, and StatefulSet. |
Yes. The default filter is All. |
|
Cpu request |
The CPU resource request of the workload pods. |
- |
No. |
|
Memory request |
The memory resource request of the workload pods. |
- |
No. |
|
Profile data status |
The resource profiling status for the workload. |
|
No. |
|
Cpu profile, memory profile |
A recommendation based on the profiled value, original resource request, and configured resource consumption buffer. |
Includes Upgrade, Downgrade, and Keep. The percentage indicates the deviation magnitude, which is calculated by using the following formula: |
Yes. The default filter conditions are Upgrade and Downgrade. |
|
Creation time |
The time when the profiling result was created. |
- |
No. |
|
Change Resource Configuration |
After you evaluate the profiling results and recommendations, click Change Resource Configuration to upgrade or downgrade resources. For more information, see Step 5: Apply recommended resource specifications. |
- |
No. |
ACK resource profiling generates a profiled value for the resource specification of each container in a workload. By comparing the profiled value (Recommend), the original resource request (Request), and the resource consumption buffer (Buffer) configured in the profiling policy, the console provides Upgrade or Downgrade recommendations for the resource request. If a workload has multiple containers, the console highlights the container with the largest deviation. The calculation logic is as follows.
-
If the profiled value (Recommend) is greater than the original resource request (Request), the container has been overusing resources for an extended period (usage exceeds request). This poses a stability risk. You should increase the resource specification in a timely manner. The console shows an "Upgrade" recommendation.
-
If the profiled value (Recommend) is less than the original resource request (Request), the container may be wasting resources and you can reduce the resource specification. This decision must take into account the configured resource consumption buffer.
-
Calculate the target resource specification (Target) based on the profiled value and the configured resource consumption buffer (Buffer):
Target = Recommend * (1 + Buffer). -
Calculate the deviation (Degree) of the original resource request (Request) from the target resource specification (Target):
Degree = 1 - (Request / Target). -
Based on the profiled value and the deviation level (Degree), the console generates a recommendation for CPU and memory. If the absolute value of the deviation (Degree) is greater than 0.1, the console shows a "Downgrade" recommendation.
-
-
In all other cases, the recommendation is to Maintain the current resource specification, which indicates that no adjustment is required.
Step 4: View application profile details
On the Resource Profiling page, click a workload name to open its profile details page.
The details page has three parts: basic workload information, resource profile curves for each container, and a window for changing the application's resource specifications.
As shown in the preceding figure, the following table describes the metrics in the resource curve, using CPU as an example.
|
Curve name |
Description |
|
cpu limit |
The CPU resource limit of the container. |
|
cpu request |
The CPU resource request of the container. |
|
cpu recommend |
The profiled CPU value for the container. |
|
cpu usage (average) |
The average CPU usage across all container replicas in the workload. |
|
cpu usage (max) |
The maximum CPU usage among all container replicas in the workload. |
Step 5: Apply recommended resource specifications
You can use the configured safety buffer as a reference for the target resource requirement. For example, you can add a buffer factor on top of the profiled value, such as 4.742 * 1.3 ≈ 6.2.
The following table describes the parameters.
|
Parameter |
Description |
|
Current resource request |
The current resource request of the container. |
|
Current resource limit |
The current resource limit of the container. |
|
Profiled value |
The profiled value generated for the container, which can be used as a reference for the resource request. |
|
Safety buffer |
The safety buffer configured in the profiling policy, which can be used as a reference for the target resource requirement. For example, you can add a buffer factor on top of the profiled value, such as 4.742 * 1.3 ≈ 6.2. |
|
New Resource Request |
The target value for the container resource request. |
|
New Resource Limit |
The target value for the container resource limit. Note: If the workload uses CPU topology-aware scheduling, the CPU resource limit must be an integer. |
After you complete the configuration, click Submit. The system updates the resource specifications and automatically redirects you to the workload details page.
After the resource specifications are updated, the controller performs a rolling update of the workload and recreates its pods.
Use resource profiling from the command line
Step 1: Enable resource profiling
-
Create a file named
recommendation-profile.yamlwith the following YAML content to enable resource profiling for a workload.A RecommendationProfile CRD enables resource profiling for a workload and provides resource specification data for its containers. You can control the profiling scope by specifying namespaces and workload types. The final scope is the intersection of the two.
apiVersion: autoscaling.alibabacloud.com/v1alpha1
kind: RecommendationProfile
metadata:
  # The object name. A namespace is not required for this cluster-scoped object.
  name: profile-demo
spec:
  # The workload types for which to enable resource profiling.
  controllerKind:
  - Deployment
  # The namespaces for which to enable resource profiling.
  enabledNamespaces:
  - default
The following table describes the configuration fields.
Parameter
Type
Description
metadata.nameString
The name of the object. A namespace is not required because RecommendationProfile is a cluster-scoped (non-namespaced) object.
spec.controllerKindString
The workload types for which resource profiling is enabled. Supported workload types include Deployment, StatefulSet, and DaemonSet.
spec.enabledNamespacesString
The namespaces for which resource profiling is enabled.
-
Apply the profile configuration.
kubectl apply -f recommendation-profile.yaml -
Create a file named
cpu-load-gen.yamlwith the following content.apiVersion: apps/v1 kind: Deployment metadata: name: cpu-load-gen labels: app: cpu-load-gen spec: replicas: 2 selector: matchLabels: app: cpu-load-gen-selector template: metadata: labels: app: cpu-load-gen-selector spec: containers: - name: cpu-load-gen image: registry.cn-zhangjiakou.aliyuncs.com/acs/slo-test-cpu-load-gen:v0.1 command: ["cpu_load_gen.sh"] imagePullPolicy: Always resources: requests: cpu: 8 # The CPU request for this application is 8 cores. memory: "1Gi" limits: cpu: 12 memory: "2Gi" -
Deploy the cpu-load-gen application.
kubectl apply -f cpu-load-gen.yaml -
Get the resource profiling results.
kubectl get recommendations -l \
  "alpha.alibabacloud.com/recommendation-workload-apiVersion=apps-v1, \
  alpha.alibabacloud.com/recommendation-workload-kind=Deployment, \
  alpha.alibabacloud.com/recommendation-workload-name=cpu-load-gen" -o yaml
ack-koordinator generates a resource profile for each profiled workload and stores the results in a Recommendation CRD. The following is a sample resource profile for the
cpu-load-genworkload.apiVersion: autoscaling.alibabacloud.com/v1alpha1 kind: Recommendation metadata: labels: alpha.alibabacloud.com/recommendation-workload-apiVersion: apps-v1 alpha.alibabacloud.com/recommendation-workload-kind: Deployment alpha.alibabacloud.com/recommendation-workload-name: cpu-load-gen name: f20ac0b3-dc7f-4f47-b3d9-bd91f906**** namespace: recommender-demo spec: workloadRef: apiVersion: apps/v1 kind: Deployment name: cpu-load-gen status: recommendResources: containerRecommendations: - containerName: cpu-load-gen target: cpu: 4742m memory: 262144k originalTarget: # Intermediate result of the resource profiling algorithm. Do not use directly. # ...To simplify retrieval, the Recommendation object is created in the same namespace as the workload. It also includes labels that specify the API version, kind, and name of the workload, as described in the following table.
Label key
Description
Example
alpha.alibabacloud.com/recommendation-workload-apiVersionThe API version of the workload. The forward slash (/) is replaced with a hyphen (-) to comply with Kubernetes label syntax.
apps-v1 (from apps/v1)
alpha.alibabacloud.com/recommendation-workload-kindThe type of the workload, such as Deployment or StatefulSet.
Deployment
alpha.alibabacloud.com/recommendation-workload-nameThe name of the workload. It must be no more than 63 characters long to comply with Kubernetes label syntax.
cpu-load-gen
The resource profiling results for each container are stored in
status.recommendResources.containerRecommendations. The following table describes the fields.Field
Description
Format
Example
containerNameThe name of the container.
string
cpu-load-gen
targetThe profiled resource specifications, including CPU and memory.
map[ResourceName]resource.Quantity
cpu: 4742m
memory: 262144k
originalTargetAn intermediate result from the profiling algorithm. Do not use this field directly.
-
-
NoteThe minimum profiled CPU value per pod is 0.025 cores, and the minimum memory value is 250 MB.
By comparing the declared resource specifications in the
cpu-load-genapplication with the profiling results, you can see that the CPU request is over-provisioned. You can reduce the request to save cluster resources.Category
Original specification
Profiled specification
CPU
8 cores
4.742 cores
Step 2: (Optional) View the results in Prometheus
The ack-koordinator component provides a Prometheus query interface for resource profiling results. You can view these results directly by using the Prometheus Monitoring feature in ACK.
-
If you are using this dashboard for the first time, make sure the Resource Profile dashboard is updated to the latest version. For upgrade steps, see Related operations.
To view the resource profiling results in the ACK console by using Prometheus Monitoring, follow these steps:
Log on to the ACK console. In the left navigation pane, click Clusters.
On the Clusters page, click the name of your cluster. In the left navigation pane, click .
-
On the Prometheus Monitoring page, choose .
On the Resource Profile tab, view detailed data, including container specifications (Request), actual container resource usage (Usage), and profiled container resource specifications (Recommend). For more information, see Connect to and configure Managed Service for Prometheus.
-
If you have a self-managed Prometheus instance, configure your dashboard based on the following metrics.
# Profiled CPU resource specification for a container in the workload. koord_manager_recommender_recommendation_workload_target{exported_namespace="$namespace", workload_name="$workload", container_name="$container", resource="cpu"} # Profiled memory resource specification for a container in the workload. koord_manager_recommender_recommendation_workload_target{exported_namespace="$namespace", workload_name="$workload", container_name="$container", resource="memory"}ImportantThe resource profiling metric provided by the ack-koordinator component was renamed to
koord_manager_recommender_recommendation_workload_targetin v1.5.0-ack1.14. However, the metricslo_manager_recommender_recommendation_workload_targetfrom earlier versions is still compatible. If you have a self-managed Prometheus instance, switch tokoord_manager_recommender_recommendation_workload_targetafter you upgrade the ack-koordinator component to v1.5.0-ack1.14 or later.
FAQ
Resource profiling algorithm
The resource profiling algorithm uses a multi-dimensional data model that works as follows:
-
It continuously collects container resource usage data and calculates aggregate statistics, such as peak values, weighted averages, and percentiles for CPU and memory usage.
-
The final recommendation sets the recommended CPU value to the P95 percentile and the recommended memory value to the P99 percentile. The algorithm adds a safety margin to both to ensure workload reliability.
-
The algorithm is optimized for timeliness and considers only data from the most recent 14 days. It uses a half-life sliding window model for aggregation, where the weight of older data points gradually decreases.
-
The algorithm considers container runtime events, such as out-of-memory (OOM) kills, to improve the accuracy of the profiled values.
Suitable application types
Resource profiling is best suited for online service applications.
Currently, the profiling results prioritize ensuring a container has sufficient resources to cover the vast majority of its usage samples. However, this approach can be conservative for certain application types. For offline applications, such as batch processing tasks that prioritize overall throughput and can tolerate some resource contention to improve cluster utilization, the profiling results may appear too conservative. In addition, for critical system components deployed in an active-passive configuration, the passive replicas are idle for long periods, and their low resource usage can interfere with the profiling algorithm. For these scenarios, review and adjust the profiling results as needed before you apply them. We recommend staying up-to-date with product updates for resource profiling.
Use profiled values for requests and limits
This depends on your specific workload. The profiled values provide a summary of your application's current resource demand. You should use them as a baseline and adjust them based on your application's characteristics and business requirements.
For example, for applications that need to handle traffic spikes or require seamless failover in an active-active architecture, you must add a resource buffer. For resource-sensitive applications that do not perform well on hosts with high load, you should also increase the resource allocation beyond the profiled value.
View metrics in self-managed Prometheus
The ack-koord-manager module of the ack-koordinator component exposes resource profiling metrics as a Prometheus-formatted HTTP endpoint. You can get the pod IP address and access the metrics data.
-
Get the pod IP address.
kubectl get pod -A -o wide | grep koord-managerExpected output:
kube-system ack-koord-manager-b86bd47d9-92f6m 1/1 Running 0 16h 10.10.0.xxx cn-hangzhou.10.10.0.xxx <none> <none> kube-system ack-koord-manager-b86bd47d9-vg5z7 1/1 Running 0 16h 10.10.0.xxx cn-hangzhou.10.10.0.xxx <none> <none> -
Run the following command to view the metrics data (note that ack-koord-manager runs in a dual-replica active-passive mode and data is available only on the primary replica Pod). For the port
port(default: 9326), refer to the ack-koord-manager Deployment configuration.Ensure that the server on which you run the command can communicate with the cluster's container network.
curl -s http://10.10.0.xxx:9326/all-metrics | grep slo_manager_recommender_recommendation_workload_target
# If you use an ack-koordinator version earlier than v1.5.0-ack1.12, run the following command to view the metrics data.
curl -s http://10.10.0.xxx:9326/metrics | grep slo_manager_recommender_recommendation_workload_target
Expected output:
# HELP slo_manager_recommender_recommendation_workload_target Recommendation of workload resource request.
# TYPE slo_manager_recommender_recommendation_workload_target gauge
slo_manager_recommender_recommendation_workload_target{container_name="xxx",namespace="xxx",recommendation_name="d2169dbf-fb36-4bf4-99d1-673577fb85c1",resource="cpu",workload_api_version="apps/v1",workload_kind="Deployment",workload_name="xxx"} 0.025
slo_manager_recommender_recommendation_workload_target{container_name="xxx",namespace="xxx",recommendation_name="d2169dbf-fb36-4bf4-99d1-673577fb85c1",resource="memory",workload_api_version="apps/v1",workload_kind="Deployment",workload_name="xxx"} 2.62144e+08
After the ack-koordinator component is installed, it automatically creates Service and ServiceMonitor objects that are associated with the corresponding pods. If you use Managed Service for Prometheus, the service automatically collects and displays these metrics on the corresponding Grafana dashboard.
Prometheus supports multiple collection methods. If you use a self-managed Prometheus instance, refer to the official Prometheus documentation for configuration and use the process described above for debugging. After debugging, you can refer to Step 2: (Optional) View the results in Prometheus to configure a Grafana dashboard in your environment.
Delete profiling results and rules
Recommendation CRDs store profiling results, and RecommendationProfile CRDs store profiling rules. Run the following commands to delete all results and rules.
# Delete all profiling results.
kubectl delete recommendation -A --all
# Delete all profiling rules.
kubectl delete recommendationprofile -A --all
Grant permissions to RAM users
ACK authorization has two layers: RAM authorization for basic resource access and RBAC (Role-Based Access Control) for permissions within the cluster. For an overview, see Authorization best practices. To grant a RAM user permissions to use resource profiling, you must configure permissions at both levels:
-
RAM authorization
Log on to the RAM console with your Alibaba Cloud account and grant the AliyunCSFullAccess built-in system policy to the RAM user. For detailed instructions, see Grant permissions.
-
RBAC authorization
After completing RAM authorization, grant the RAM user the
developerrole or higher in the target cluster. For instructions, see Use RBAC to authorize operations on cluster resources.
The predefined developer role grants read and write access to all Kubernetes resources in the cluster. For more granular control, you can create or edit a custom ClusterRole by following the instructions in Use custom RBAC roles to restrict resource operations in a cluster. The resource profiling feature requires adding the following rules to the ClusterRole:
apiVersion: rbac.authorization.k8s.io/v1
kind: ClusterRole
metadata:
  name: recommendation-clusterrole
rules:
- apiGroups:
  - "autoscaling.alibabacloud.com"
  resources:
  - "*"
  verbs:
  - "*"