Container Service for Kubernetes (ACK) provides the Network Diagnosis feature to help you troubleshoot common network issues, such as failed connections between pods, from a cluster to the public internet, or from the public internet to a LoadBalancer Service. This topic describes how Network Diagnosis works and how to use it to resolve common connectivity problems.
When you use the diagnostics feature, the system runs a data collection agent on your cluster nodes to gather diagnostic results. The collected information includes the system version, load, the status of Docker and Kubelet, and key error messages from system logs. The data collection agent does not collect your business information or sensitive data.
Prerequisites
An ACK managed cluster is created.
Network diagnosis
The ACK console provides the Network Diagnosis feature, which lets you quickly diagnose common network issues by providing the source address, destination address, destination port, and protocol. You can use this feature without deep expertise in complex container network architectures, network plug-in internals, or kernel-level operations.
The Network Diagnosis feature is based on the open-source project KubeSkoop. KubeSkoop provides one-click diagnostics for common Kubernetes cluster network issues across various network plug-ins and IaaS providers, and uses eBPF for deep monitoring and analysis of critical kernel paths. This topic covers only the Network Diagnosis feature. For details about deep monitoring and analysis, see Use KubeSkoop to Troubleshoot Network Issues.
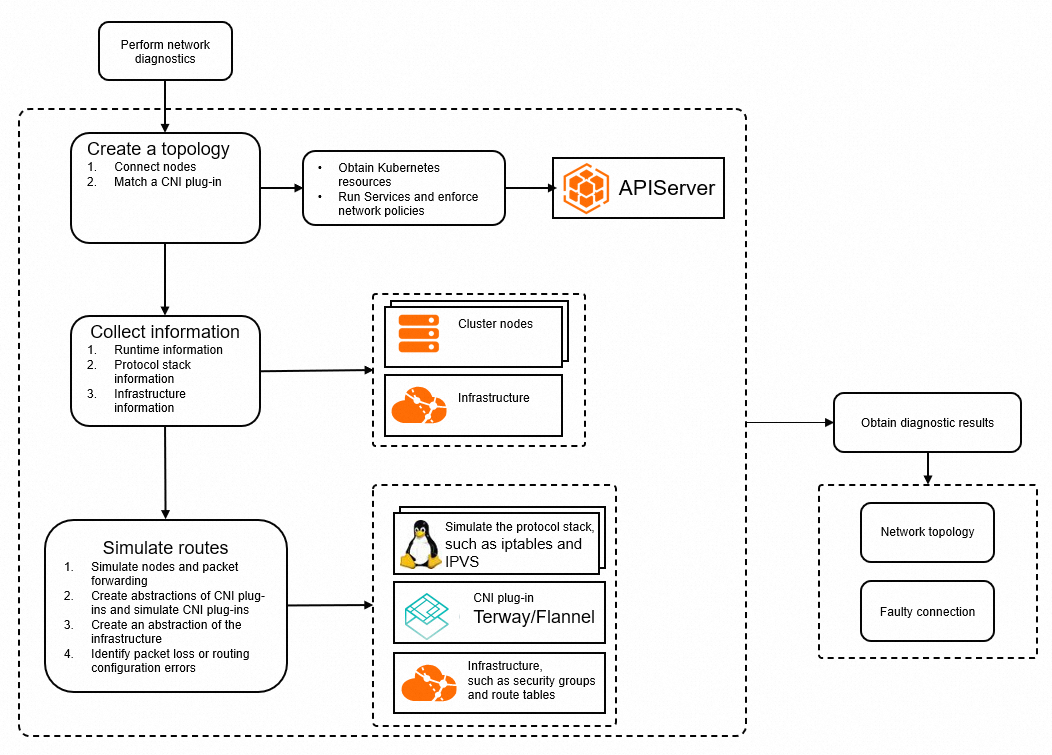
How it works
-
Topology construction: After you provide the diagnostic information, Network Diagnosis builds an access topology for the diagnosis based on the provided details and resource information collected from the cluster, such as pods, nodes, Services, and NetworkPolicies.
-
Information collection: Network Diagnosis collects runtime information, network stack data, and details about the network infrastructure. This data is used for troubleshooting and network analysis.
-
Path simulation: Network Diagnosis collects network stack information from the relevant nodes or containers by running commands on Elastic Compute Service (ECS) instances or by deploying collector pods in the cluster. This information includes details on network devices, sysctl parameters, iptables, and IPVS. The tool also collects cloud infrastructure information, such as route tables, security groups, and NAT gateways. The system then compares this collected information against expected configurations to identify misconfigurations. This process includes simulating iptables and routing rules, checking device statuses, and validating cloud route tables and security group rules.
-
Diagnostic Results: After comparing the actual configuration with the expected state, the tool outputs a network topology and highlights any abnormal nodes and issues.
Use Network Diagnosis
Limitations
-
The pod to be diagnosed must be in the Running state.
-
Connections from the public internet to a LoadBalancer Service are supported only for Layer 4 Classic Load Balancer (CLB) instances with 10 or fewer backend pods.
-
Diagnosis is not currently supported for ACK Serverless clusters or virtual nodes.
Procedure
-
Log on to the ACK console. In the navigation pane on the left, click Clusters.
-
On the Clusters page, click the name of your target cluster. In the navigation pane on the left, choose .
-
On the Diagnostics page, click the Network diagnostics tab, and then click Diagnose in the upper-left corner.
-
In the Access Information panel, enter the Source IP Address, Target Address, and Port, and select the Protocol. Read the notice, select I understand and agree, and then click Diagnose.
For information about the diagnosis parameters, see Diagnosis parameters.
-
On the Diagnosis Result page, you can view the results. The Full access path section displays an end-to-end view of the diagnosed connection path.
Abnormal nodes are highlighted in a different color. For information about common diagnostic results, see Common diagnostic results and solutions.
The diagnosis results are displayed in a table with three columns: Level (such as FATAL), Node, and Diagnosis result. This helps you quickly locate abnormal nodes and specific routing errors. If the results do not resolve your issue, click the Submit Ticket or Feedback link on the page for more help.
Diagnosis parameters
Scenario 1: Pod-to-pod and pod-to-node
If you encounter connectivity issues between pods, or between pods and nodes, you can use Network Diagnosis to troubleshoot the connection. The following table describes the parameters.
|
Parameter |
Description |
|
Source address |
IP address of a pod or node. |
|
Target address |
IP address of a pod or node. |
|
Port |
The port to diagnose. |
|
Protocol |
The protocol to diagnose. |
Scenario 2: Pod and node to Service
You can diagnose connectivity to a Service by using its cluster IP as the destination. The tool checks the network path from a pod or node to each endpoint of the Service and verifies the related network configurations. The following table describes the parameters.
|
Parameter |
Description |
|
Source address |
IP address of a pod or node. |
|
Target address |
Cluster IP of the Service. |
|
Port |
The port to diagnose. |
|
Protocol |
The protocol to diagnose. |
Scenario 3: DNS path
When the destination is a domain name, you may need to check if the in-cluster DNS is working correctly, in addition to checking the path from the source to the destination IP. Use Network Diagnosis to check the connectivity from a pod to the cluster's DNS service (the kube-dns Service in the kube-system namespace) to identify potential DNS resolution issues.
Run the following command to get the cluster IP of the kube-dns Service in the kube-system namespace:
kubectl get svc -n kube-system kube-dnsExample output:
NAME TYPE CLUSTER-IP EXTERNAL-IP <none> 53/UDP,53/TCP,9153/TCP 6dIn the output, 172.16.XX.XX is the cluster IP of the kube-dns Service. Use this IP as the destination address. The following table describes the parameters.
|
Parameter |
Description |
|
Source address |
IP address of a pod or node. |
|
Target address |
Cluster IP of the kube-dns Service. |
|
Port |
53 |
|
Protocol |
udp |
Scenario 4: Pod and node to internet
You can use Network Diagnosis to check the connection from a pod or node to a public IP address. If the destination is a domain name, you must first manually resolve it to its public IP address. The following table describes the parameters.
|
Parameter |
Description |
|
Source address |
IP address of a pod or node. |
|
Target address |
Public IP address. |
|
Port |
The port to diagnose. |
|
Protocol |
The protocol to diagnose. |
Scenario 5: Internet to LoadBalancer Service
If you cannot access a LoadBalancer Service from the public internet, you can diagnose the connection by using a public IP as the source and the external IP of the LoadBalancer Service as the destination. The following table describes the parameters.
|
Parameter |
Description |
|
Source address |
Public IP address. |
|
Target address |
External IP address of the LoadBalancer Service. |
|
Port |
The port to diagnose. |
|
Protocol |
The protocol to diagnose. |
Common diagnostic results and solutions
|
Diagnostic result |
Description |
Solution |
|
pod container ... is not ready |
The container in the pod is not ready. |
Check the health status of the pod and fix the issue. |
|
NetworkPolicy ... deny the packet from ... |
A NetworkPolicy is blocking the packet. |
Modify the corresponding NetworkPolicy rules. |
|
no process listening on ... |
No process on the container or node is listening on the specified port with the specified protocol. |
Verify that the target process is running correctly. Check the diagnosis parameters, including the port and protocol. |
|
no route to host .../invalid route ... for packet ... |
No route to the host was found, or an existing route points to an incorrect destination. |
Check if the network plug-in is working correctly. |
|
... do not have same security group |
The security groups of the two ECS instances do not have rules that allow traffic between them, which can cause packet loss. |
Configure the ECS instances to use the same security group. |
|
security group ... not allow packet ... |
The security group on the ECS instance is blocking the packet. |
Check the security group rules and allow traffic from the required address. |
|
The cloud route table does not contain a route to the destination IP address. |
Check the cloud route table configuration. If the destination is a public IP address, check the public NAT gateway configuration. |
|
The route in the cloud route table does not point to the expected next hop. |
Check the cloud route table configuration. If the destination is a public IP address, check the public NAT gateway configuration. |
|
no snat entry on nat gateway ... |
The specified SNAT entry is not found on the public NAT gateway. |
Check the SNAT rule configuration in the public NAT gateway. |
|
backend ... health status for port ..., not "normal" |
A backend server of the CLB instance failed its health check. |
Verify that the correct endpoints are attached to the CLB instance and that the backend services on those endpoints are healthy. |
|
cannot find listener port ... for slb ... |
The specified listener port is not found on the CLB instance. |
Check the LoadBalancer Service configuration and verify that the diagnosis parameters, including the port and protocol, are correct. |
|
status of loadbalancer for ... port ... not "running" |
The listener on the CLB instance is not in the Running state. |
Check the status of the listener on the CLB instance. |
|
Service ... has no valid endpoint |
The Service has no valid endpoints. |
Check if the Service label selector is configured as expected and verify that the corresponding endpoints exist and are healthy. For issues related to accessing a LoadBalancer Service IP from within the cluster, see Access to CLB instances from within a cluster fails. |