When message backlog builds up in ApsaraMQ for RocketMQ, consumer pods can fall behind, increasing system load and risking service disruption. Use Kubernetes Event-Driven Autoscaling (KEDA) to automatically scale consumer pods based on real-time message backlog metrics, so capacity tracks demand without manual intervention.
How it works
KEDA scales consumer pods in two distinct phases:
-
Activation phase (0 to 1 replica): KEDA monitors message backlog metrics directly. When backlog exceeds the activation threshold, KEDA scales the Deployment from zero to one replica.
-
Scaling phase (1 to N replicas): Once at least one replica is running, the Kubernetes Horizontal Pod Autoscaler (HPA) takes over and adjusts replica count based on metrics that KEDA exposes. This is why
kubectl get hpashows a KEDA-managed HPA resource after you apply a ScaledObject.
For ApsaraMQ for RocketMQ, KEDA uses Managed Service for Prometheus as the metric source. The threshold in a ScaledObject represents the target message backlog per replica. For example, if each consumer pod can process 30 messages, set threshold: '30'. With 90 messages accumulated, KEDA scales to 3 replicas.
If you use open-source Apache RocketMQ, you can enable horizontal pod autoscaling based on metrics collected by the Java Management Extensions (JMX) Prometheus exporter. For more information, see Apache RocketMQ.
Prerequisites
Before you begin, ensure that you have:
-
The ack-keda component deployed. For more information, see Event-driven autoscaling.
-
An ApsaraMQ for RocketMQ 5.x instance created. For more information, see Create an instance.
Serverless ApsaraMQ for RocketMQ 5.x instances support rapid resource scaling based on business workloads, with computing fees billed according to actual usage. For more information, see Overview of Serverless ApsaraMQ for RocketMQ 5.x instances.
-
Aliyun RocketMQ (5.0) Service integrated in the ARMS console.
-
The Go runtime environment configured.
Step 1: Deploy an application
This step creates an NGINX Deployment named sample-app as the scaling target.
-
Log on to the ACK console. In the left-side navigation pane, click Clusters.
-
On the Clusters page, click the name of the cluster you want to manage. In the left-side pane, choose Workloads > Deployments.
-
On the Deployments page, click Create from YAML. On the Create page, set Sample Template to Custom, and apply the following YAML:
apiVersion: apps/v1
kind: Deployment
metadata:
  name: sample-app
  namespace: default
  labels:
    app: sample-app
spec:
  replicas: 1
  selector:
    matchLabels:
      app: sample-app
  template:
    metadata:
      labels:
        app: sample-app
    spec:
      containers:
      - name: sample-app
        # Replace with your actual RocketMQ consumer container image.
        image: alibaba-cloud-linux-3-registry.cn-hangzhou.cr.aliyuncs.com/alinux3/nginx_optimized:20240221-1.20.1-2.3.0
        resources:
          limits:
            cpu: "500m"
Step 2: Configure scaling policies through ScaledObject
A ScaledObject defines the scaling target, replica bounds, and the Prometheus query that drives scaling decisions. Before creating the ScaledObject, collect the Prometheus endpoint and instance details from the ApsaraMQ for RocketMQ console and the ARMS console.
Collect instance information from the ApsaraMQ for RocketMQ console
-
Log on to the ApsaraMQ for RocketMQ console. In the left-side navigation pane, click Instances.
-
In the top navigation bar, select a region, such as China (Hangzhou). On the Instances page, click the name of the instance you want to manage.
-
In the left-side navigation pane, click Topics. Record the topic Name and the Instance ID shown in the upper-right corner—for example,
kedaandmq-cn-uax33****.
Get the Prometheus endpoint for the ApsaraMQ for RocketMQ instance
-
Log on to the ARMS console.
-
In the left-side navigation pane, choose Managed Service for Prometheus > Instances.
-
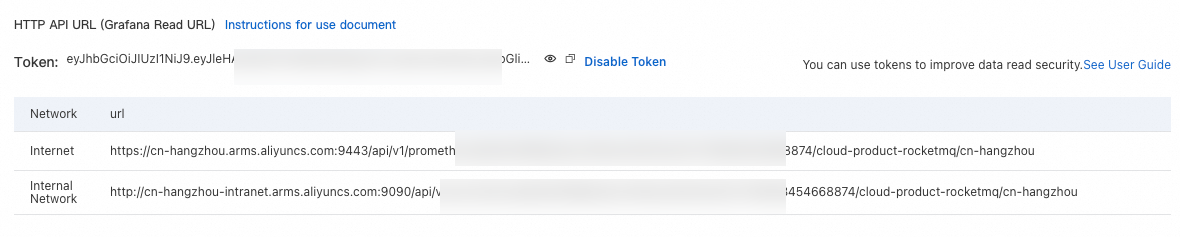
Find the instance named Cloud Services-{{RegionId}} and click its name. In the left-side pane, click Settings, and copy the endpoint from the HTTP API URL (Grafana Read URL) section.

Create the ScaledObject
-
Create a file named
ScaledObject.yamlwith the following content:Parameter Description scaleTargetRef.nameThe Deployment to scale. In this example, sample-app(created in Step 1).maxReplicaCountThe maximum number of replicas allowed during scale out. minReplicaCountThe minimum number of replicas maintained during scale in. serverAddressThe Prometheus endpoint that stores ApsaraMQ for RocketMQ metrics. Use the endpoint copied from HTTP API URL (Grafana Read URL) in the previous step. metricNameThe PromQL metric name used as the scaling signal. queryThe PromQL query that aggregates message backlog across the specified instance and topic, grouped by consumer group. thresholdThe target message backlog per replica (AverageValue). KEDA scales the Deployment so that each replica handles no more than this number of messages on average. To set this value, estimate the number of messages a single consumer pod can process, then use that as the threshold. apiVersion: keda.sh/v1alpha1 kind: ScaledObject metadata: name: prometheus-scaledobject namespace: default spec: scaleTargetRef: name: sample-app # Required. The Deployment to scale. maxReplicaCount: 10 # Required. Maximum replicas during scale out. minReplicaCount: 2 # Required. Minimum replicas during scale in. triggers: - type: prometheus metadata: # Required fields: serverAddress: http://cn-beijing.arms.aliyuncs.com:9090/api/v1/prometheus/8cba801fff65546a3012e9a684****/****538168824185/cloud-product-rocketmq/cn-beijing # Replace serverAddress with the endpoint copied from the ARMS console. metricName: rocketmq_consumer_inflight_messages query: sum({__name__=~"rocketmq_consumer_ready_messages|rocketmq_consumer_inflight_messages",instance_id="rmq-cn-uax3xxxxxx",topic=~"keda"}) by (consumer_group) # Replace instance_id and topic with your actual instance ID and topic name. threshold: '30' # Target message backlog per replica (AverageValue). # Example: if one pod handles 30 messages, # 90 accumulated messages scales to 3 replicas.The following table describes the key parameters:
-
Apply the ScaledObject and verify the created resources:
# Apply the scaling configuration.
kubectl apply -f ScaledObject.yaml

# Verify the ScaledObject is ready.
kubectl get ScaledObject
Expected output:
NAME                      SCALETARGETKIND      SCALETARGETNAME   MIN   MAX   TRIGGERS     AUTHENTICATION   READY   ACTIVE   FALLBACK   AGE
prometheus-scaledobject   apps/v1.Deployment   sample-app        2     10    prometheus                    True    False    False      105s
KEDA automatically creates an HPA for the Deployment. Confirm it exists:
kubectl get hpaExpected output:
NAME REFERENCE TARGETS MINPODS MAXPODS REPLICAS AGE keda-hpa-prometheus-scaledobject Deployment/sample-app 0/30 (avg) 2 10 2 28m -
(Optional) To secure read access to Prometheus, configure token-based authentication. Expand to view detailed steps
-
Generate a Prometheus token as prompted on the page.
-
Create a Secret with Base64-encoded values for the
customAuthHeaderandcustomAuthValuefields:apiVersion: v1 kind: Secret metadata: name: keda-prom-secret namespace: default data: customAuthHeader: "QXV0Xxxxxxxlvbg==" customAuthValue: "kR2tpT2lJeFpXSmxaVFV6WlMTxxxxxxxxRMVFE0TUdRdE9USXpaQzFqWkRZd09EZ3dOVFV5WWpZaWZRLjlDaFBYU0Q2dEhWc1dQaFlyMGh3ZU5FQjZQZWVETXFjTlYydVNqOU82TTQ=" -
Create a TriggerAuthentication resource that references the Secret:
apiVersion: keda.sh/v1alpha1 kind: TriggerAuthentication metadata: name: keda-prom-creds namespace: default spec: secretTargetRef: - parameter: customAuthHeader name: keda-prom-secret key: customAuthHeader - parameter: customAuthValue name: keda-prom-secret key: customAuthValue -
Update the ScaledObject to reference the TriggerAuthentication:
apiVersion: keda.sh/v1alpha1
kind: ScaledObject
metadata:
  name: prometheus-scaledobject
  namespace: default
spec:
  scaleTargetRef:
    name: sample-app
  maxReplicaCount: 10
  minReplicaCount: 2
  triggers:
  - type: prometheus
    metadata:
      serverAddress: http://cn-beijing.arms.aliyuncs.com:9090/api/v1/prometheus/8cba801fff65546a3012e9a684****/****538168824185/cloud-product-rocketmq/cn-beijing
      metricName: rocketmq_consumer_inflight_messages
      query: sum({__name__=~"rocketmq_consumer_ready_messages|rocketmq_consumer_inflight_messages",instance_id="rmq-cn-uax3xxxxxx",topic=~"keda"}) by (consumer_group)
      threshold: '30'
      authModes: "custom"
    authenticationRef:
      name: keda-prom-creds   # References the TriggerAuthentication created above.
Note: This example uses custom authentication. For other authentication methods supported by the Prometheus scaler, see the KEDA community documentation.
-
Step 3: Produce and consume data
Use the rocketmq-keda-sample project to produce and consume messages. In the project code, specify the endpoint, username, and password of the ApsaraMQ for RocketMQ instance obtained in Step 2.
Step 4: Verify autoscaling behavior
-
Log on to the ApsaraMQ for RocketMQ console. In the left-side navigation pane, click Instances.
-
In the top navigation bar, select a region, such as China (Hangzhou). On the Instances page, click the name of the instance you want to manage. Record the Endpoint and Network Information.
-
In the left-side navigation pane, click Access Control, then click the Intelligent Authentication tab. Record the username and password.
-
Run the producer program to publish messages, then check the HPA status:
kubectl get hpaExpected output:
NAME REFERENCE TARGETS MINPODS MAXPODS REPLICAS AGE keda-hpa-prometheus-scaledobject Deployment/sample-app 32700m/30 (avg) 2 10 10 47mREPLICASshows thatsample-apphas scaled out to the maximum replica count configured in the ScaledObject. -
Stop the producer and run the consumer program. Watch the HPA scale in as the backlog clears:
kubectl get hpa -wExpected output:
NAME                               REFERENCE               TARGETS            MINPODS   MAXPODS   REPLICAS   AGE
keda-hpa-prometheus-scaledobject   Deployment/sample-app   222500m/30 (avg)   2         10        10         50m
keda-hpa-prometheus-scaledobject   Deployment/sample-app   232400m/30 (avg)   2         10        10         51m
keda-hpa-prometheus-scaledobject   Deployment/sample-app   0/30 (avg)         2         10        10         52m
keda-hpa-prometheus-scaledobject   Deployment/sample-app   0/30 (avg)         2         10        2          57m
After all messages are consumed,
REPLICASdrops back to the minimum replica count (minReplicaCount: 2).
What's next
Scale pods based on queue length and messaging rate using ApsaraMQ for RabbitMQ metrics. For more information, see Horizontal pod autoscaling based on the metrics of ApsaraMQ for RabbitMQ.