GPU workloads like model inference and deep learning training have unpredictable load patterns. By scaling pods based on GPU metrics rather than CPU or memory, ACK clusters respond directly to the resource that matters—keeping GPU utilization high during peaks and reducing idle costs during lulls.
This guide walks you through deploying Managed Service for Prometheus, configuring the Prometheus adapter to expose GPU metrics via the custom metrics API, and setting up a Horizontal Pod Autoscaler (HPA) that scales pods based on those metrics.
Prerequisites
Before you begin, ensure that you have:
How it works
Kubernetes provides CPU and memory as built-in HPA metrics. For GPU-based scaling, the data pipeline works as follows:

Managed Service for Prometheus collects GPU metrics from DCGM (Data Center GPU Manager) exporters on each node.
The ack-alibaba-cloud-metrics-adapter translates those metrics into Kubernetes custom metrics, exposed at
/apis/custom.metrics.k8s.io/v1beta1.The HPA controller reads from the custom metrics API and adjusts replica counts based on your configured thresholds.
Scaling formula: desiredReplicas = ceil[ currentReplicas × (currentMetricValue / targetMetricValue) ]
For example, with 1 running pod, a current GPU utilization of 23%, and a target of 20%, the HPA scales to ceil(1 × 23/20) = 2 pods.
Step 1: Deploy Managed Service for Prometheus and ack-alibaba-cloud-metrics-adapter
Enable Prometheus monitoring
Enable Alibaba Cloud Prometheus monitoring for your ACK cluster.
When creating a cluster, select Enable Managed Service for Prometheus to skip this step.
Install ack-alibaba-cloud-metrics-adapter
A. Get the HTTP API endpoint
Log on to the ARMS console.
In the left-side navigation pane, choose Managed Service for Prometheus > Instances.
In the top navigation bar, select the region where your ACK cluster is deployed, and click the name of the Prometheus instance used by your cluster.
On the Settings page, click the Settings tab and copy the internal endpoint from the HTTP API URL section.
B. Configure the Prometheus URL
Log on to the ACK console. In the left-side navigation pane, choose Marketplace > Marketplace.
On the Marketplace page, click the App Catalog tab, then find and click ack-alibaba-cloud-metrics-adapter.
On the ack-alibaba-cloud-metrics-adapter page, click Deploy.
On the Basic Information wizard page, select a cluster and a namespace, then click Next.
On the Parameters wizard page, select a chart version from the Chart Version drop-down list. In the Parameters section, set the Prometheus
URLto the HTTP API endpoint you copied, then click OK.
Step 2: Configure adapter rules
The adapter uses rules to map raw DCGM Prometheus metrics to named Kubernetes custom metrics. Each rule tells the adapter which Prometheus series to query, how to aggregate values, and which Kubernetes resources (node, namespace, pod) to associate with the results.
Available GPU metrics
For the full list of GPU metrics collected by Managed Service for Prometheus, see Introduction to metrics.
Add rules to the adapter
Log on to the ACK console. In the left-side navigation pane, click ACK consoleACK consoleACK consoleClusters.
On the Clusters page, click the name of your cluster. In the left-side navigation pane, choose Applications > Helm.
On the Helm page, click Update in the Actions column of ack-alibaba-cloud-metrics-adapter. Under
custom, add the followingrules:
- metricsQuery: avg(<<.Series>>{<<.LabelMatchers>>}) by (<<.GroupBy>>)
  resources:
    overrides:
      NodeName:
        resource: node
  seriesQuery: DCGM_FI_DEV_GPU_UTIL{} # GPU utilization (node-level, exclusive mode only)
- metricsQuery: avg(<<.Series>>{<<.LabelMatchers>>}) by (<<.GroupBy>>)
  resources:
    overrides:
      NamespaceName:
        resource: namespace
      NodeName:
        resource: node
      PodName:
        resource: pod
  seriesQuery: DCGM_CUSTOM_PROCESS_SM_UTIL{} # GPU utilization per pod
- metricsQuery: sum(<<.Series>>{<<.LabelMatchers>>}) by (<<.GroupBy>>)
  resources:
    overrides:
      NodeName:
        resource: node
  seriesQuery: DCGM_FI_DEV_FB_USED{} # GPU memory used (node-level, exclusive mode only)
- metricsQuery: sum(<<.Series>>{<<.LabelMatchers>>}) by (<<.GroupBy>>)
  resources:
    overrides:
      NamespaceName:
        resource: namespace
      NodeName:
        resource: node
      PodName:
        resource: pod
  seriesQuery: DCGM_CUSTOM_PROCESS_MEM_USED{} # GPU memory used per pod
- metricsQuery: sum(<<.Series>>{<<.LabelMatchers>>}) by (<<.GroupBy>>) / sum(DCGM_CUSTOM_CONTAINER_MEM_ALLOCATED{}) by (<<.GroupBy>>)
  name:
    as: ${1}_GPU_MEM_USED_RATIO
    matches: ^(.*)_MEM_USED
  resources:
    overrides:
      NamespaceName:
        resource: namespace
      PodName:
        resource: pod
  seriesQuery: DCGM_CUSTOM_PROCESS_MEM_USED{NamespaceName!="",PodName!=""} # GPU memory utilization per pod (used/allocated)
The following figure shows an example configuration.
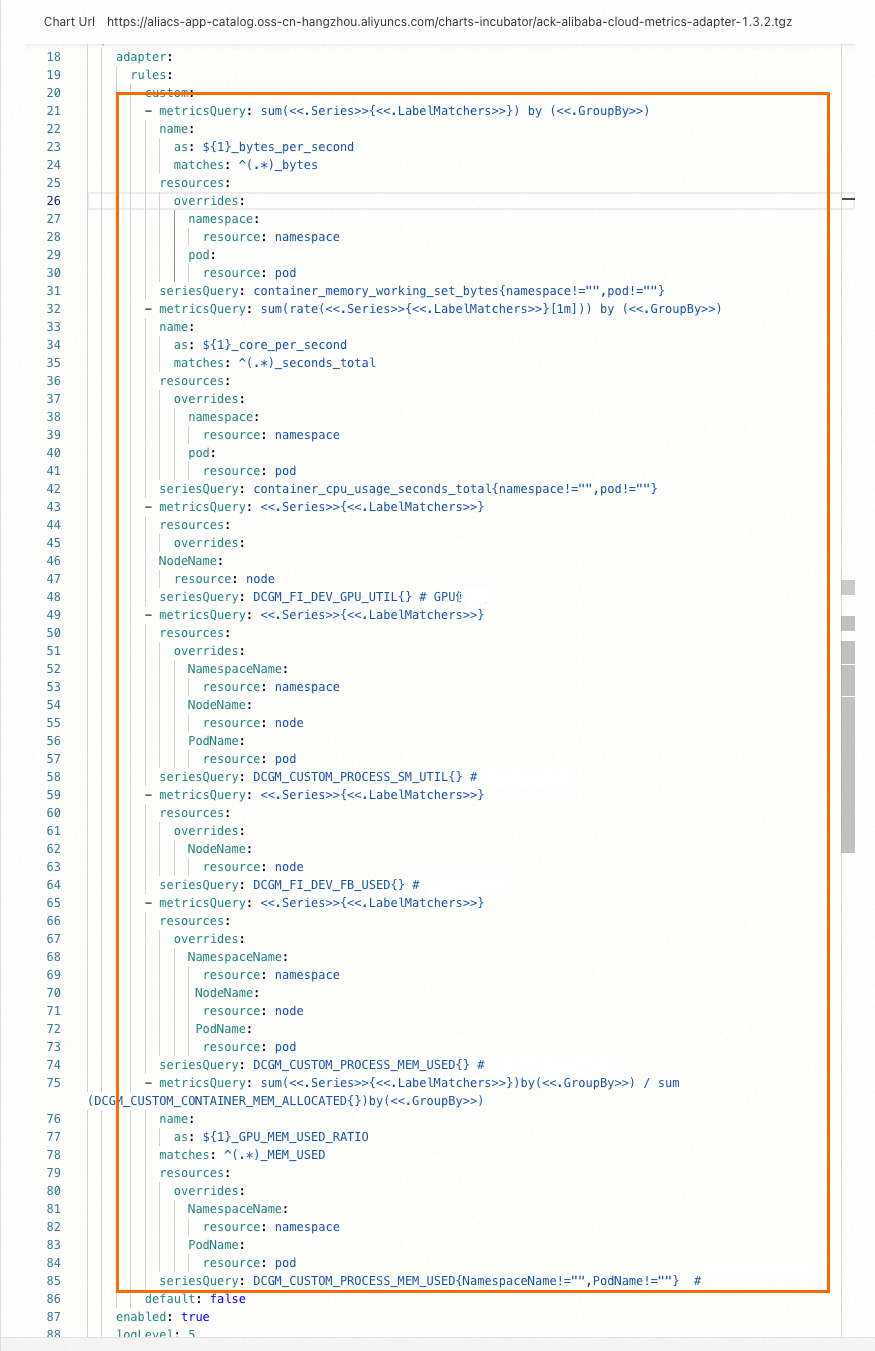
The table below describes each rule field.
| Field | Description |
|---|---|
seriesQuery | The Prometheus metric name (and optional label filters) to query |
metricsQuery | The PromQL aggregation template. <<.Series>>, <<.LabelMatchers>>, and <<.GroupBy>> are placeholders the adapter fills in at runtime |
resources.overrides | Maps DCGM label names (e.g., PodName) to Kubernetes resource types (e.g., pod), so the HPA can query metrics scoped to specific pods or nodes |
name.matches / name.as | Renames the resulting metric. For example, DCGM_CUSTOM_PROCESS_MEM_USED becomes DCGM_CUSTOM_PROCESS_GPU_MEM_USED_RATIO |
Verify the rules
Run the following command. If the output includes DCGM_FI_DEV_GPU_UTIL, DCGM_CUSTOM_PROCESS_SM_UTIL, DCGM_FI_DEV_FB_USED, and DCGM_CUSTOM_PROCESS_MEM_USED, the rules are active.
kubectl get --raw "/apis/custom.metrics.k8s.io/v1beta1"The following shows an example output where DCGM_CUSTOM_PROCESS_SM_UTIL appears scoped to nodes, pods, and namespaces:
{
  [
    ...
    {
      "name": "nodes/DCGM_CUSTOM_PROCESS_SM_UTIL",
      "singularName": "",
      "namespaced": false,
      "kind": "MetricValueList",
      "verbs": [
        "get"
      ]
    },
    ...
    {
      "name": "pods/DCGM_CUSTOM_PROCESS_SM_UTIL",
      "singularName": "",
      "namespaced": true,
      "kind": "MetricValueList",
      "verbs": [
        "get"
      ]
    },
    ...
    {
      "name": "namespaces/DCGM_CUSTOM_PROCESS_SM_UTIL",
      "singularName": "",
      "namespaced": false,
      "kind": "MetricValueList",
      "verbs": [
        "get"
      ]
    }
    ...
    {
      "name": "DCGM_CUSTOM_PROCESS_GPU_MEM_USED_RATIO",
      "singularName": "",
      "namespaced": false,
      "kind": "MetricValueList",
      "verbs": [
        "get"
      ]
    }
    ...
  ]
}
Step 3: Enable auto scaling based on GPU metrics
The following example deploys a BERT intent-detection inference service on a GPU-accelerated node, configures the HPA to scale on pod GPU utilization, and validates the behavior under load.
Configure the HPA
The table below describes the GPU metrics available to the HPA.
| Metric | Description | Unit |
|---|---|---|
DCGM_FI_DEV_GPU_UTIL | GPU utilization. Available only for GPUs in exclusive mode. Important When a GPU is shared across multiple pods, | % |
DCGM_FI_DEV_FB_USED | GPU memory used. Available only for GPUs in exclusive mode. | MiB |
DCGM_CUSTOM_PROCESS_SM_UTIL | GPU utilization per pod. | % |
DCGM_CUSTOM_PROCESS_MEM_USED | GPU memory used per pod. | MiB |
DCGM_CUSTOM_PROCESS_GPU_MEM_USED_RATIO | GPU memory utilization per pod: used / allocated. | % |
The following example triggers scale-out when pod GPU utilization (DCGM_CUSTOM_PROCESS_SM_UTIL) exceeds 20%.
v1.23 or later
cat <<EOF | kubectl create -f -
apiVersion: autoscaling/v2
kind: HorizontalPodAutoscaler
metadata:
  name: gpu-hpa
spec:
  scaleTargetRef:
    apiVersion: apps/v1
    kind: Deployment
    name: bert-intent-detection
  minReplicas: 1
  maxReplicas: 10
  metrics:
  - type: Pods
    pods:
      metric:
        name: DCGM_CUSTOM_PROCESS_SM_UTIL
      target:
        type: Utilization
        averageValue: 20 # Scale out when average GPU utilization across pods exceeds 20%
EOF
Earlier than v1.23
cat <<EOF | kubectl create -f -
apiVersion: autoscaling/v2beta1
kind: HorizontalPodAutoscaler
metadata:
  name: gpu-hpa
spec:
  scaleTargetRef:
    apiVersion: apps/v1
    kind: Deployment
    name: bert-intent-detection
  minReplicas: 1
  maxReplicas: 10
  metrics:
  - type: Pods
    pods:
      metricName: DCGM_CUSTOM_PROCESS_SM_UTIL
      targetAverageValue: 20 # Scale out when average GPU utilization across pods exceeds 20%
EOF
Verify the HPA is active:
kubectl get hpaExpected output:
NAME      REFERENCE                          TARGETS   MINPODS   MAXPODS   REPLICAS   AGE
gpu-hpa   Deployment/bert-intent-detection   0/20      1         10        1          74s
TARGETS shows 0/20—current GPU utilization is 0, and the HPA will scale out once it exceeds 20%.
Test auto scaling
Scale-out
Run a stress test against the inference service:
The following formula is used to calculate the expected number of pods after auto scaling:
Expected number of pods = ceil[Current number of pods × (Current GPU utilization / Expected GPU utilization)]. For example, if the current number of pods is 1, current GPU utilization is 23, and expected GPU utilization is 20, the expected number of pods after auto scaling is 2.hey -n 10000 -c 200 "http://47.95.XX.XX/predict?query=music"While the test runs, watch the HPA status in real time:
kubectl get hpa --watch
# Press Ctrl+C to stop watching
Expected output during the test:
NAME REFERENCE TARGETS MINPODS MAXPODS REPLICAS AGE gpu-hpa Deployment/bert-intent-detection 23/20 1 10 2 7m56sTARGETSshows23/20—GPU utilization exceeds the threshold, so the HPA scales to 2 pods:ceil(1 × 23/20)= 2.Check the running pods:
kubectl get podsExpected output:
NAME                                    READY   STATUS    RESTARTS   AGE
bert-intent-detection-7b486f6bf-f****   1/1     Running   0          44m
bert-intent-detection-7b486f6bf-m****   1/1     Running   0          14s
Two pods are running, matching the expected replica count.
Scale-in
When the stress test stops and GPU utilization drops below 20%, the ACK cluster starts to scale in pods after about 5 minutes.
Watch the HPA status:
kubectl get hpa --watch
# Press Ctrl+C to stop watching
Expected output after stabilization:
NAME      REFERENCE                          TARGETS   MINPODS   MAXPODS   REPLICAS   AGE
gpu-hpa   Deployment/bert-intent-detection   0/20      1         10        1          15m
Confirm the pod count has returned to 1:
kubectl get podsExpected output:
NAME                                    READY   STATUS    RESTARTS   AGE
bert-intent-detection-7b486f6bf-f****   1/1     Running   0          52m
FAQ
How do I confirm whether a GPU is in use?
Check the GPU Monitoring tab in Prometheus Monitoring. An increase in GPU utilization indicates the GPU is active; a flat line indicates no workload is running.
Log on to the ACK console. In the left-side navigation pane, click Clusters.
On the Clusters page, click the name of your cluster. In the left-side navigation pane, choose Operations > Prometheus Monitoring.
On the Prometheus Monitoring page, click the GPU Monitoring tab and observe the GPU utilization trend.