This topic uses virtual large language mode (vLLM) inference scenarios as examples to show how to analyze the AI profiling results of GPU-accelerated pods running in Container Service for Kubernetes (ACK) clusters. This topic focuses on how to analyze the execution process of Python processes, CPU calls, system calls, Compute Unified Device Architecture (CUDA) libraries, and CUDA kernel functions by using the visualization page of online performance detection results. This helps you locate performance bottlenecks, identify optimization opportunities, and improve GPU utilization and application efficiency.
Example of vLLM inference
Sample environment
Framework: vLLM 0.5.0
Model: Qwen2-7B
GPU: NVIDIA A10
Profiling duration: 5s
Enabled profiling items: all
Result analysis
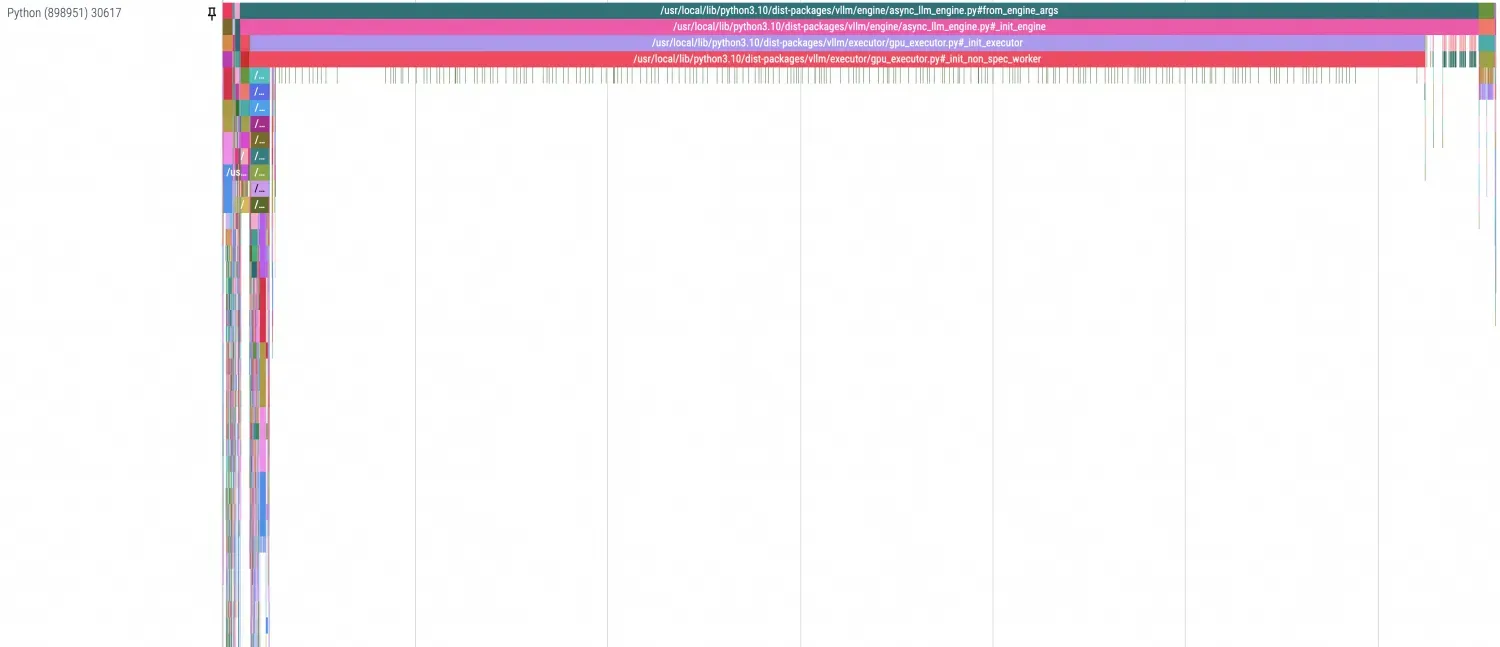
Model loading
View the overall process of model loading: The enlarged view reveals that the entire model loading process is divided into three steps: data reading, data copying, and decoding.
 In Python profiling, you can separate different stages with dividing lines, as shown in the following figure. Since this example shows the first startup, PageCache is not used. Therefore, the time required by data transmission is particularly noticeable.
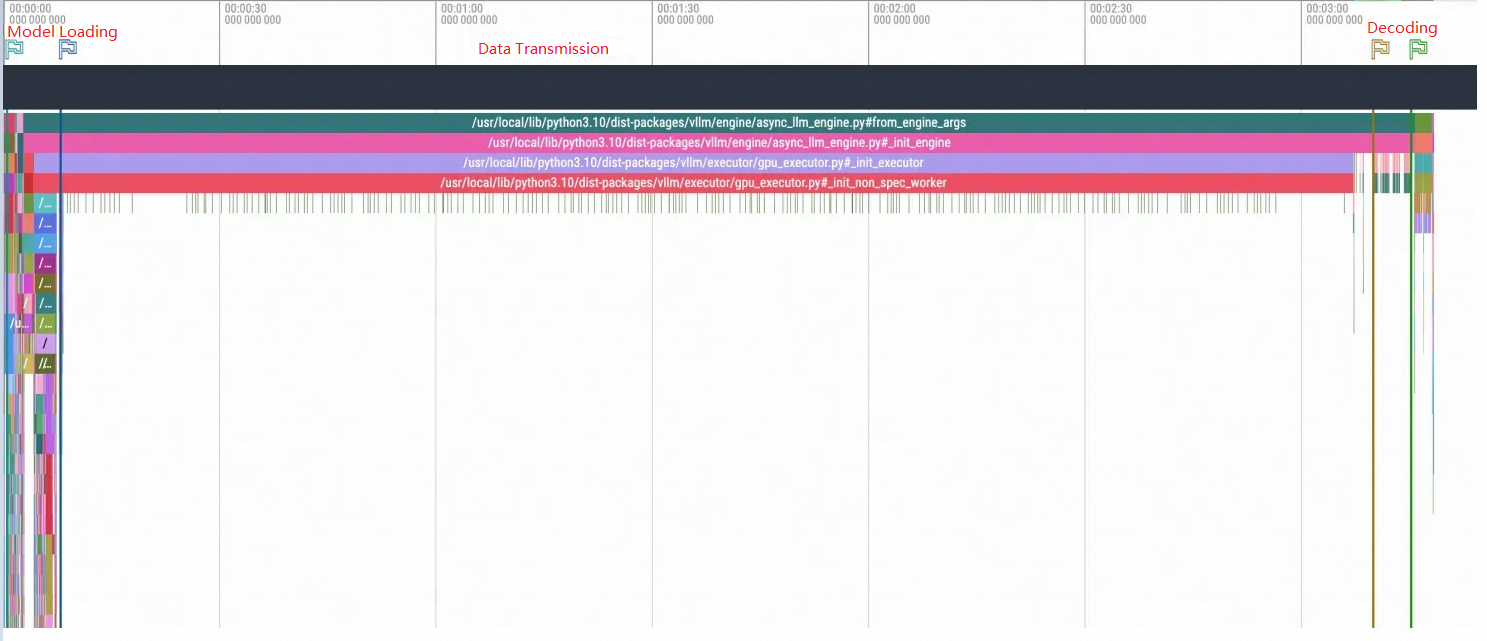
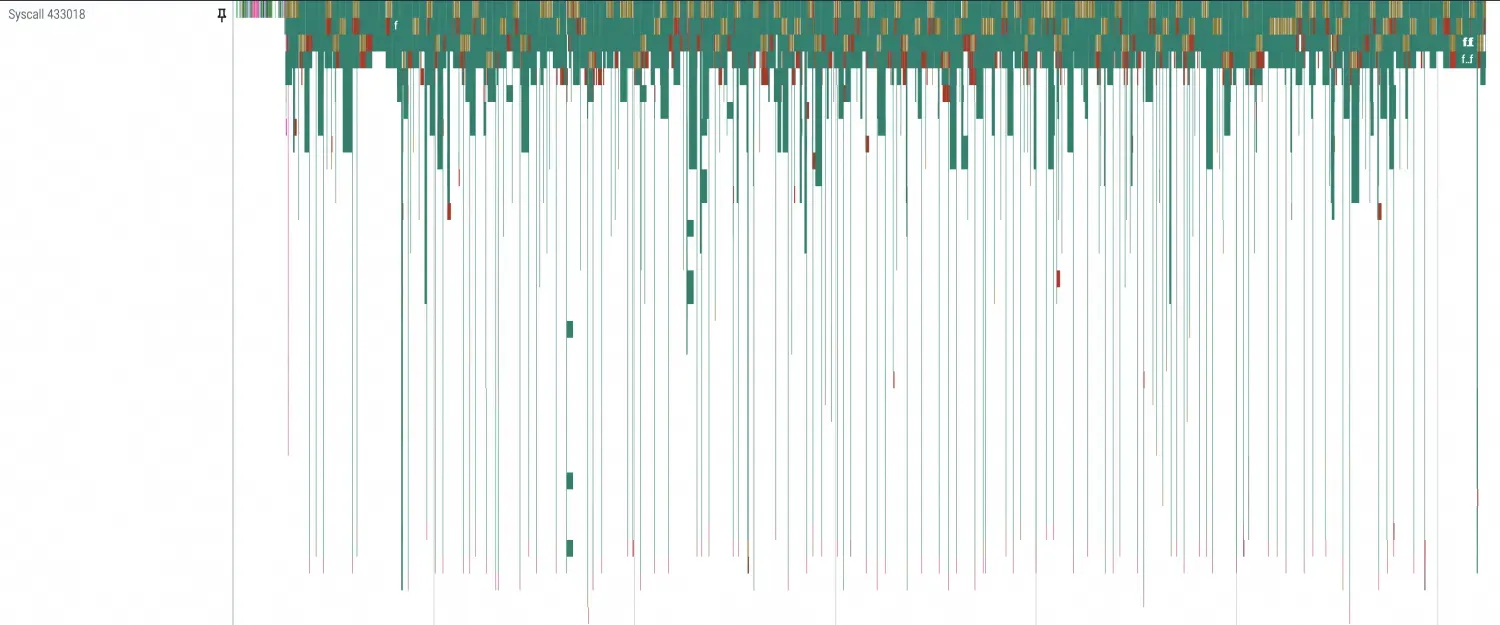
Examine the profiling details for each stage. By zooming in, you can see that the main activity involves I/O-related system calls, such as openat, mmap, read, and ioctl. Because the model is loaded using
safetensors.torch.load_filefor random access reads, mmap and read calls appear frequently.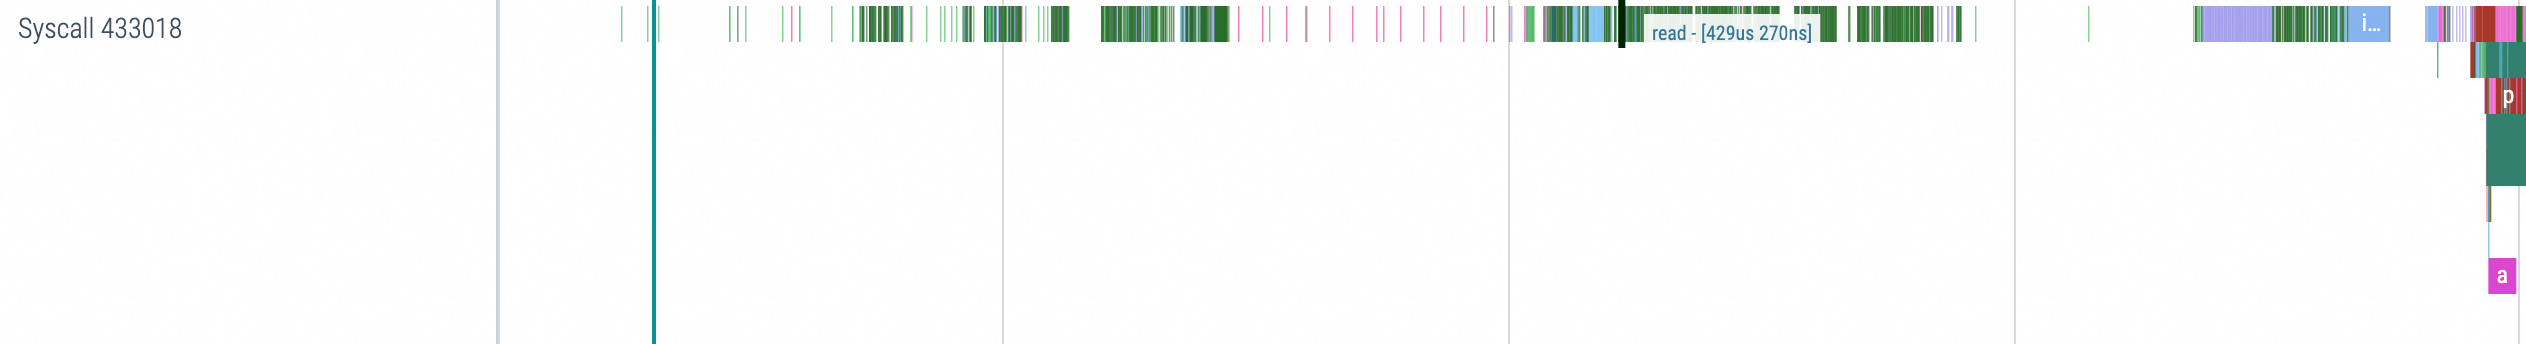
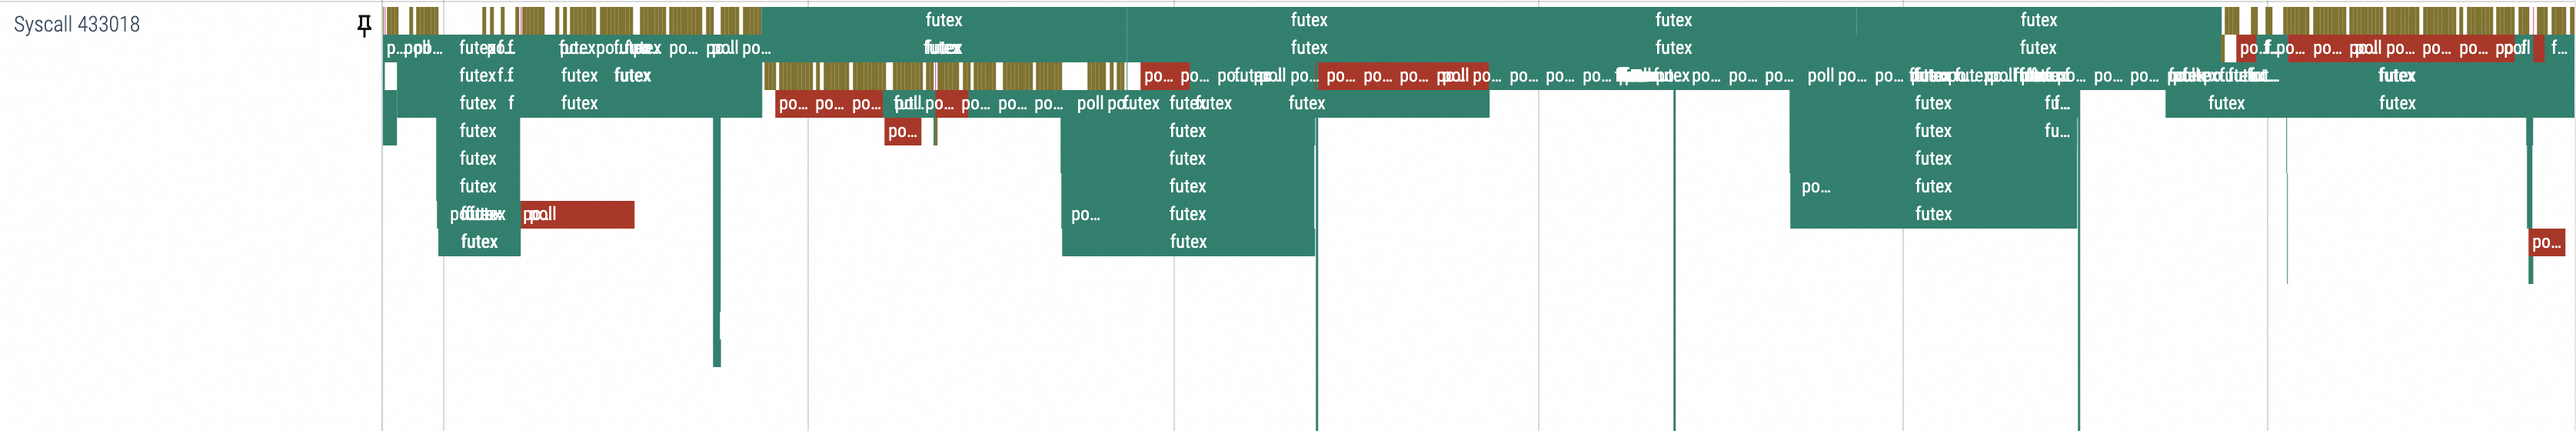
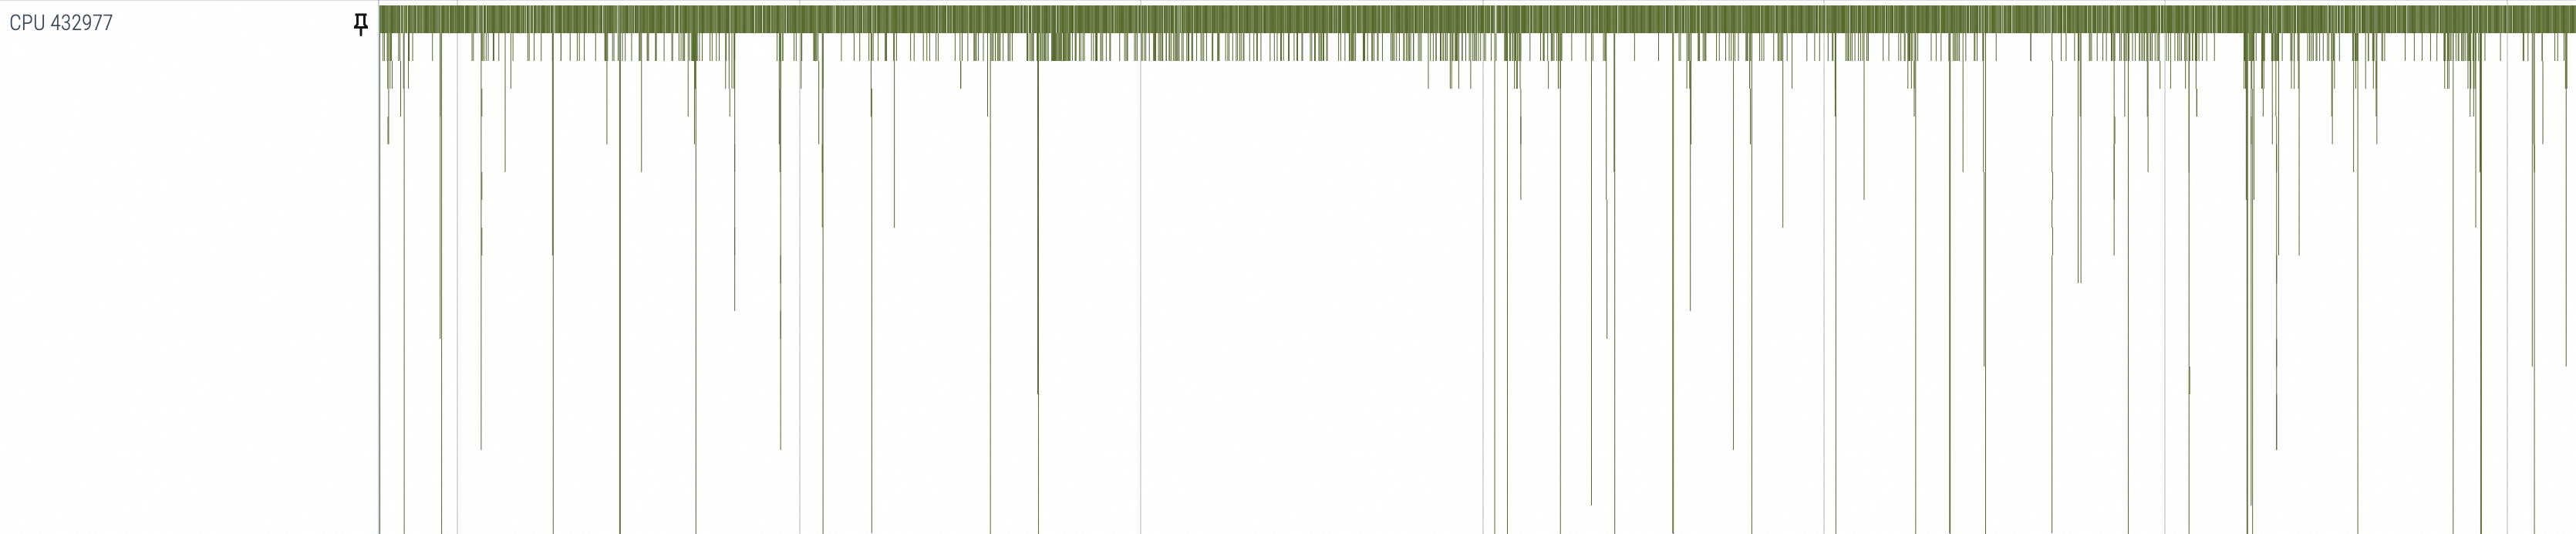
The data transmission process shows that system calls are concentrated in poll, epoll, and futex. Multiple CPUs are frequently used and switched. In terms of CUDA calls, there are as many cuMemcpyHtoD transmissions as there are model safetensors. Therefore, based on the model loading process of vLLM, you can identify the path of model data transmission: disk or network -> memory (PageCache) -> GPU memory. Add network and disk I/O data to the figure to help you clearly observe the path.
Observe the decoding process and focus on GPU-related library calls. The matrix multiplication executed in each batch and its upstream and downstream calls (such as cuLaunchKernel, cuMemcpyDtoD, cublasGemmEx) regularly appear and can be aligned with the corresponding Python Decoding method. Therefore, the stages they represent can be clearly distinguished.

Model inference
This example describes the process of discovering and speculating problems by using a manually simulated NCCL hang.
Since the NCCL hang usually manifests as being trapped in kernel mode or NCCL-level communication/IO blocking, you can reproduce the scenario by simulating interruptions in NCCL communication between different processes. Run the following commands to suspend and restore processes as a simulation of the interruption and recovery process of NCCL:
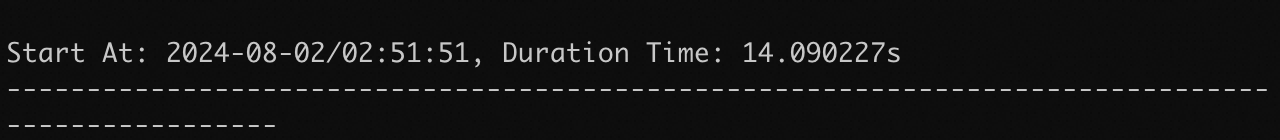
kill -STOP <PID>
kill -CONT <PID>
Normal inference duration without interruption:
Inference duration with a 5-second interruption:
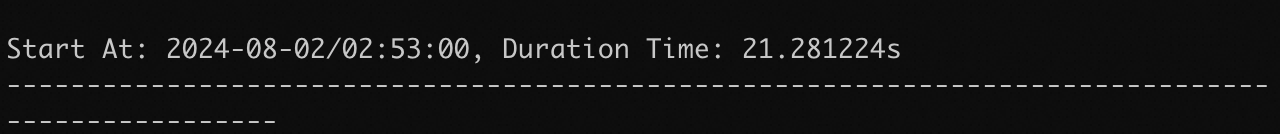
During the process of active interruption, you can observe from the above steps that each inference in the example takes about 15 seconds. With a simulated interruption of 5 seconds, the total duration for the inference request after recovery becomes 20 seconds, which aligns with the expected outcome.
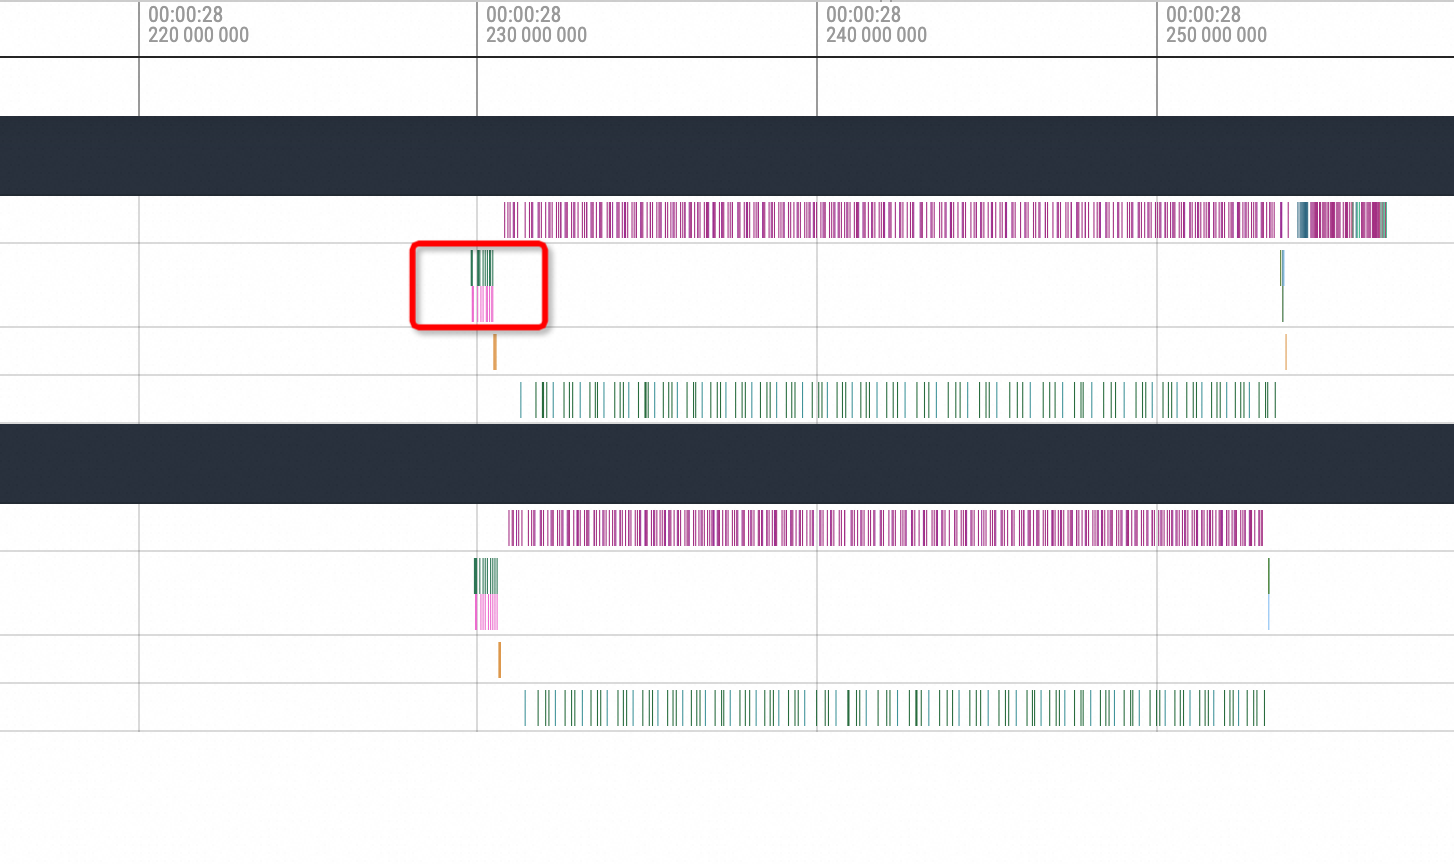
Observations show that each inference process of vLLM consists of multiple inference computation steps, as highlighted by the red box in the following figure. The general process is as follows:
cuda memory copy H2D -> nccl broadcast -> cublas compute -> nccl send and recv -> cuda memory copy D2H. Therefore, NCCL may be interrupted during thebroadcastandsend and recvprocesses.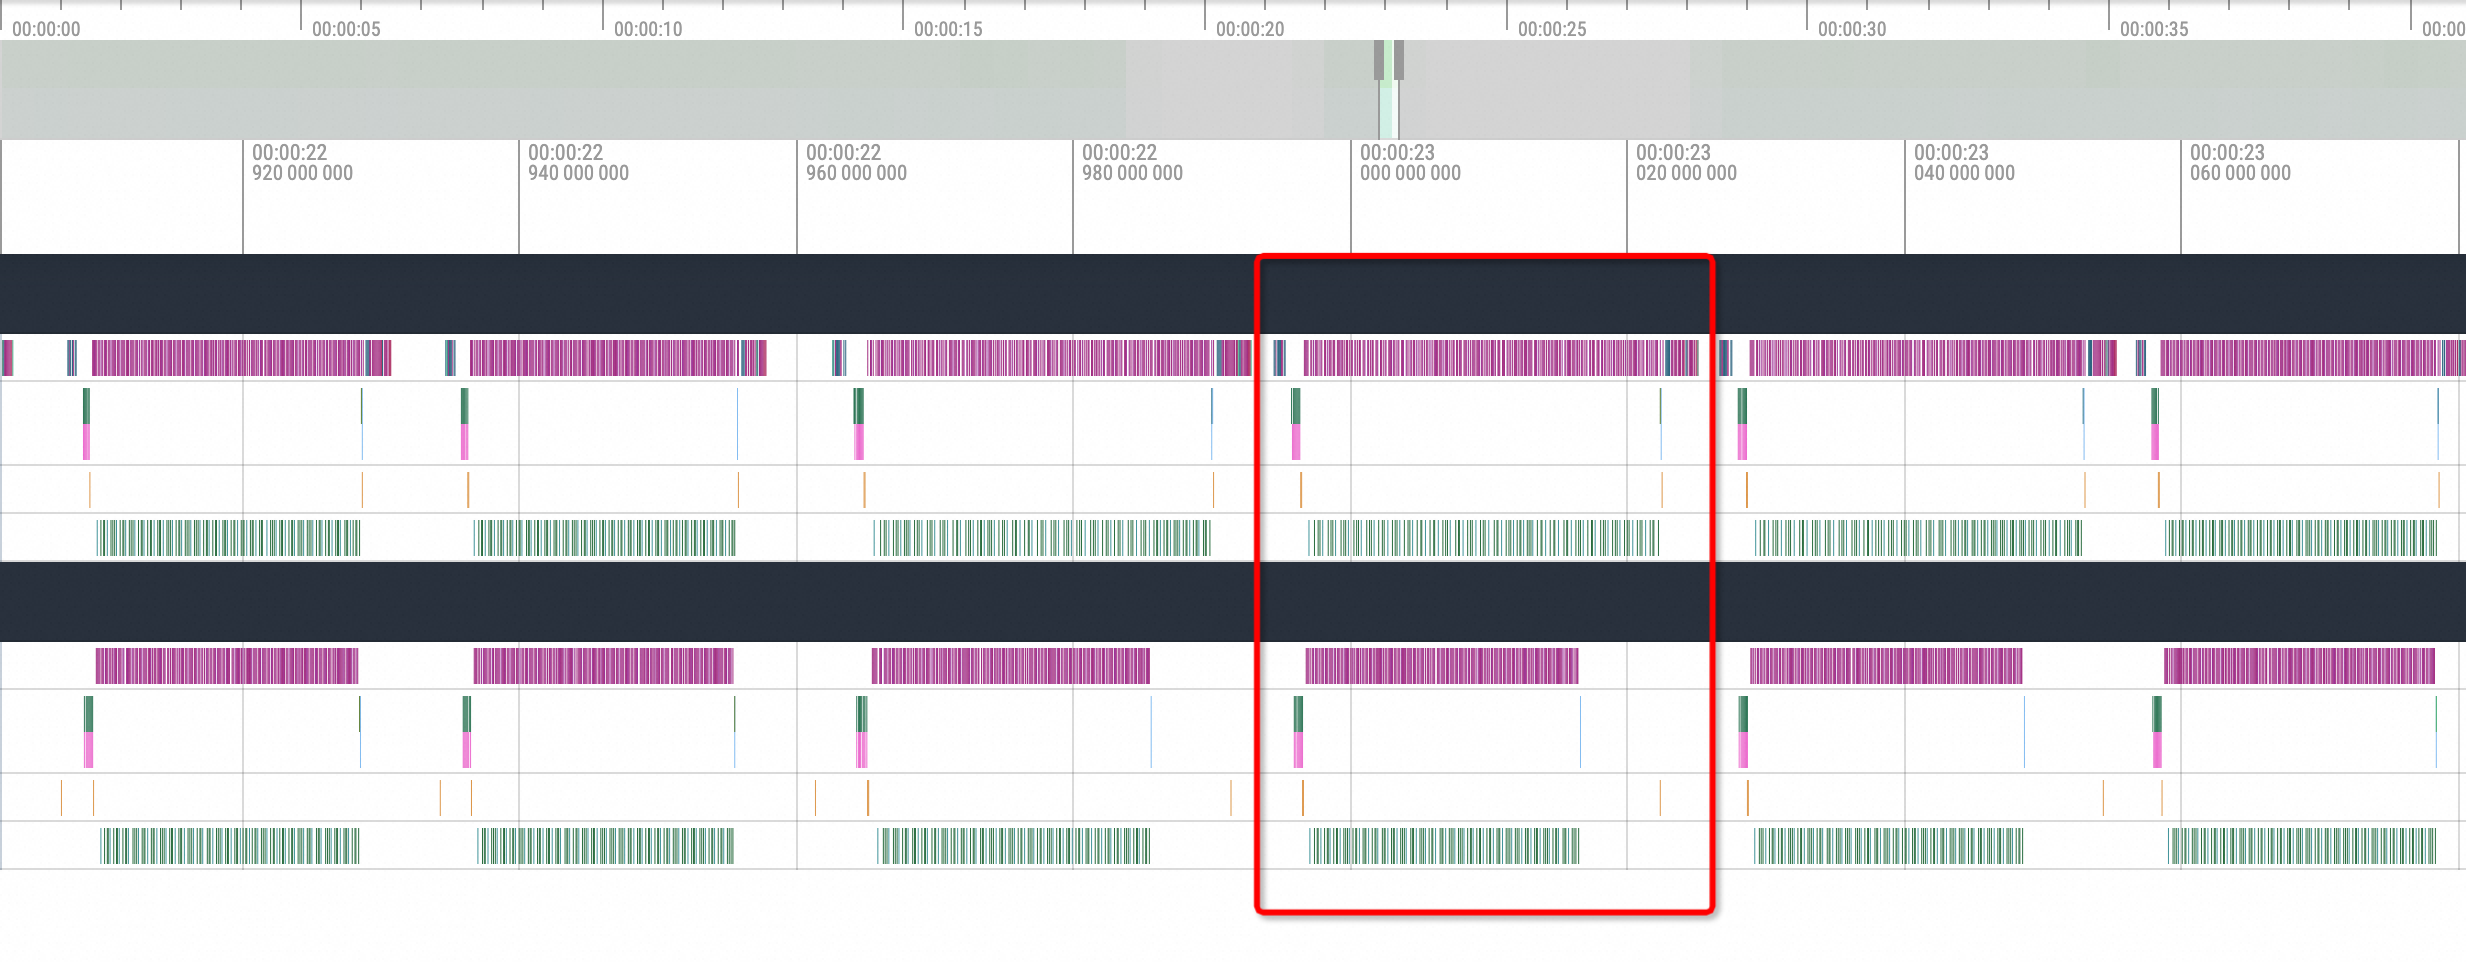
The interruption point determines the blocked NCCL action. Enable 60 seconds of GPU-only profiling and convert the profiling data to Chrome Tracing format data. The following list describes two cases of NCCL being blocked:
nccl send and recvThe visualization results are as follows:
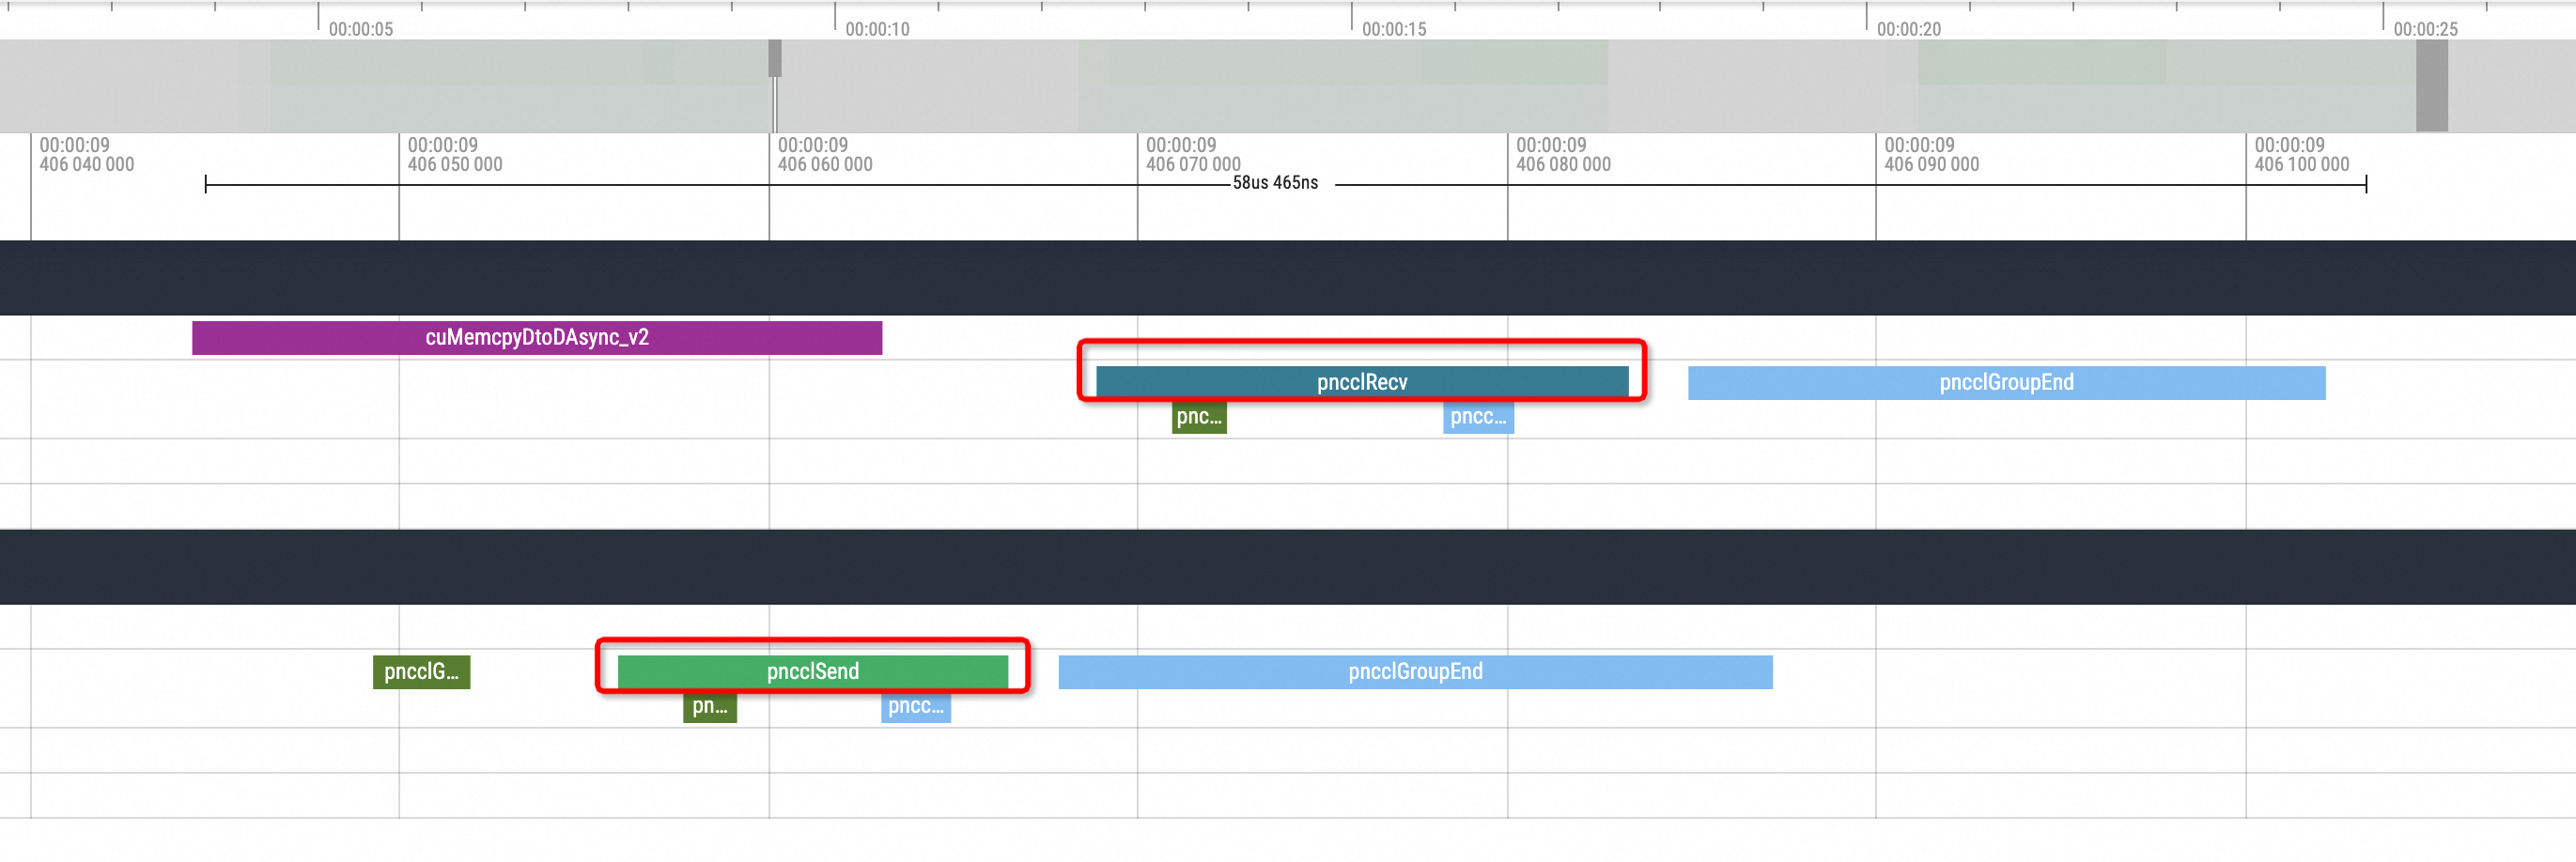
During the end time of an inference, there is usually one pnccl Send in one replica, and a corresponding pnccl Recv in another replica. When the simulation for the NCCL hang is enabled, you can see the following situation in the profiling view:
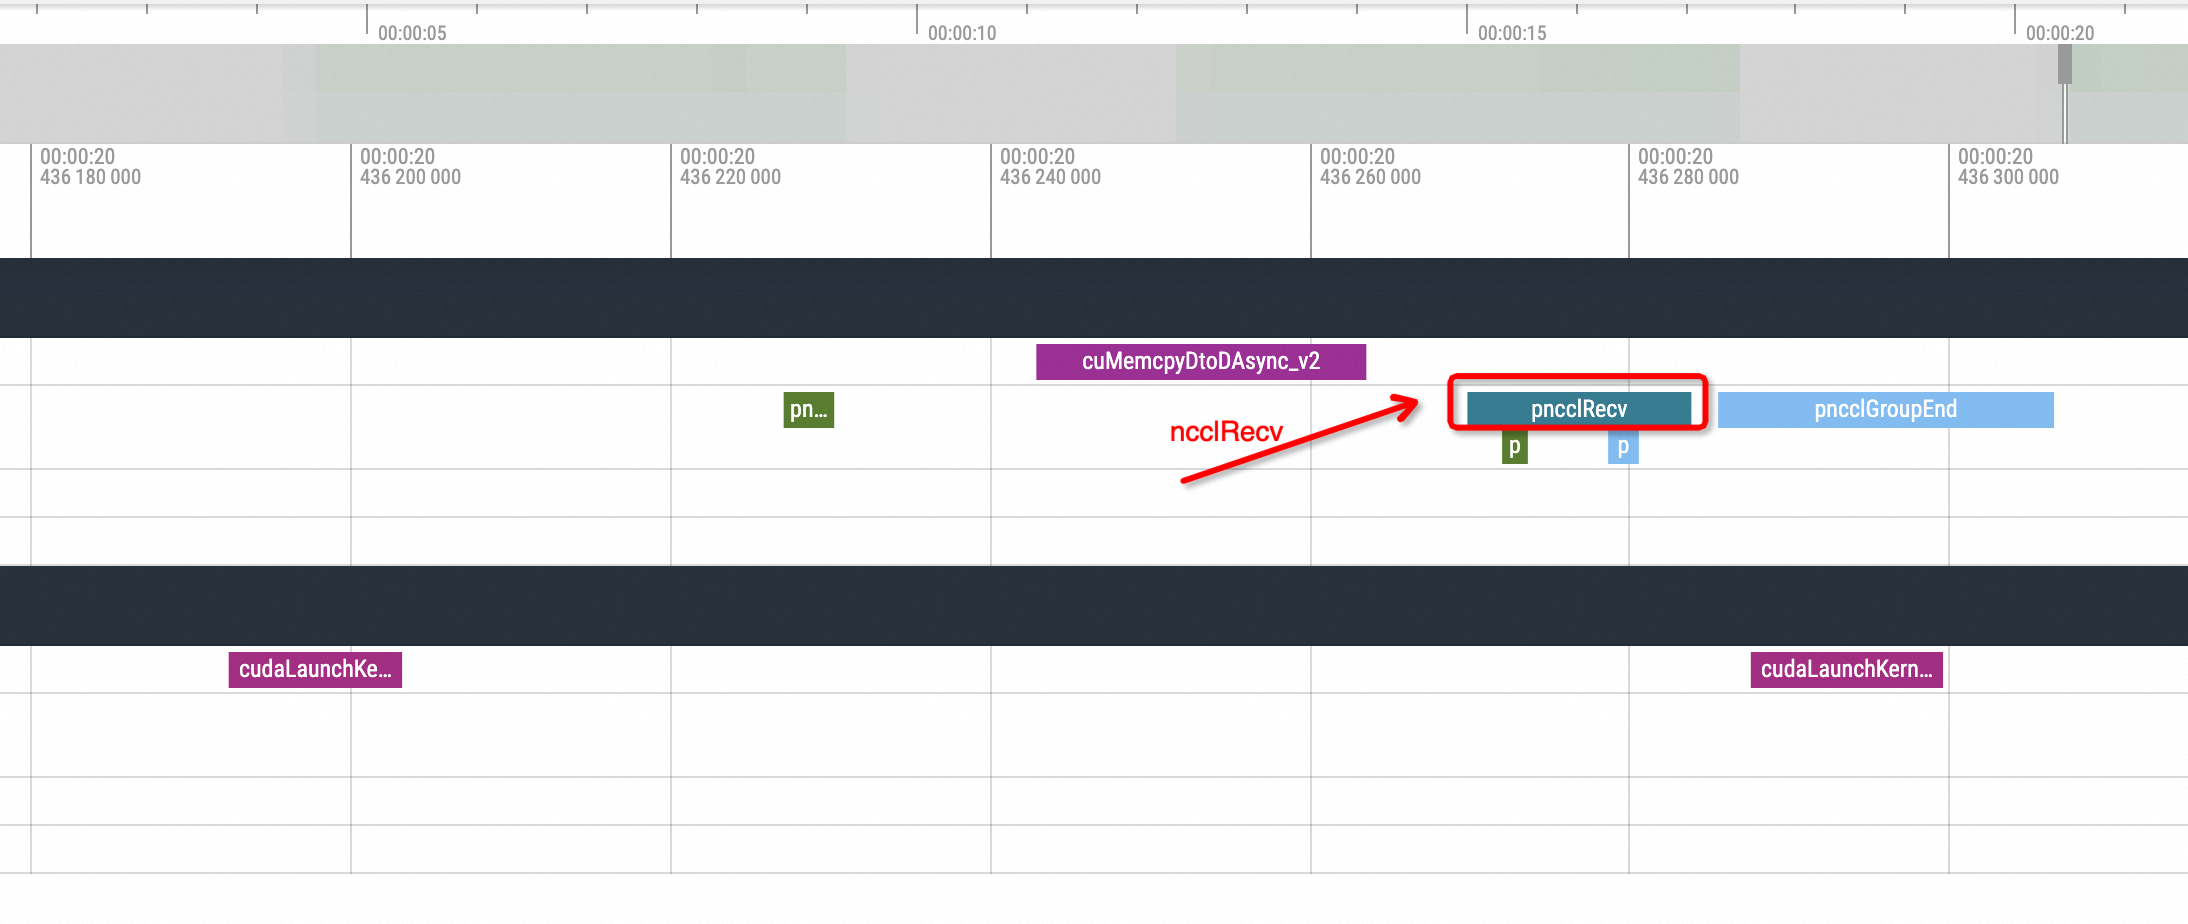
After one replica issues an ncclSend call, there is no corresponding ncclRecv action call from the other replica, and the GPU-related method call enters an idle state for a period of time. Another replica executes the corresponding ncclRecv action only after the waiting process status is restored. Without understanding the underlying logic, it can be inferred that this phenomenon is caused by an NCCL hang issue.
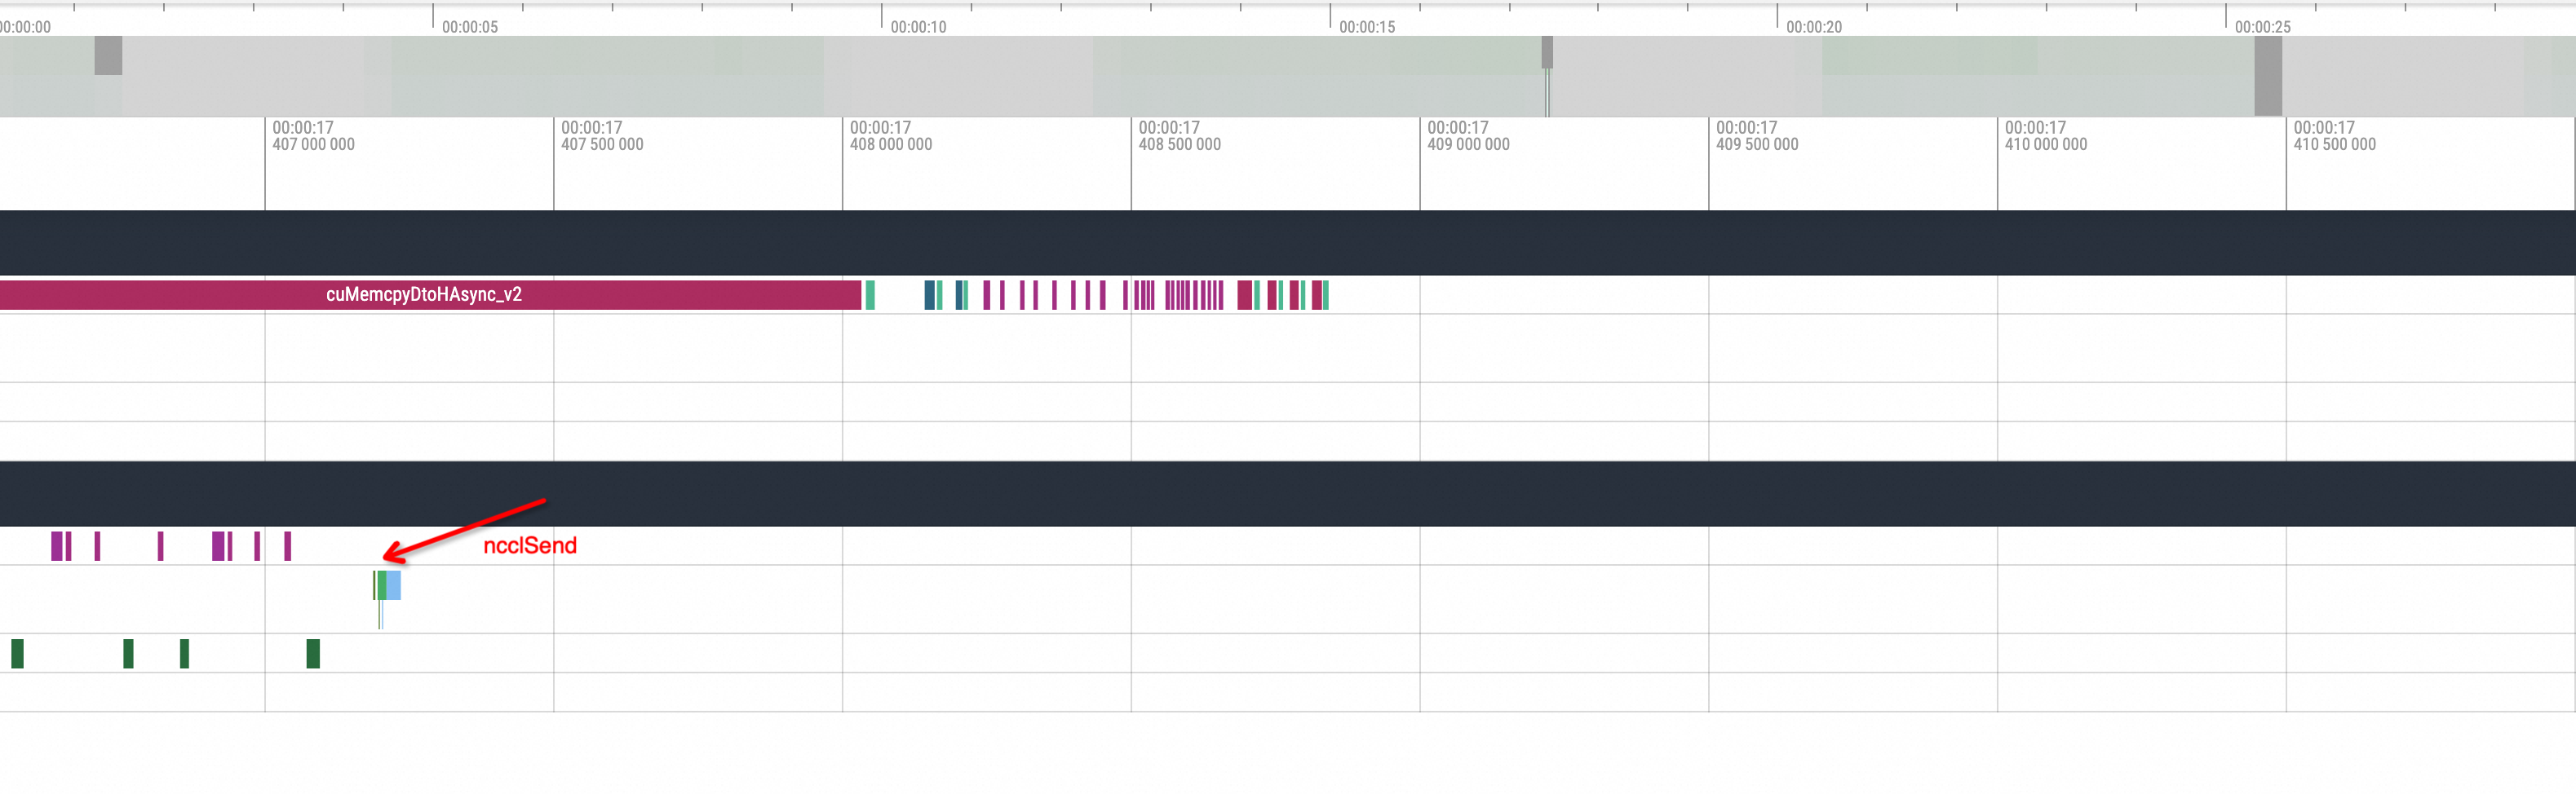
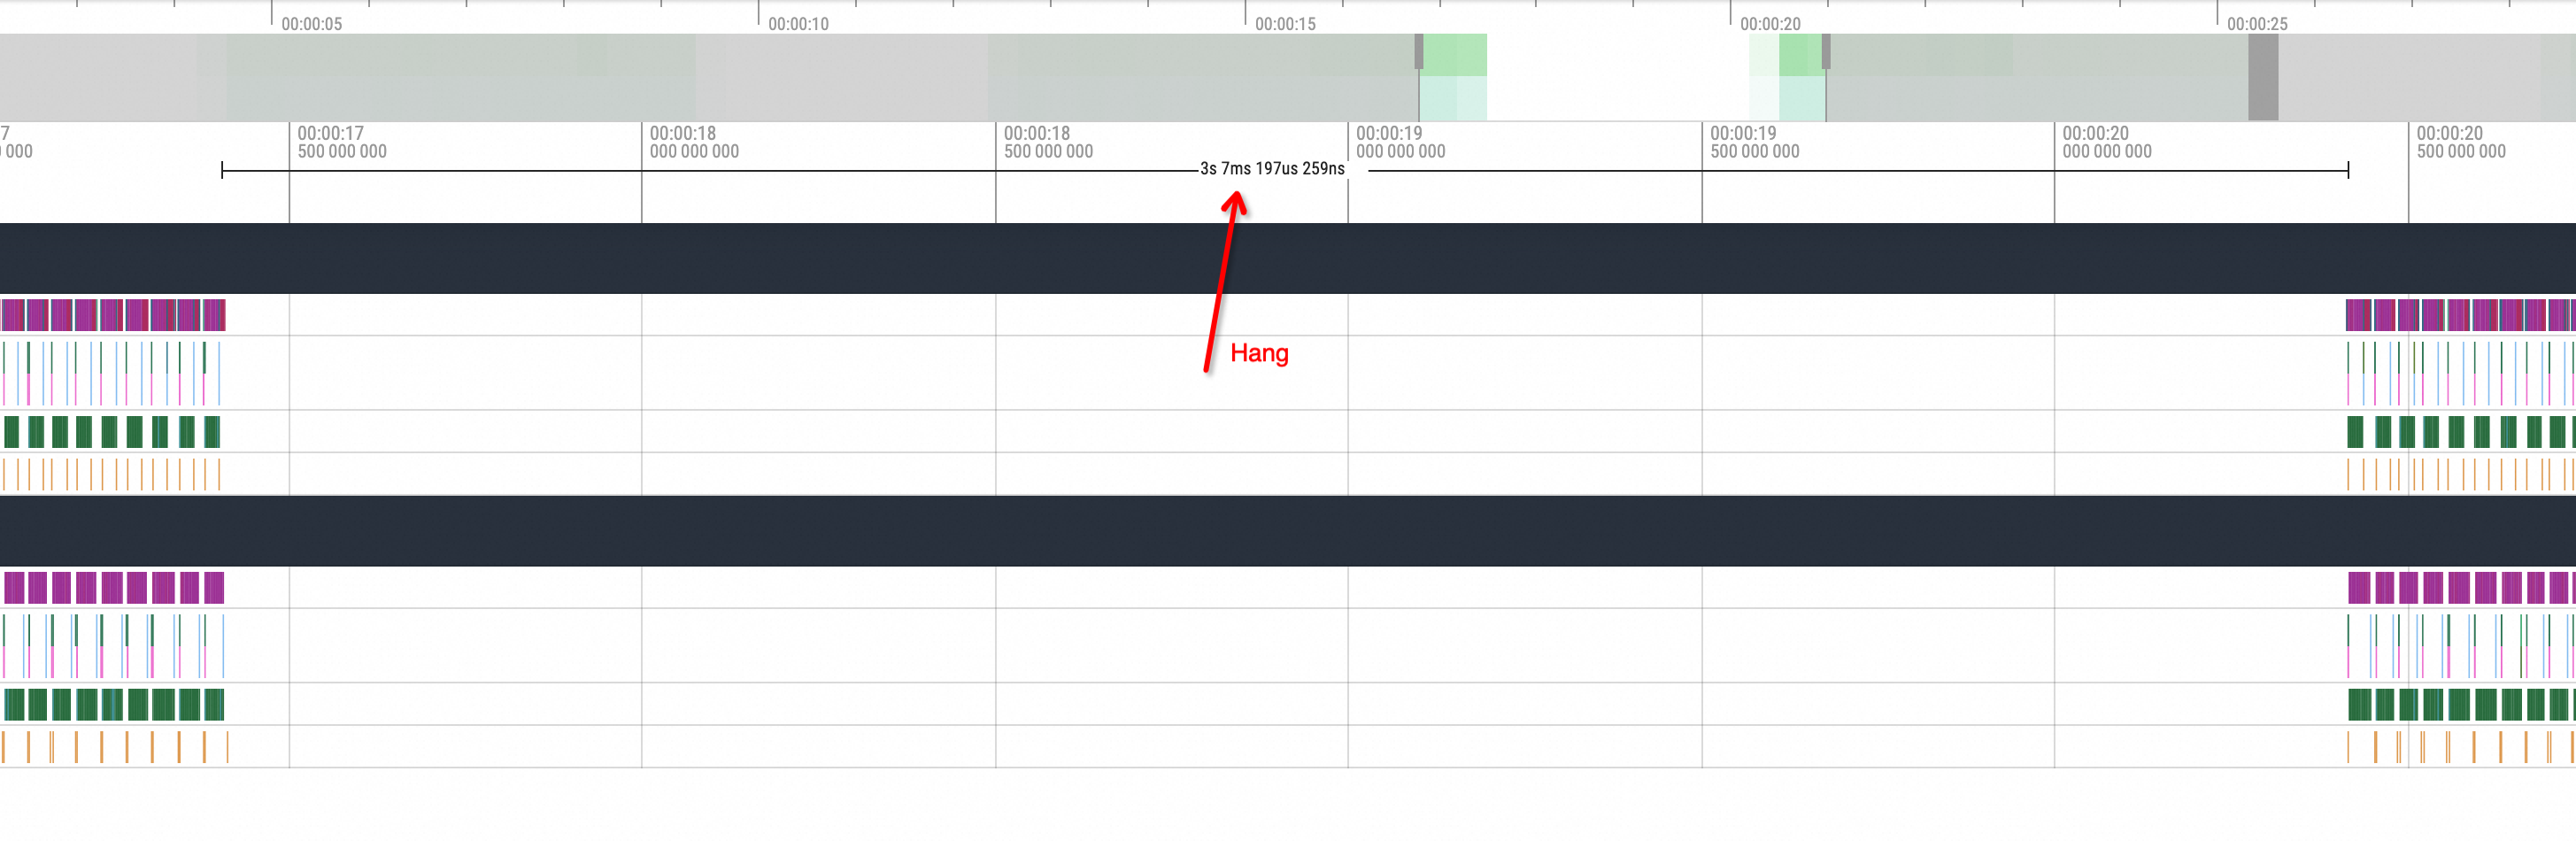
nccl broadcastThe following figure shows the effect of a Hang operation performed before
nccl broadcast: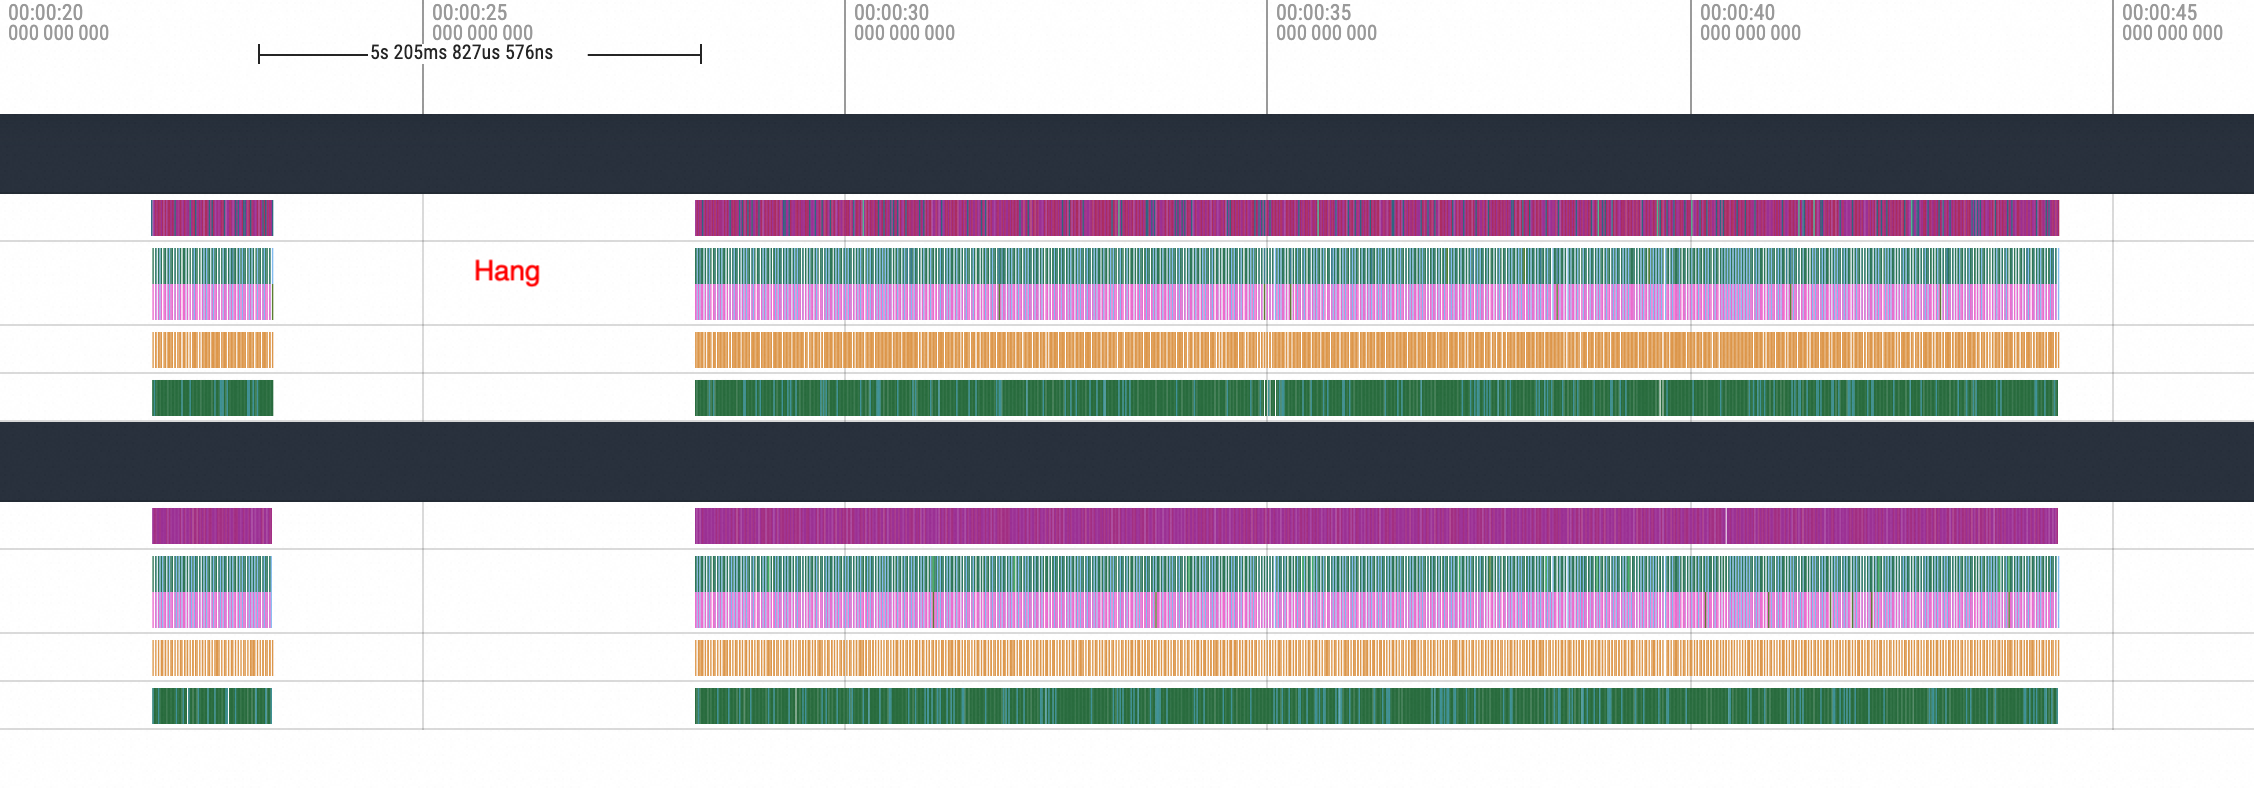
Zoom in on the method executed before the hang.
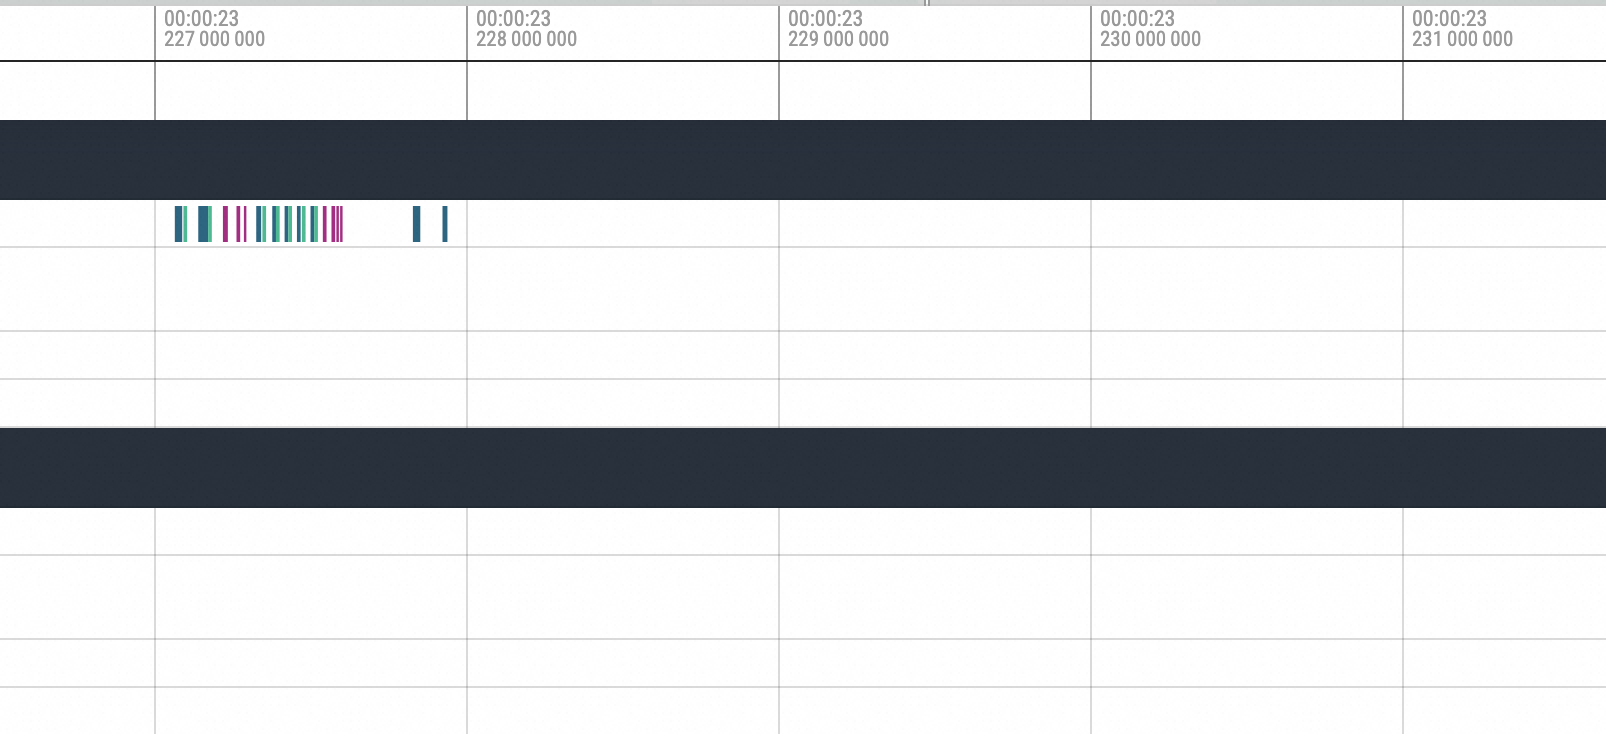
You can see the execution of cuMemcpyH2D. After the execution, the process hangs. Then, move to the position after the hang recovery.
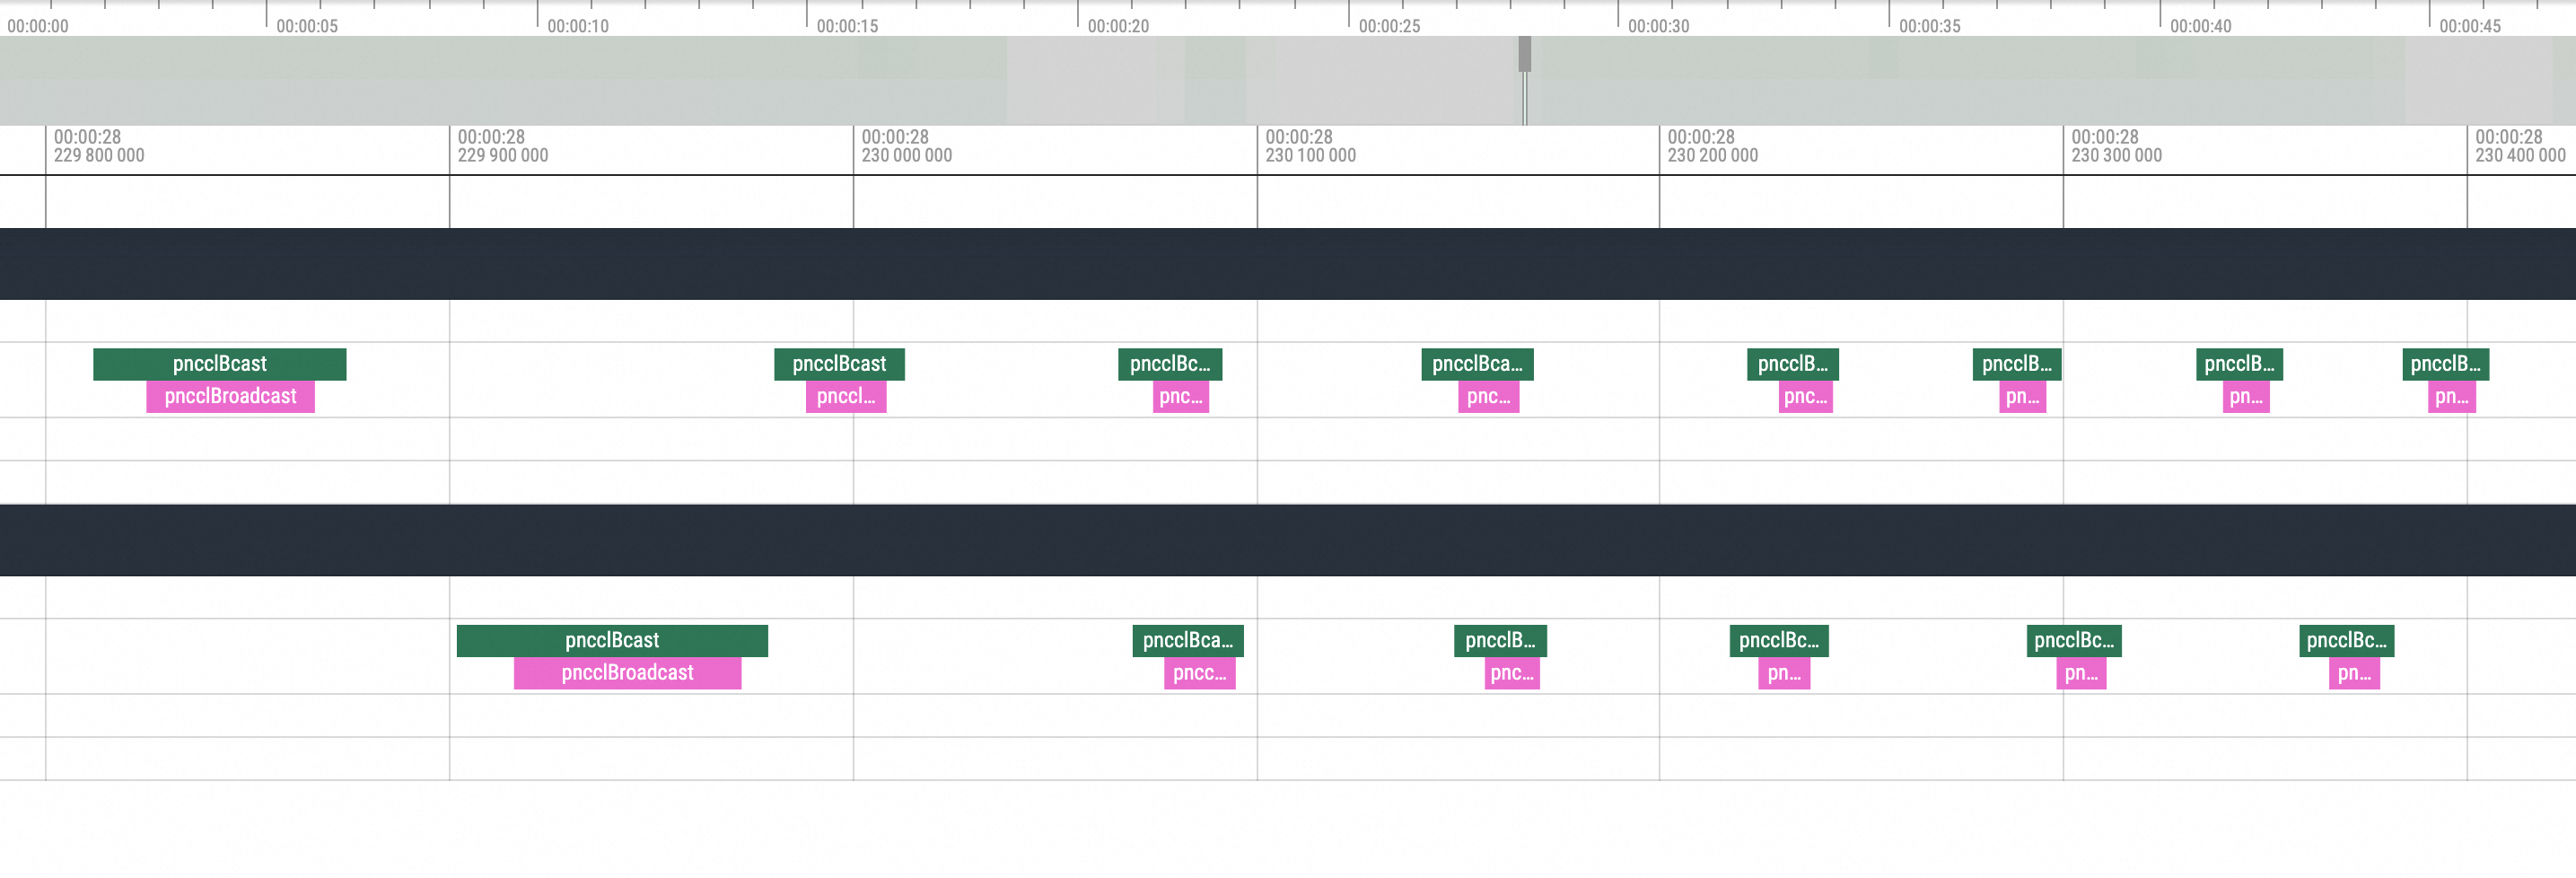
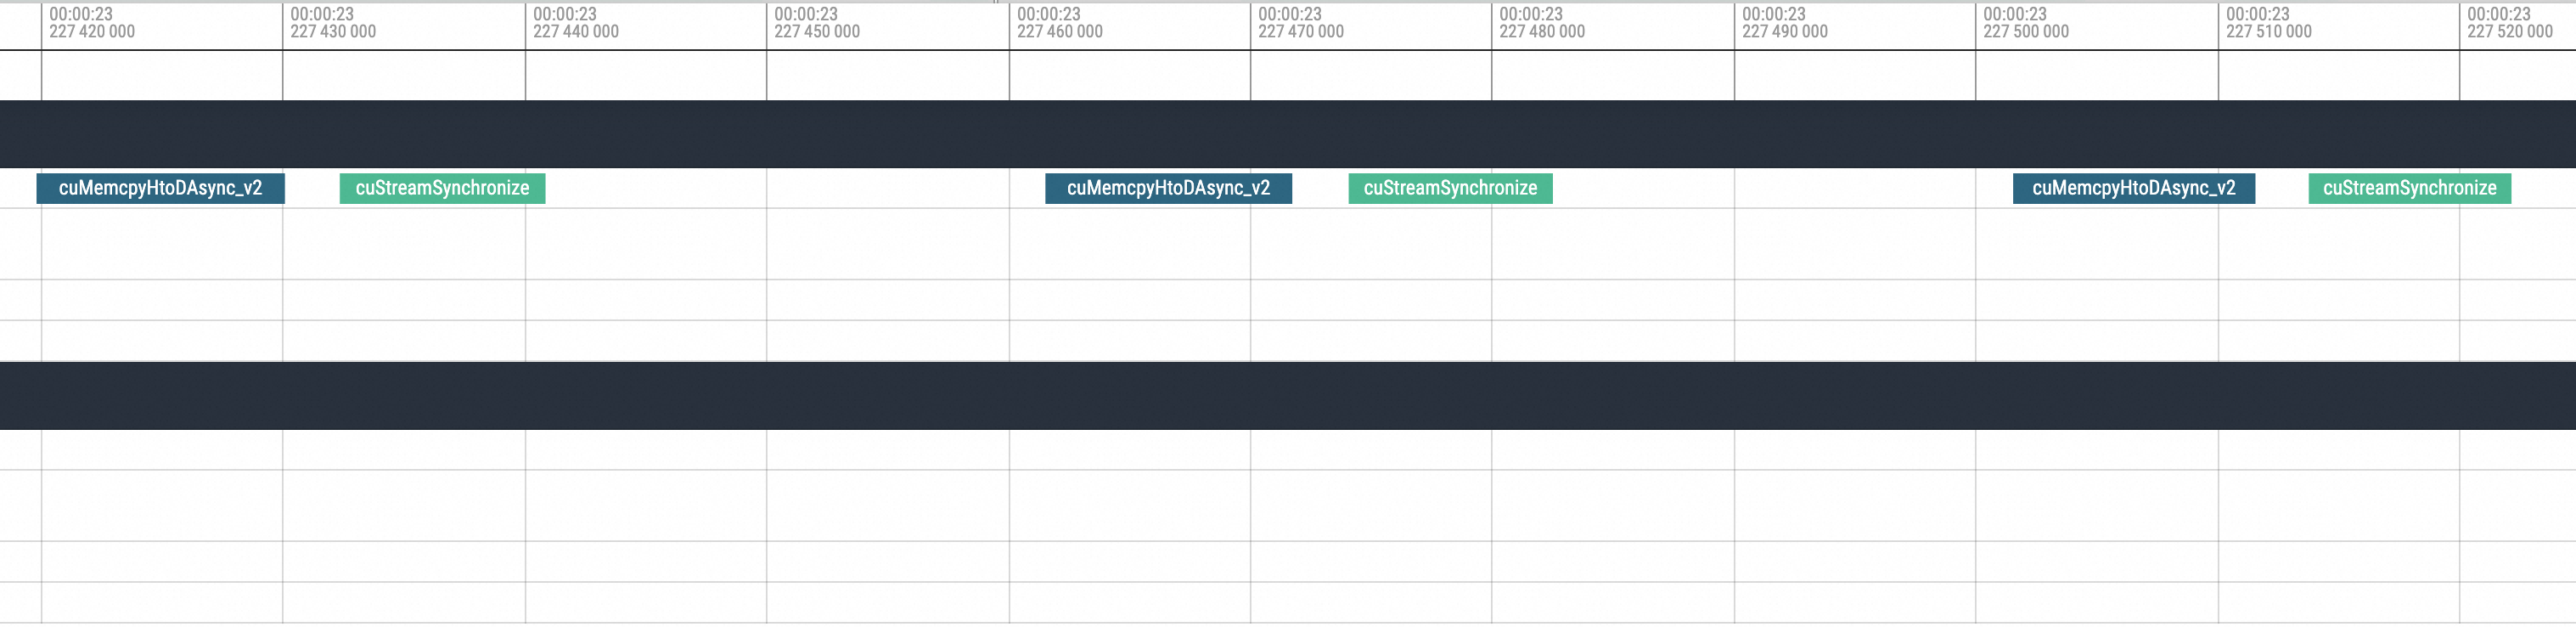
Zoom in on the corresponding position. You can see that the first operation executed after the hang recovery is the NCCL broadcast, followed by subsequent standard actions. Based on this phenomenon, the problem is caused by the NCCL hang.