Log service allows you to collect and analyze NGINX access logs. This topic describes how to monitor, analyze, diagnose, and optimize access to a website.
Prerequisites
Log data is collected. For more information, see Collect logs in NGINX configuration mode.
The indexing feature is enabled and configured. For more information, see Create indexes.
Background information
NGINX is a free, open-source, and high-performance HTTP server that you can use to build and host websites. NGINX access logs can be collected and analyzed. In traditional methods such as CNZZ, a JavaScript script is inserted into the frontend page of a website and is triggered when a user visits the website. However, this method can record only access requests. Stream computing, offline computing, and offline analysis can also be used to analyze NGINX access logs. However, those methods require a dedicated environment and it can be difficult to balance time efficiency and flexibility during log analysis.
In the Simple Log Service console, you can create a collection configuration to collect NGINX access logs by using the data import wizard. Then, Simple Log Service creates indexes and an NGINX dashboard to help you collect and analyze NGINX access logs. The dashboard displays metrics such as Distribution of IP Addresses, HTTP Status Codes, Request Methods, page view (PV) and unique visitor (UV) Statistics, Inbound and Outbound Traffic, User Agents, Top 10 Request URLs, Top 10 URIs by Number of Requests, and Top 10 URIs by Request Latency. You can use query statements to analyze the access latency of your website and optimize the performance of your website at the earliest opportunity. You can create alerts to track performance issues, server errors, and traffic changes. If the trigger conditions of an alert are met, alert notifications are sent to the specified recipients.
Analyze access to a website
Log on to the Simple Log Service console.
In the Projects section, click the project that you want to manage.

In the left-side navigation pane, choose . Find the Logstore and click the > icon next to it.
Click the > icon next to Visual Dashboards, and then click LogstoreName_Nginx_access_log.
The dashboard displays the following metrics:
Distribution of IP Addresses: collects statistics on the distribution of IP addresses by executing the following SQL statement:
* | select count(1) as c, ip_to_province(remote_addr) as address group by address limit 100HTTP Status Codes: calculates the percentage of each HTTP status code returned in the last 24 hours by executing the following SQL statement:
 * | select count(1) as pv,
         status
         group by status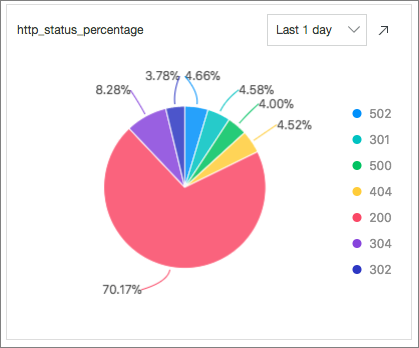
Request Methods: calculates the percentage of each request method used in the last 24 hours by executing the following SQL statement:
* | select count(1) as pv ,request_method group by request_method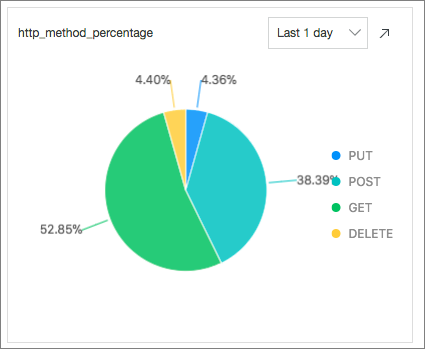
User Agents: calculates the percentage of each user agent used in the last 24 hours by executing the following SQL statement:
* | select count(1) as pv, case when http_user_agent like '%Chrome%' then 'Chrome' when http_user_agent like '%Firefox%' then 'Firefox' when http_user_agent like '%Safari%' then 'Safari' else 'unKnown' end as http_user_agent group by case when http_user_agent like '%Chrome%' then 'Chrome' when http_user_agent like '%Firefox%' then 'Firefox' when http_user_agent like '%Safari%' then 'Safari' else 'unKnown' end order by pv desc limit 10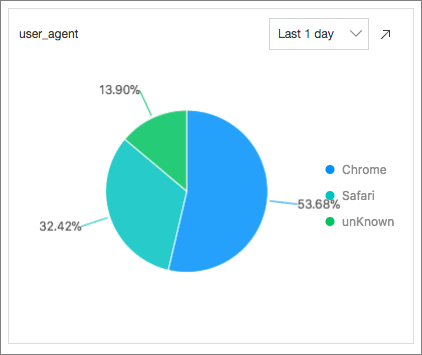
Top 10 Request URLs: indicates the top 10 request URLs with the most PVs in the last 24 hours by executing the following SQL statement:
* | select count(1) as pv , http_referer group by http_referer order by pv desc limit 10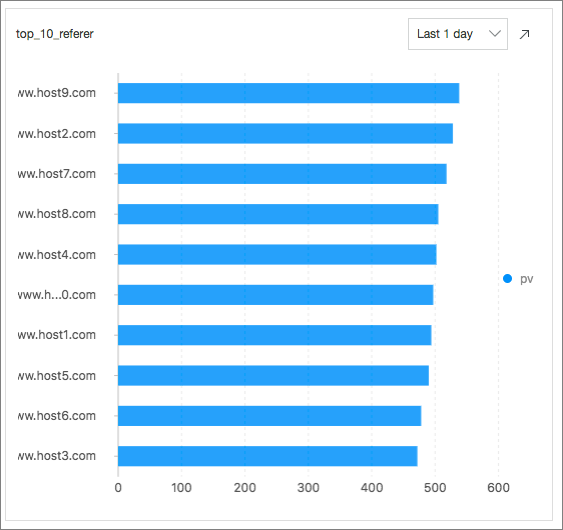
Inbound and Outbound Traffic: collects statistics on the inbound and outbound traffic by executing the following SQL statement:
* | select sum(body_bytes_sent) as net_out, sum(request_length) as net_in ,date_format(date_trunc('hour', __time__), '%m-%d %H:%i') as time group by date_format(date_trunc('hour', __time__), '%m-%d %H:%i') order by time limit 10000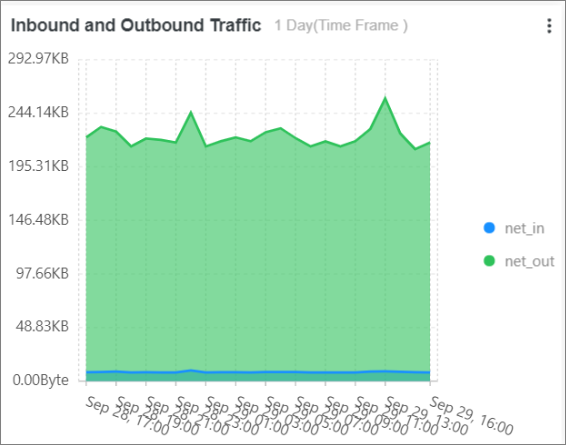
PV and UV Statistics: calculates the number of PVs and UVs by executing the following SQL statement:
*| select approx_distinct(remote_addr) as uv ,count(1) as pv , date_format(date_trunc('hour', __time__), '%m-%d %H:%i') as time group by date_format(date_trunc('hour', __time__), '%m-%d %H:%i') order by time limit 1000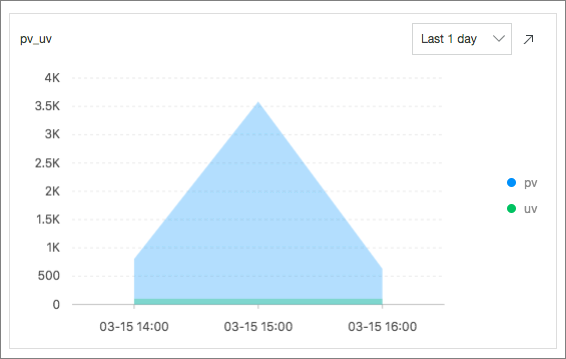
Predicted PV: predicts the number of PVs in the next 4 hours by executing the following SQL statement:
* | select ts_predicate_simple(stamp, value, 6, 1, 'sum') from (select __time__ - __time__ % 60 as stamp, COUNT(1) as value from log GROUP BY stamp order by stamp) LIMIT 1000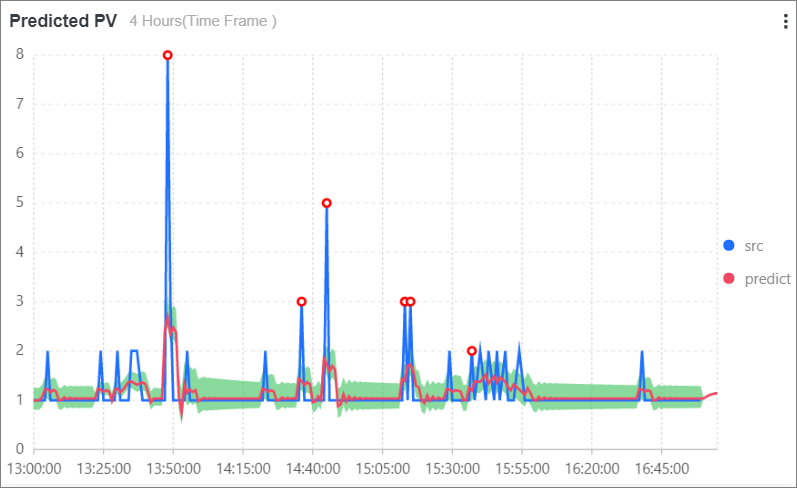
Top 10 URLs by Number of Requests: indicates the top 10 requested URLs with the most PVs in the last 24 hours by executing the following SQL statement:
* | select count(1) as pv, split_part(request_uri,'?',1) as path group by path order by pv desc limit 10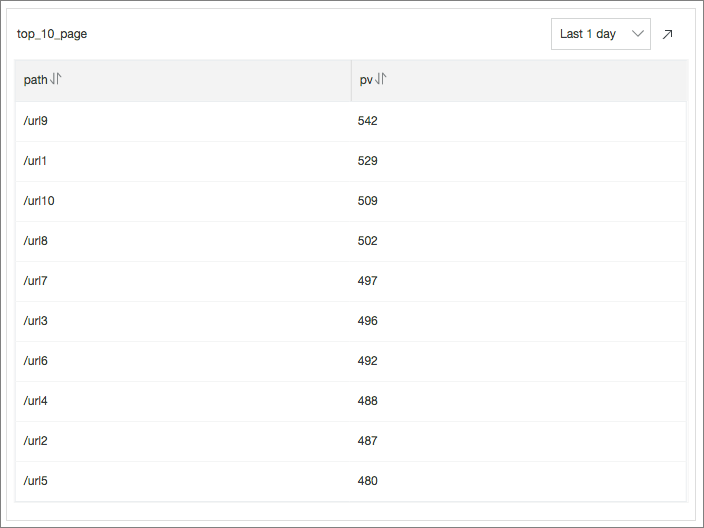
Diagnose and optimize access to a website
In addition to some default access metrics, you must also diagnose access requests based on NGINX access logs. This allows you to locate requests that have high latency on specific pages. You can use the quick analysis feature on the Search & Analysis page. For more information, see Guide to log query and analysis.
Count the average latency and highest latency every 5 minutes to obtain the overall latency by executing the following SQL statement:
  * | select from_unixtime(__time__ -__time__% 300) as time,
          avg(request_time) as avg_latency ,
          max(request_time) as max_latency
          group by __time__ -__time__% 300
Locate the requested page with the highest latency and optimize the response speed of the page by executing the following SQL statement:
  * | select from_unixtime(__time__ - __time__% 60) ,
          max_by(request_uri,request_time)
          group by __time__ - __time__%60
Divide all the requests into 10 groups by access latency and count the number of requests based on different latency ranges by executing the following SQL statement:
* |select numeric_histogram(10,request_time)Count the top 10 requests with the highest latency and the latency of each request by executing the following SQL statement:
* | select max(request_time,10)Optimize the requested page with the highest latency.
Assume that the /url2 page has the highest latency. To optimize the response speed of the /url2 page, count the following metrics for the /url2 page: number of PVs and UVs, number of times that each request method is used, number of times that each HTTP status code is returned, number of times that each browser type is used, average latency, and highest latency.
   request_uri:"/url2" | select count(1) as pv,
          approx_distinct(remote_addr) as uv,
          histogram(method) as method_pv,
          histogram(status) as status_pv,
          histogram(user_agent) as user_agent_pv,
          avg(request_time) as avg_latency,
          max(request_time) as max_latency
Compare the PVs for today and yesterday:
* |
select
  diff [1] as today,
  round((diff [3] -1.0) * 100, 2) as growth
FROM
  (
    SELECT
      compare(pv, 86400) as diff
    FROM
      (
        SELECT
          COUNT(1) as pv
        FROM
          log
      )
  )
Calculate the day-on-day comparison of PVs for today and yesterday:
* |
select
  t,
  diff [1] as today,
  diff [2] as yestoday,
  diff [3] as percentage
from(
    select
      t,
      compare(pv, 86400) as diff
    from
      (
        select
          count(1) as pv,
          date_format(from_unixtime(__time__), '%H:%i') as t
        from
          log
        group by
          t
        limit
          10000
      )
    group by
      t
    order by
      t
    limit
      10000
  )
Create alert rules
You can create alert rules to track performance issues, server errors, and traffic changes. For more information, see Configure an alert rule.
Server alerts
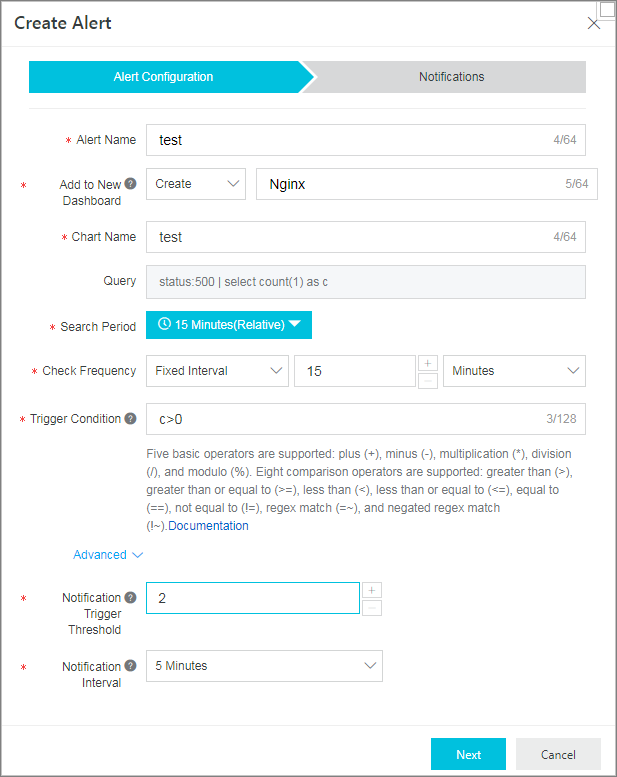
You need to focus on server errors whose HTTP status code is 500. You can execute the following SQL statement to query the error number c per unit time and set the trigger condition of the alert rule to c > 0.
status:500 | select count(1) as cNoteFor services with high access traffic, 500 errors could occur on occasion. In this case, you can set the Notification Trigger Threshold parameter to 2. It indicates that an alert is triggered only when conditions are met two consecutive times.
Performance alerts
You can create alert rules if the latency increases when the server is running. For example, you can calculate the latency of all the write requests
Postof the operation/adduserby executing the following SQL statement. Then set the alert rule to l > 300000. It indicates that an alert is sent when the average latency exceeds 300 ms.Method:Post and URL:"/adduser" | select avg(Latency) as lYou can use the average latency value to create an alert. However, high latency values are averaged to lower values, so this might not reflect the true situation. You can use the percentile in mathematical statistics (the highest latency is 99%) as the trigger condition.
Method:Post and URL:"/adduser" | select approx_percentile(Latency, 0.99) as p99You can calculate the latency of every minute in a day (1,440 minutes), the 50th percentile latency, and the 90th percentile latency.
* | select avg(Latency) as l, approx_percentile(Latency, 0.5) as p50, approx_percentile(Latency, 0.99) as p99, date_trunc('minute', time) as t group by t order by t desc limit 1440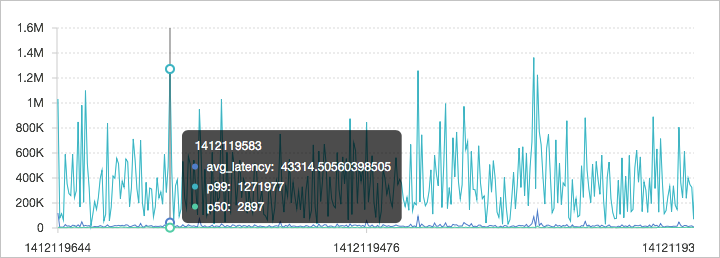
Traffic alerts
A sudden decrease or increase of traffic in a short time period is abnormal. You can calculate the traffic change ratio and create alert rules to monitor sudden traffic changes. Sudden traffic changes are detected based on the following metrics:
Previous time period: compares data in the current time period with that in the previous time period.
Same time period on the previous day: compares data in the current time period with that of the same time period of the previous day.
Same time period of the previous week: compares data in the current time period with that of the same time period of the previous week.
Last window is used in the following example to calculate the traffic change ratio. In this example, the time range is set to 5 minutes.
Define a calculation window.
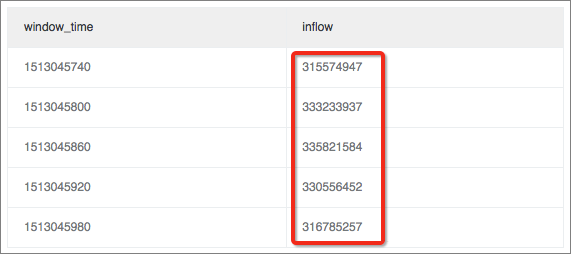
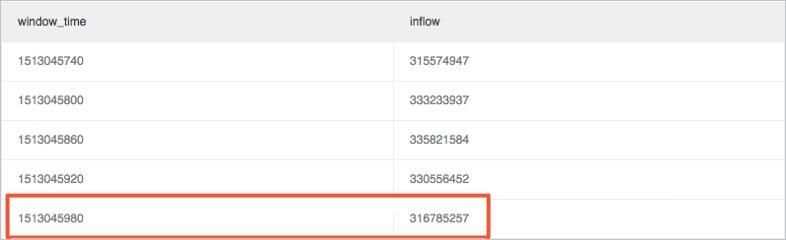
Define a window of 1 minute to calculate the inbound traffic size of this minute.
* | select sum(inflow)/(max(__time__)-min(__time__)) as inflow , __time__-__time__%60 as window_time from log group by window_time order by window_time limit 15The result indicates that the average inbound traffic is evenly distributed in every window.
Calculate value differences in the window.
Calculate the difference between the maximum or minimum traffic size and the average traffic size in the window. The max_ratio metric is used as an example.
The calculated max_ratio is 1.02. You can set the alert rule to max_ratio > 1.5. It indicates that an alert is sent when the change ratio exceeds 50%.
* | select max(inflow)/avg(inflow) as max_ratio from (select sum(inflow)/(max(__time__)-min(__time__)) as inflow , __time__-__time__%60 as window_time from log group by window_time order by window_time limit 15)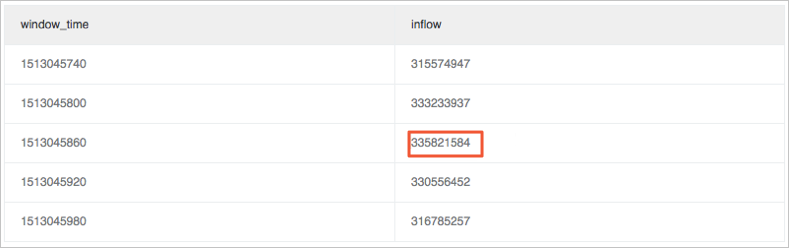
Calculate the latest_ratio metric to check whether the latest value fluctuates.
Use the max_by function to calculate the maximum traffic size in the window. In this example, latest_ratio is 0.97.
* | select max_by(inflow, window_time)/1.0/avg(inflow) as latest_ratio from (select sum(inflow)/(max(__time__)-min(__time__)) as inflow , __time__-__time__%60 as window_time from log group by window_time order by window_time limit 15)NoteThe calculation result of the max_by function is of the character type. It must be converted to the numeric type. To calculate the relative ratio of changes, you can replace the SELECT clause with (1.0-max_by(inflow, window_time)/1.0/avg(inflow)) as latest_ratio.
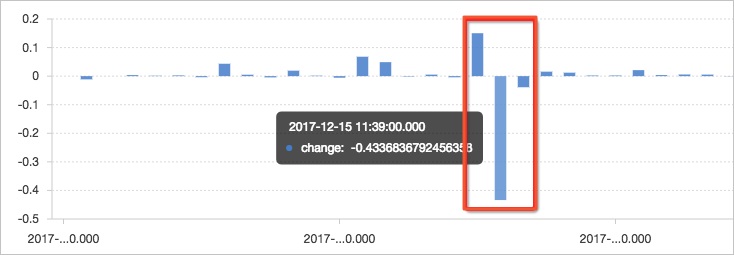
Calculate the fluctuation ratio. It is the change ratio between the current value and the previous value of the window.
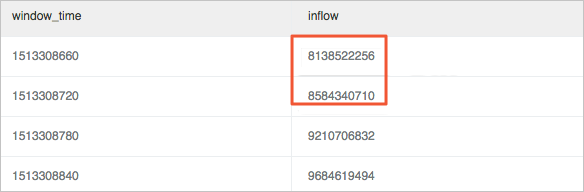
Use the window function (lag) for calculation. Extract the current inbound traffic and the inbound traffic of the previous cycle to calculate the difference by using lag(inflow, 1, inflow)over(). Then, divide the calculated difference value by the current value to obtain the change ratio. In this example, a relatively major decrease occurs in traffic at 11:39, with a change ratio of more than 40%.
NoteTo define an absolute change ratio, you can use the ABS function to calculate the absolute value and unify the calculation result.
* | select (inflow- lag(inflow, 1, inflow)over() )*1.0/inflow as diff, from_unixtime(window_time) from (select sum(inflow)/(max(__time__)-min(__time__)) as inflow , __time__-__time__%60 as window_time from log group by window_time order by window_time limit 15)