This topic describes the causes and solutions for the latency during data replication between a primary ApsaraDB RDS for MySQL instance and its read-only RDS instances.
Problem description
Read-only RDS instances use the native log-based asynchronous or semi-asynchronous replication mechanism of MySQL to synchronize data from their primary RDS instance. This mechanism causes a replication latency. The replication latency causes data inconsistencies between the read-only and primary RDS instances and affects your workloads. The replication latency may also cause log accumulation. As a result, the accumulated logs quickly exhaust the storage capacity of the read-only RDS instance.
If many logs are being generated for the primary RDS instance, its read-only RDS instances may be locked.
The replication latency is shown in the second_behind_master field (in seconds) of the output from the
show slave status \Gcommand.Latency calculation: Latency = Current time - The point in time when the transaction that is being applied on the secondary instance was committed on the primary instance. The current time indicates the point in time when you execute the
show slave status \Gcommand.
The replication latency can be classified into the following types based on the duration of the latency:
Latency less than or equal to 1 second. This type of latency is caused by the calculation accuracy, calculation method, sampling point, and monitoring granularity. If this type of latency occurs, the data replication runs as normal, and you can ignore the issue.
Latency greater than 1 second. This type of latency occurs in the following scenarios: The specifications of the read-only RDS instance are low, the transactions per second (TPS) of the primary RDS instance is large, large transactions exist on the primary RDS instance, and DDL statements on the primary RDS instance are executed for a long period of time. If this type of latency occurs, you must identify the cause and resolve the issue.
Causes
Causes for the latency less than or equal to 1 second
Latency less than 1 second: The monitoring time range is set to a large value. No actual latency of this type occurs, and you can ignore the issue.
If the specified monitoring time range covers a long period of time, the monitoring granularity is large. For example, if the monitoring time range is 3 hours, the default monitoring granularity may be up to 30 seconds. The data that is calculated each time is the average value in a 30-second period, and a latency of less than 1 second may be reported. However, the minimum granularity of the latency that is calculated is 1 second.
To obtain a more accurate latency, you can log on to the ApsaraDB RDS console, go to the Performance Trends tab, and then set the monitoring time range to a value that is less than 6 minutes. This way, you can view the latency with the monitoring granularity of 1 second. For more information, see Use the dashboard feature for an ApsaraDB RDS for MySQL instance.
Latency of 1 second: This type of latency is caused by the calculation accuracy, calculation method, sampling point, and cross-second transactions. No actual latency of this type occurs, and you can ignore the issue.
In ApsaraDB RDS for MySQL, sampling points are always rounded down to the nearest second. For example, a sampling point of 00:00:00.95 is considered a sampling point of 00:00:00, and a sampling point of 00:00:01.05 is considered a sampling point of 00:00:01. For example, if the sampling point crosses over into the next second, the latency is calculated as 1 second regardless of whether the actual latency is less than 1 second. This is shown in row 4 of the following table.
Transaction
Commit time on the primary RDS instance
Commit time on the secondary RDS instance
Current time (point in time when you execute the SHOW SLAVE STATUS \G statement)
Latency accurate to seconds
Trx1
00:00:00.30
00:00:00.50
00:00:00.35
0(0.35) - 0(0.3) = 0
00:00:00.45
0(0.45) - 0(0.3) = 0
Trx2
00:00:00.90
00:00:01.10
00:00:00.95
0(0.95) - 0(0.9) = 0
00:00:01.05
1(1.05) - 0(0.9) = 1
Data is collected at intervals of 1 second, and each sampling point crosses over into the next second. If the workloads are heavy or cross-second transactions exist, a latency of 1 second may be obtained at each sampling point. If the sampling point does not cross over into the next second, such as 00:00:00.95, a latency of 0 seconds is obtained, as shown in row 3 in the preceding table.
Causes for the latency greater than 1 second
This type of latency may occur due to the following causes:
Cause 1: Low specifications of read-only RDS instances
The specifications of a read-only RDS instance are lower than the specifications of its primary RDS instance, and the workloads on the read-only RDS instance are heavy. For example, the IOPS of the read-only RDS instance is high. For data consistency purposes, the read-only RDS instance uses the native log-based replication mechanism of MySQL to synchronize data from the primary RDS instance. This mechanism starts an I/O thread and an SQL thread. The I/O thread reads the logs from the primary RDS instance, and the SQL thread applies the logs to the read-only RDS instance. Both threads consume the I/O resources of the read-only RDS instance. If the read-only RDS instance cannot provide sufficient resources to maintain a suitable IOPS, a data synchronization latency occurs between the read-only and primary RDS instances. You can log on to the ApsaraDB RDS console and view the IOPS on the Monitoring and Alerting page.
Cause 2: High TPS of the primary RDS instance
A read-only RDS instance uses a thread to synchronize data from the primary RDS instance. If the primary RDS instance processes concurrent multi-thread writes and the TPS of the primary RDS instance is significantly high, a data synchronization latency occurs between the read-only and primary RDS instances.
Cause 3: Large transactions
A transaction that performs operations such as UPDATE, DELETE, INSERT...SELECT, and REPLACE...SELECT on a large volume of data is executed on the primary RDS instance. A large amount of log data is generated and needs to be sent to the read-only RDS instance. The read-only RDS instance requires the same period of time as the primary RDS instance to complete the transaction. This causes a data synchronization latency. For example, if you perform a deletion operation that lasts 80 seconds on the primary RDS instance, it also requires 80 seconds for the read-only RDS instance to complete the same operation. As a result, a data synchronization latency occurs.
Concurrent transactions on multiple tables are supported. However, only one thread can be used to replicate transactions on a table. This prolongs the replication period.
Cause 4: DDL statements executed for a long period of time on the primary RDS instance
Data synchronization between a read-only RDS instance and its primary RDS instance is performed in sequence. If a DDL statement is executed on a large table for a long period of time or many slow queries are executed on the primary RDS instance, many temporary tables are generated. This causes insufficient storage and increases disk I/O, and a latency occurs. Common DDL statements include CREATE INDEX, REPAIR TABLE, and ALTER TABLE ADD COLUMN.
Queries or ongoing transactions that are performed on a read-only RDS instance block the DDL statements that are synchronized from the primary RDS instance.
Special cases
No appropriate indexes are available for SQL statements that are executed to replicate data. As a result, many full table scans are performed and the number of logical reads significantly increases.
If a table has only a unique index with a NULL value and has no primary keys, the execution plan for the unique index rather than the execution plan selected by an optimizer is preferentially used when the secondary RDS instance replicates data. This applies even if you use the WHERE clause to specify query conditions.
Identification methods
If the latency is less than or equal to 1 second, you can ignore the issue. This section describes how to identify the cause of a latency that is greater than 1 second.
The read-only instance specification is too small
View the instance type of the read-only RDS instance in the Configuration Information section of the Basic Information page of the read-only RDS instance in the ApsaraDB RDS console. For more information, see Instance types for standard read-only ApsaraDB RDS for MySQL instances (original x86 architecture) and Instance types for YiTian read-only ApsaraDB RDS for MySQL instances (original ARM architecture).
View monitoring information, including the CPU utilization, memory usage, I/O bandwidth, and number of connections, on the Monitoring and Alerts page of the read-only RDS instance in the ApsaraDB RDS console. Then, check whether resource bottlenecks exist in the read-only RDS instance based on the monitoring information.
The transactions per second (TPS) of the primary instance is too high.
View the TPS of the primary or read-only RDS instance on the Dashboard page of the RDS instance. For more information, see Use the dashboard feature for an ApsaraDB RDS for MySQL instance
Large transaction writes
When a large transaction is synchronized to a read-only instance and causes a latency, log on to the database and execute the
show slave status \GSQL statement. If the value of theSeconds_Behind_Masterparameter continuously changes while the value of theExec_Master_Log_Posparameter remains unchanged, it indicates that the SQL thread of the read-only instance is executing a large transaction or a DDL operation. An output similar to the following figure is displayed: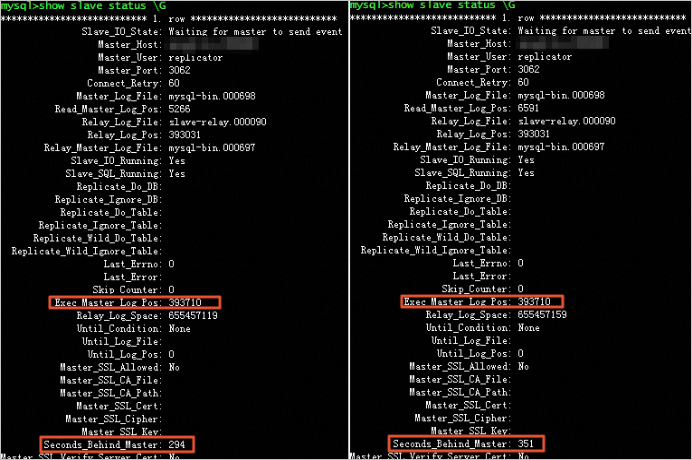
Finally, run the
show processlist;statement to identify the specific thread.Execute the
show slave status \Gstatement on the read-only instance to determine whether metadata locks exist.If the binary logging format is set to ROW, large transactions result in large binary log files. You can run the
SHOW BINARY LOGS;command to view the value of File_size. If the value is greater than the value of the `max_binlog_size` parameter, large transactions exist.
The execution time of a DDL statement on the primary instance is long.
Check the volume of binary logs on the read-only RDS instance to determine whether DDL operations exist. If binary log files are not truncated in a timely manner, large binary log files are generated.
Check whether tables without a primary key are being deleted or updated on the read-only instance. You can execute the
show engine innodb status \Gstatement to check, or execute theshow open tables;statement and check the output for tables that have a value of 1 in the in_use column.View information about slow query logs to check whether DDL operations, such as OPTIMIZE, ALTER, REPAIR, and CREATE, exist. For more information, see Slow query log analysis.
Identification method for Cause 5 (unique key with a NULL value)
Use the sys.schema_index_statistics view to check whether the table has no primary keys and has only a unique index.
Check whether the unique index contains a NULL value.
Solutions
Before you perform high-risk operations, such as modifying the configurations or data of an instance, we recommend that you check the disaster recovery and fault tolerance capabilities of the instance to ensure data security.
Before you modify the configurations or data of an instance, such as an Elastic Compute Service (ECS) instance or an RDS instance, we recommend that you create snapshots or enable the backup feature for the instance. For example, you can enable log backup for an RDS instance.
If you granted the permissions on sensitive information or submitted sensitive information in the Alibaba Cloud Management Console, we recommend that you modify the sensitive information at the earliest opportunity. Sensitive information includes usernames and passwords.
This section describes common handling methods. You can use one of the following methods based on the identified cause:
The read-only instance specification is too small
We recommend that you upgrade the specifications of the read-only RDS instance and make sure that the specifications of the read-only RDS instance are greater than or equal to the specifications of its primary RDS instance. This prevents the replication latency that is caused by small specifications of the read-only RDS instance. For more information, see Change the specifications of an ApsaraDB RDS for MySQL instance.
The TPS (transactions per second) of the primary instance is too high.
If the TPS of the primary RDS instance is high, optimize or split your transactions.
Large Transaction Writes
Split the large transaction into smaller ones. For example, you can add a WHERE clause in the DELETE statement to limit the volume of data that can be deleted at a time to split the deletion operation into smaller operations. This way, the read-only RDS instance can quickly complete the large transaction without a latency.
The execution time of DDL statements on the primary instance takes too long.
If the data synchronization latency on the read-only RDS instance is caused by DDL operations, we recommend that you perform the DDL operations during off-peak hours. You can use one of the following methods:
Service support: Enable the automatic storage expansion feature. You can also set the threshold for triggering a manual storage expansion to 90%. For more information, see How do I scale an ApsaraDB RDS instance?
SQL optimization: Enable SQL Explorer to check the performance of SQL statements on a regular basis. For more information, see Use the SQL Explorer and Audit feature on an ApsaraDB RDS for MySQL instance.
Load: Configure an alert rule for disk usage, configure automatic storage expansion, or manually upgrade the specifications.
If the DDL operations that are synchronized from the primary RDS instance are blocked on the read-only RDS instance, perform the following steps:
Execute the
show processlist;statement on the read-only instance and confirm that the status of the SQL thread is 'waiting for table metadata lock'.Run the kill command to terminate the session that caused the block on the read-only RDS instance to resume data synchronization between the read-only RDS instance and its primary RDS instance. For more information, see Use DMS to release metadata locks.
Special cases
Add an explicit primary key to a table that does not have a primary key.
FAQ
Why does a 1-second latency occur on some of my read-only RDS instances?
The collection procedures and startup time of read-only RDS instances are different from each other. If the sampling points on some read-only RDS instances cross over into the next second, a 1-second latency occurs. If the sampling points on some read-only RDS instances do not cross over into the next second, no 1-second latency occurs. For more information, see Causes for the latency less than or equal to 1 second.
If a 1-second latency occurs on my RDS instance, is my RDS instance affected?
No, your RDS instance is not affected. A 1-second latency does not indicate that an actual latency occurred on your RDS instance. For example, if the actual latency is 0.1 seconds but the sampling point crosses over into the next second, a 1-second latency is reported. In this case, the 1-second latency is caused by the calculation accuracy, calculation method, and sampling point. For more information, see Causes for the latency less than or equal to 1 second.
We recommend that you specify the read latency threshold for a proxy or to trigger an alert based on your business requirements. Make sure that the specified threshold value is greater than 1 second.
What do I do if the ReplicationInterrupted error message is displayed or the Slave_SQL_Running or Slave_IO_Running alert is reported for the read-only RDS instance?
A: You can troubleshoot the following three issues:
Check whether the storage capacity of the read-only RDS instance is sufficient.
If the storage capacity is insufficient, the read-only RDS instance cannot synchronize the binary logs of the primary RDS instance.
NoteYou can view the storage usage of the read-only RDS instance in the Usage Statistics section of the Basic Information page.
Check the replication latency.
If the replication latency continuously exceeds 5 seconds within 5 minutes, the latency of the read-only RDS instance is high, and an alert is triggered. If data is frequently written to the primary RDS instance or large transactions exist on the primary RDS instance, data replication may be interrupted.
NoteTo view the replication latency, perform the following operations: Go to the Basic Information page of the read-only RDS instance. In the left-side navigation pane of the page, click Monitoring and Alerts. On the Standard Monitoring tab, view the value of the Replication Latency of Secondary Instances(second) metric.
Check slow query logs.
Slow query logs significantly affect instance performance and may increase the replication latency.
NoteYou can use one of the following methods to check the slow query logs on the Basic Information page of the read-only RDS instance:
In the left-side navigation pane, click Logs. Then, check the slow query logs on the Slow Query Logs tab.
In the left-side navigation pane, choose Autonomy Services > Slow Query Logs to check the slow query logs.
If the replication interruption is not caused by the preceding causes, you can ignore the error. The system automatically checks the instances and resolve the replication interruption issue.