The cost insights feature of Container Service for Kubernetes (ACK) provides dashboards that display visualized information about the costs of your clusters, namespaces, node pools, and applications.
Prerequisites
The cost insights feature is enabled. For more information, see Enable cost insights.
Usage notes
After the cost insights feature is enabled, billing data is displayed at 08:00:00 (UTC+8) on the next day. You can click the drop-down list in the upper-right corner of a dashboard to change the time range of cost insights.
Platform
Log on to the ACK console. In the left navigation pane, click Clusters.
On the Clusters page, click the name of the cluster. In the left-side navigation pane, choose .
On the Cost Insights page, click different tabs to view dashboards.
Cluster dimension
Filter criteria

Feature | Number | Description |
Cluster cost analysis options | (1) | The following cluster cost analysis options are available:
Note The costs of applications in the cluster can be analyzed by namespace or pod. The application cost is calculated based on the bill amount of the resources. |
Cost allocation models | (2) | Cost allocation models include the single resource cost allocation model and weighted hybrid resource cost allocation model. For more information, see Cost estimation policies.
|
Time range | (3) | The time range of the data displayed in the dashboard. The default time range is the last 7 days. You can specify a time range to view the changes in costs and resources within the specified time period. |
Cluster cost overview
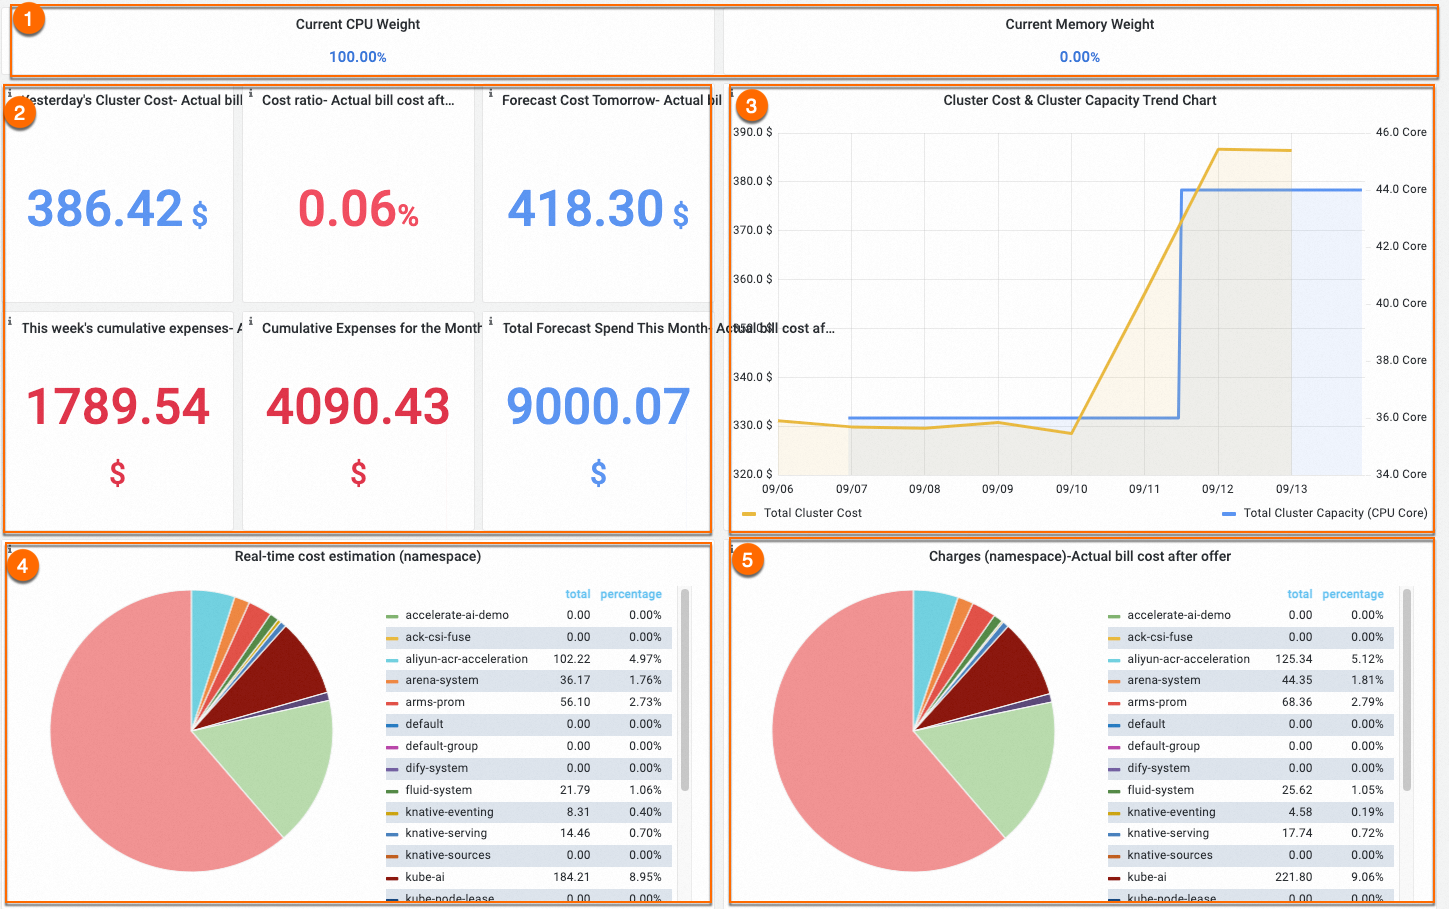
Feature | Number | Description |
View the cost allocation model | (1) | The displayed data depends on the cost allocation model that you selected. The CPU model is selected by default to estimate the cost of a pod based on the amount of CPU resources requested by the pod. |
The cost of the previous day, the cumulative cost of the week, and the cumulative cost of the month. | (2) | The cost of the previous day, the day-on-day ratio, the cumulative cost of the week, and the cumulative cost of the month are all calculated based on the bill amount of the cloud resources in the cluster. The weekly cumulative cost is calculated based on the bill amount of every calendar week and the monthly cumulative cost is calculated based on the bill amount of every calendar month. Bills are generated one day after the transaction date. Therefore, the cumulative cost of the week is zero on Monday of each week and the cumulative cost of the month is zero on the first day of each month. The day-on-day ratio is the ratio of the cost of the previous day to the cost of the day before the previous day. If the day-on-day growth rate is in green, it indicates that the cost of the previous day is reduced compared with the cost of the day before the previous day. If the day-on-day growth rate is in red, it indicates that the cost of the previous day is increased compared with the cost of the day before the previous day. |
Brief information about the cluster cost and resource waste. | (3) | The charts display changes in the cluster cost and cluster capacity. The yellow curve indicates the cluster cost and the blue curve indicates the actual cluster capacity. In most cases, the two curves are correlated with each other. If the two curves represent different trends, it indicates changes in the average cost of individual CPU cores. In this case, you can check whether resources of higher prices are consumed. |
Display the real-time estimated costs of namespaces and allocated cost of each namespace | (4) and (5) | Section (4) displays the real-time estimated cost of each namespace in the cluster. The cost of a namespace is the sum of costs of all pods in the namespace. Section (5) displays the allocated cost of each namespace, which is the cluster cost allocated to each namespace based on the specified cost ratio. Note
A cluster may contain nodes of different specifications and billing methods. When you allocate the cost based on namespaces, you must consider the price differences of nodes that host pods in different namespaces, not only the resource consumption of different namespaces. The cost insights feature converts the real-time cost of each node. The cost insights feature provides the following formula to calculate the cost of a namespace: Σ (Pod resource request/Node capacity) × Node unit price The formula can help you precisely calculate the cost of a namespace. However, due to the deferred billing policy applied when discounts, vouchers, or the subscription billing method is used, the cost calculated based on this formula may differ from the bill amount. To calculate the allocated cost of a namespace, you can multiply the total cluster cost by the cost ratio of the namespace. |
Stability and efficiency analysis
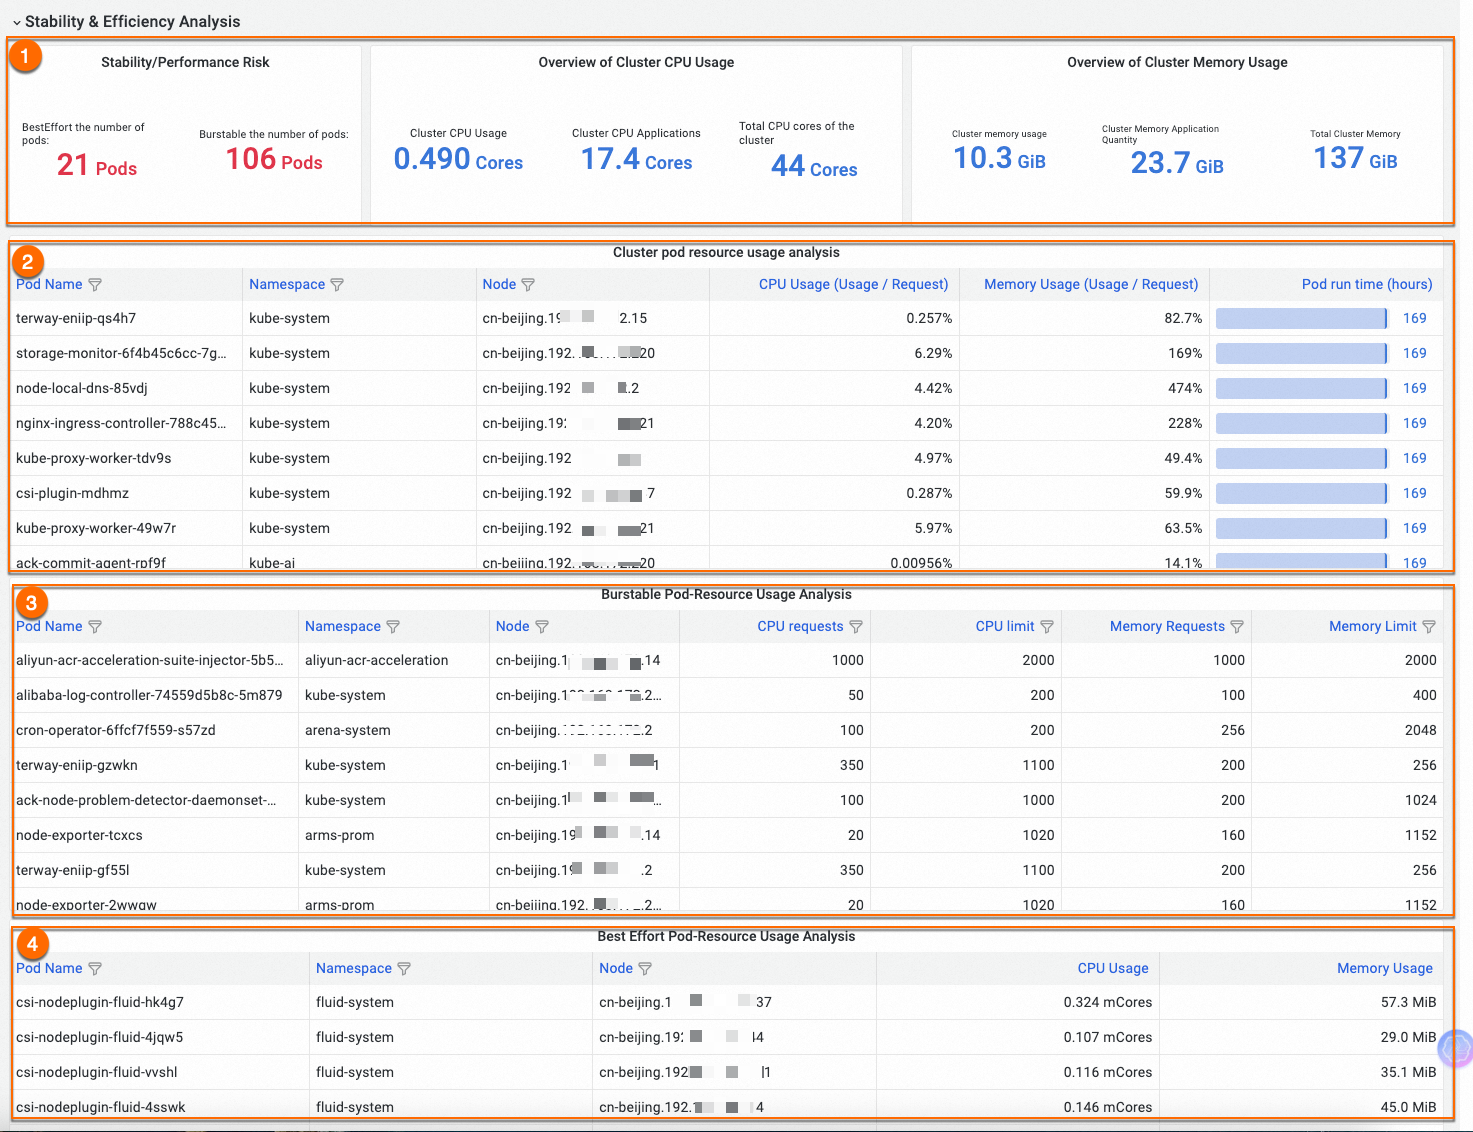
Feature | Number | Description |
Display the total resource usage of the cluster | (1) | Display the number of pods of each quality of service (QoS) class and the total resource usage in the cluster. |
Display the pod resource usage in the cluster | (2) | Display the basic information and resource usage (Usage/Request) of all pods in the cluster. Filtering and sorting are supported. You can use this feature to view the workloads with the highest or lowest resource usage in a cluster. |
Display the resource configurations of burstable pods in a cluster | (3) | Display the resource configurations of the pods whose QoS class is Burstable. Filtering and sorting are supported. This feature allows you to view the requests and limits of resources such as CPU and memory resources for each Burstable pod. This allows you to learn about the cluster resources consumed by pods and identify resource bottlenecks. |
Display the resource usage of BestEffort pods in a cluster | (4) | Display the resource configurations of the pods whose QoS class is BestEffort. This type of pod has a higher stability risk. You can filter and sort the list to check for any unexpected BestEffort pods. This allows you to address the risks at the earliest opportunity. |
For more information about Stability & Efficiency Analysis, see Use cost insights to identify risks for cluster workloads.
Cluster cost analysis
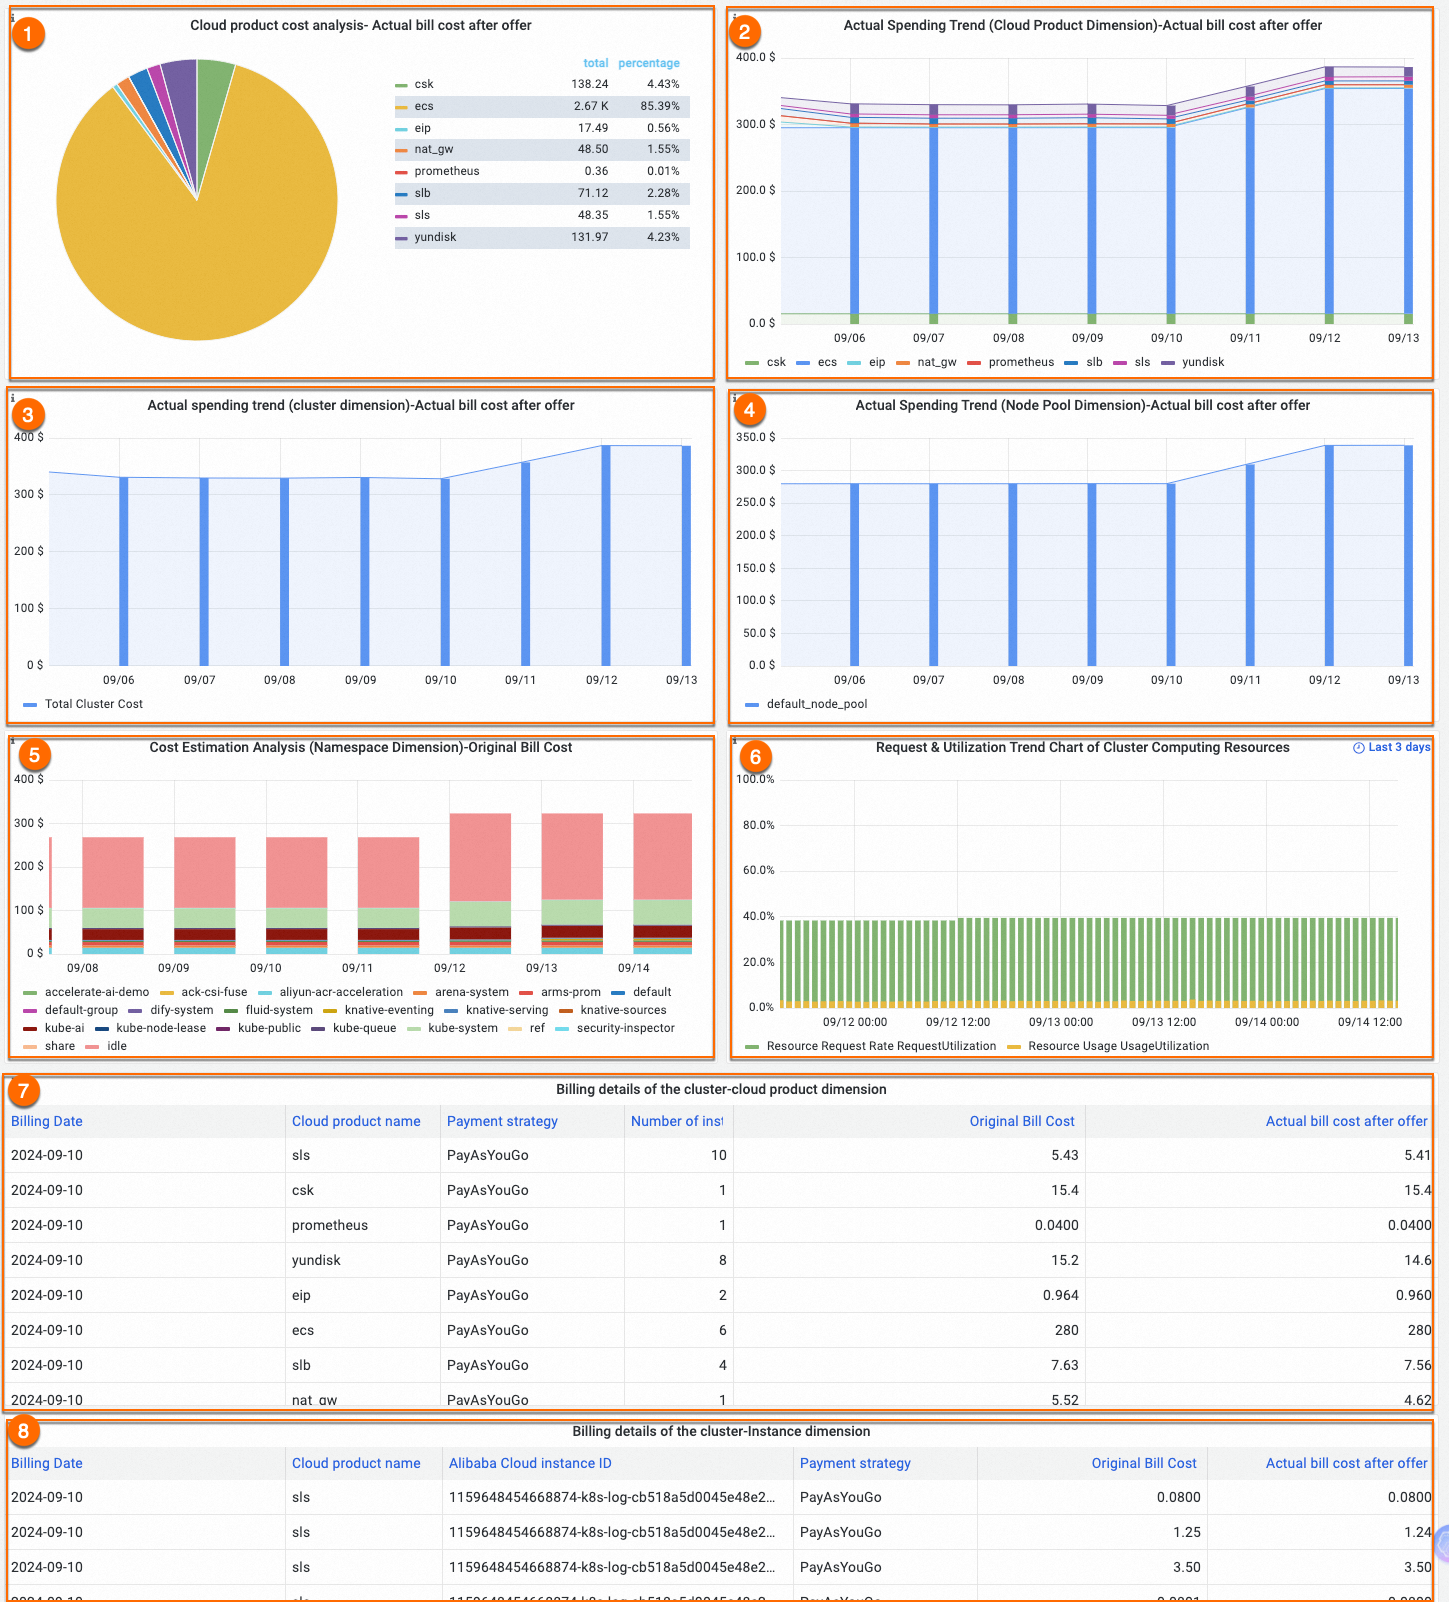
Feature | Number | Description |
Display changes in the cloud resource cost and the cost ratios of different cloud resources | (1) and (2) | Section (3) displays the cost ratios of different cloud resources in the cluster. Section (4) displays changes in the cloud resource cost. A cluster may use multiple cloud resources. The costs of cloud resources vary based on billing rules and how the cloud resources are used by the cluster. The cost insights feature displays the changes in the cloud resource cost and the cost ratios of different cloud resources to help you reduce the cost of the cluster. |
Display changes in the total cluster cost | (3) | Display daily changes in the total cluster cost. |
Display the costs of node pools | (4) | Display the cost of each node pool in the cluster or the cost of each virtual node. |
Display the trends in real-time estimated costs of namespaces | (5) | A cluster may contain nodes of different specifications and billing methods. When you allocate the cost based on namespaces, you must consider the price differences of nodes that host pods in different namespaces, not only the resource consumption of different namespaces. The cost insights feature converts the real-time cost of each node. The cost insights feature provides the following formula to calculate the cost of a namespace: Σ (Pod resource request/Node capacity) × Node unit price The formula can help you precisely calculate the cost of a namespace. However, due to the deferred billing policy applied when discounts, vouchers, or the subscription billing method is used, the cost calculated based on this formula may differ from the bill amount. To calculate the allocated cost of a namespace, you can multiply the total cluster cost by the cost ratio of the namespace. |
Display changes in the resource request and resource utilization of the cluster | (6) | Scenarios:
Histogram chart:
Resources that are allocated to applications but are not in use = Green column - Yellow column Allocatable cluster resources = Y-axis - Green column Analysis procedure:
|
Cluster billing details | (7) and (8) | A list of daily bills displayed by cloud resource or instance. |
Namespace dimension
The namespace dashboard allows you to filter namespaces and view resources and cost information by namespace. Namespaces are used to manage resources that belong to different departments or teams.
Filter criteria

Feature | Number | Description |
Namespaces | (1) | Select a namespace to analyze. The default value is ALL, which indicates that all namespaces in the cluster are selected. |
Cost allocation models | (2) | Cost allocation models include the single resource cost allocation model and weighted hybrid resource cost allocation model. For more information, see Cost estimation policies.
|
Namespace cost analysis options | (3) | The following cluster cost analysis options are available:
|
Time range | (4) | The time range of the data displayed in the dashboard. The default time range is the last 7 days. You can specify a time range to view the changes in costs and resources within the specified time period. |
Billing overview
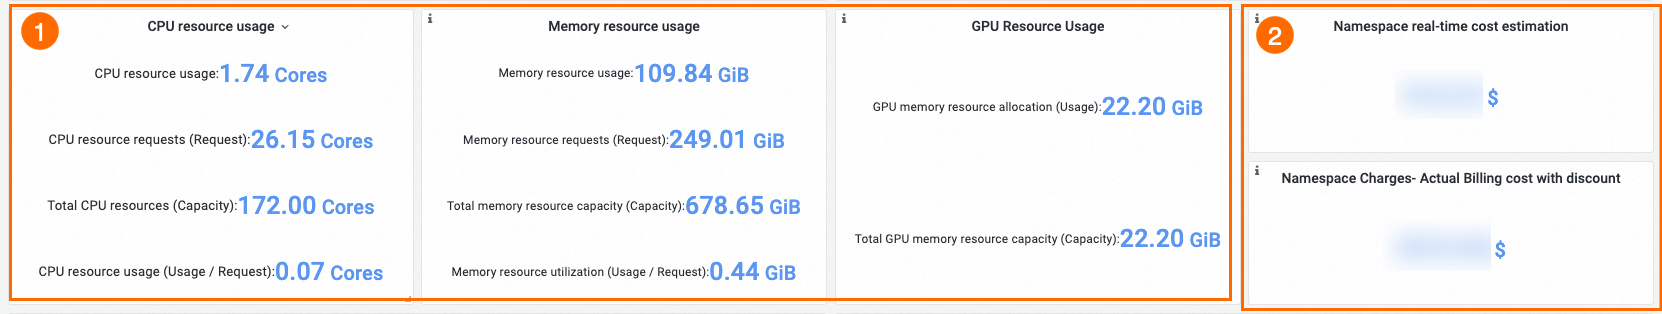
Feature | Number | Description |
Statistics, estimated costs, and allocated costs of resources in namespaces | (1) | You can identify resource waste in the namespace based on the CPU and memory metrics. Metrics:
|
(2) | Section (2) displays the cost statistics of the applications in the namespace.
|
Cost details and trends
Feature | Number | Description |
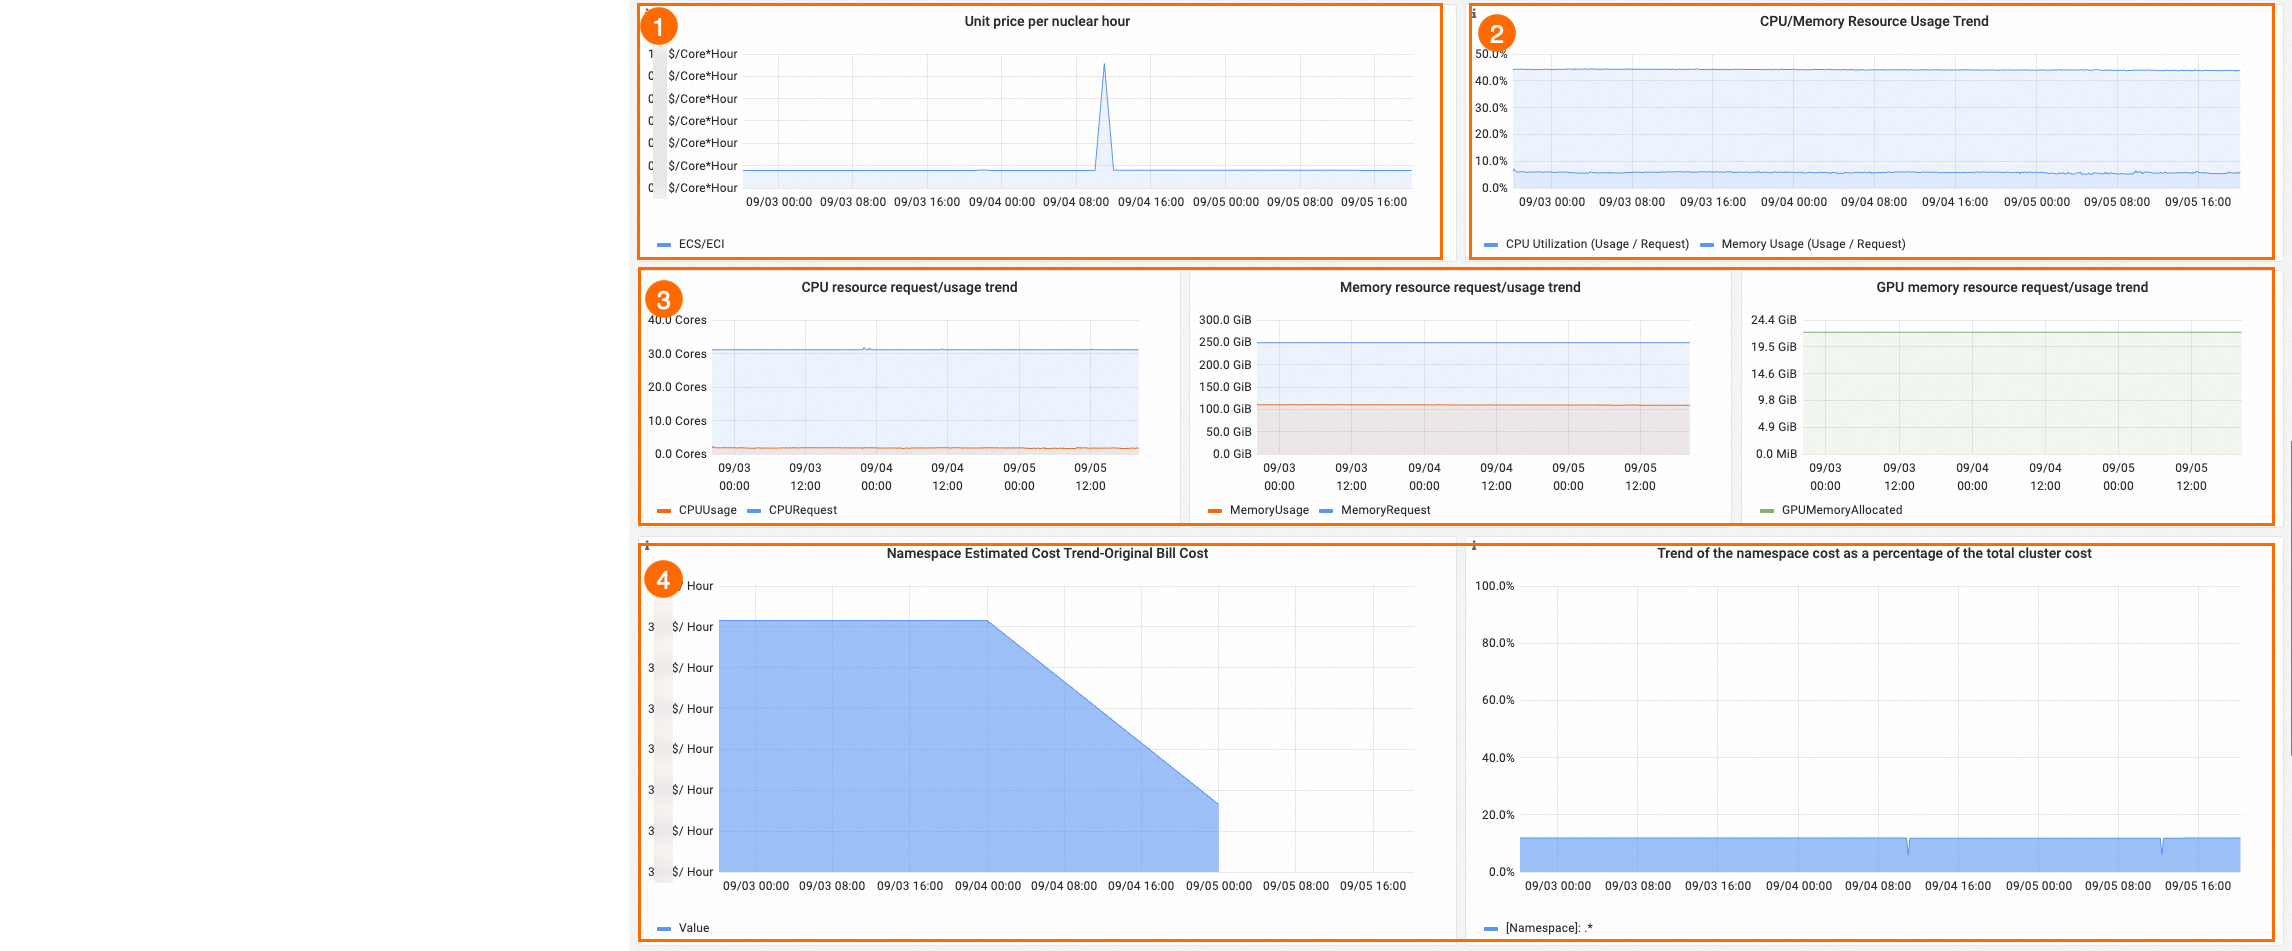
Unit price of core hours | (1) | Display changes in the unit price of core hours of the nodes that host the pods of the application. |
Changes in CPU and memory utilization | (2) | Display changes in the CPU and memory utilization of the namespace. |
Changes in the resource request and usage | (3) | Display changes in resource allocation and resource usage. The blue curve indicates changes in allocated resources and the red curve indicates changes in resources in use. A node reserves resources for pods during pod scheduling. The amount of resources occupied by container processes usually differs from the amount of allocated resources. The two curves can help you optimize resource allocation and avoid resource waste. |
Changes in costs of applications in the namespace | (4) | Display changes in the costs of applications in the namespace. The total cost is the bill amount of the namespace within the specified time range. The ratio of the namespace cost to the cluster cost. |
Feature | Number | Description |
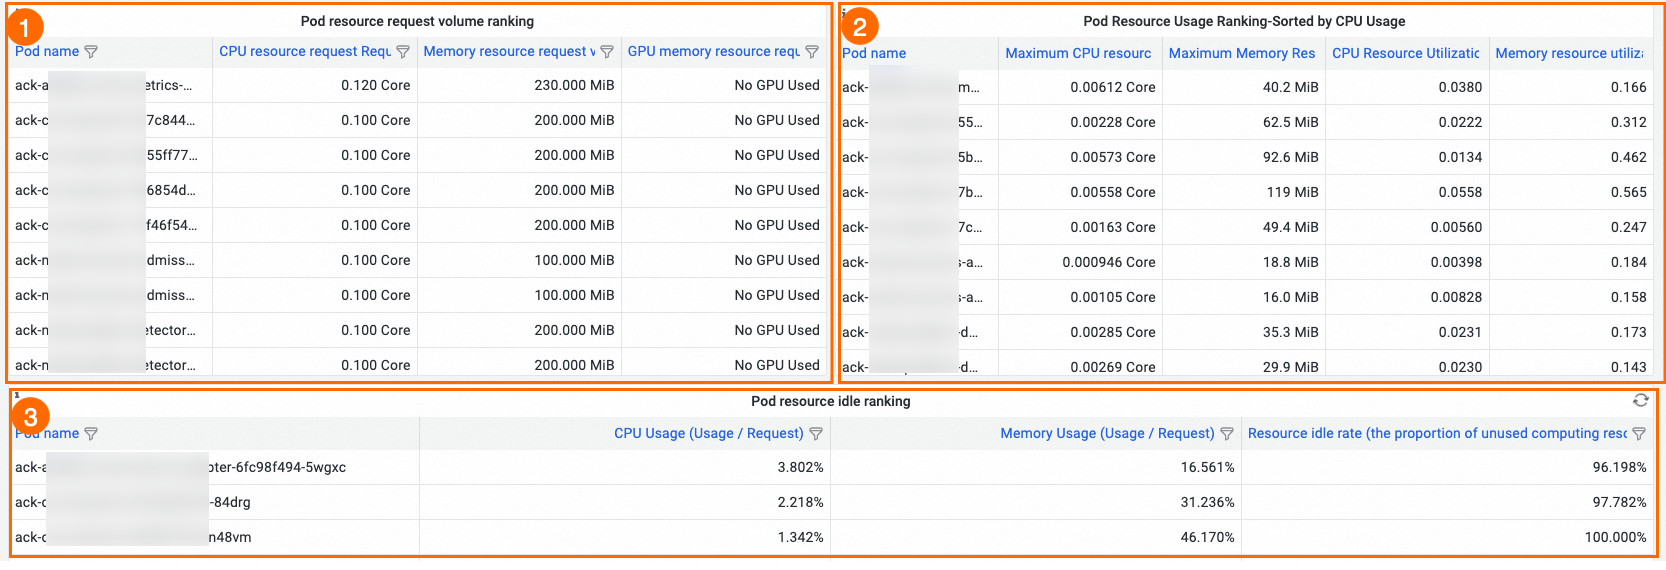
Pod ranking by resource requests | (1) | Sort pods based on resource requests to help you identify the application that requests the most resources and optimize resource allocation. |
Pod ranking by resource utilization | (2) | Sort pods based on resource utilization to help you identify the application with the lowest resource utilization and avoid resource waste. |
Pod ranking by idle resources | (3) | The idle resource ratio of a pod is the ratio of resources that are not used by the pod to the total resources allocated to the pod. The value helps you identify resource waste in the pod. By locating the pod that wastes the most resources in the namespace, you can identify the application that causes resource waste in the namespace, troubleshoot the issue, and then optimize resource allocation accordingly. |
Node pool dimension
The node pool dashboard displays the costs of cluster resources to help you analyze the use of node pools and choose a proper billing method.
You can analyze the costs of different node pools and then conduct cost control and governance. For example, GPU-accelerated node pools may belong to multiple departments. Therefore, it is difficult to analyze the cost by namespace. In this scenario, you can allocate cost by node pool and set cost optimization policies for different node pools.
Filter criteria

Feature | Number | Description |
Node pool cost analysis options | (1) | The following cluster cost analysis options are available:
|
Node pools | (2) | Select a node pool to analyze its cost. The default setting is All, which means that all node pools in the cluster are selected. |
Time range | (3) | The time range of the data displayed in the dashboard. The default time range is the last 7 days. You can specify a time range to view the changes in costs and resources within the specified time period. |
Billing overview
Feature | Number | Description |
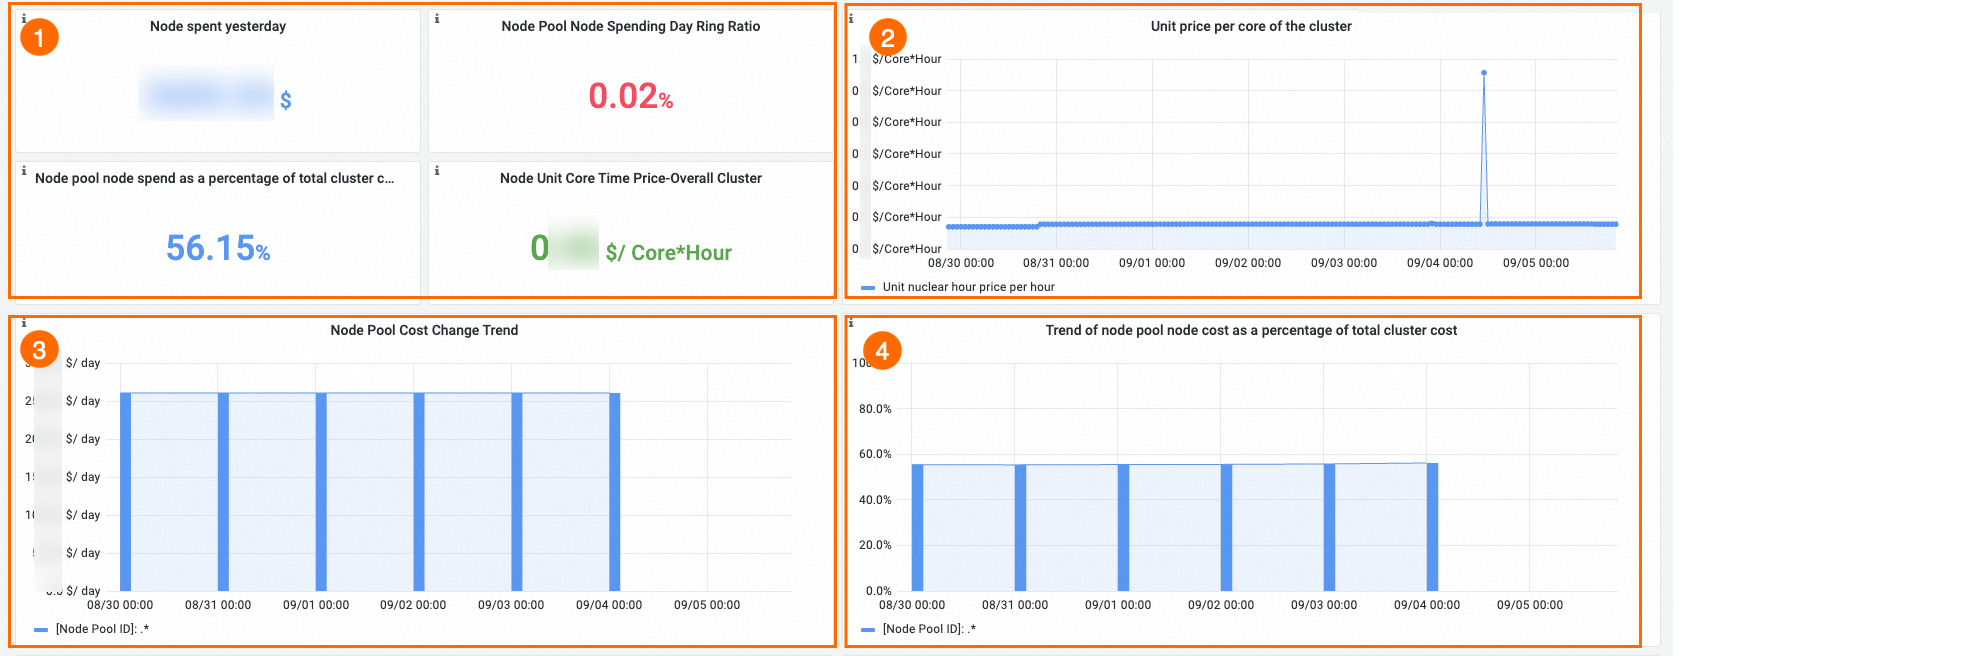
Node pool cost | (1) | If the day-on-day growth rate is in green, it indicates that the cost of the previous day is reduced compared with the cost of the day before the previous day. If the day-on-day growth rate is in red, it indicates that the cost of the previous day is increased compared with the cost of the day before the previous day. |
Unit price of core hours of nodes | (2) | Display changes in the unit price of core hours of the nodes in the node pool within a period of time. |
Changes in node costs and changes in the node pool cost ratio | (3) and (4) | Display changes in the costs of the nodes in the node pool, and changes in the ratio of the node pool cost to the total cluster cost. |
Billing methods and cost estimation
Feature | Number | Description |
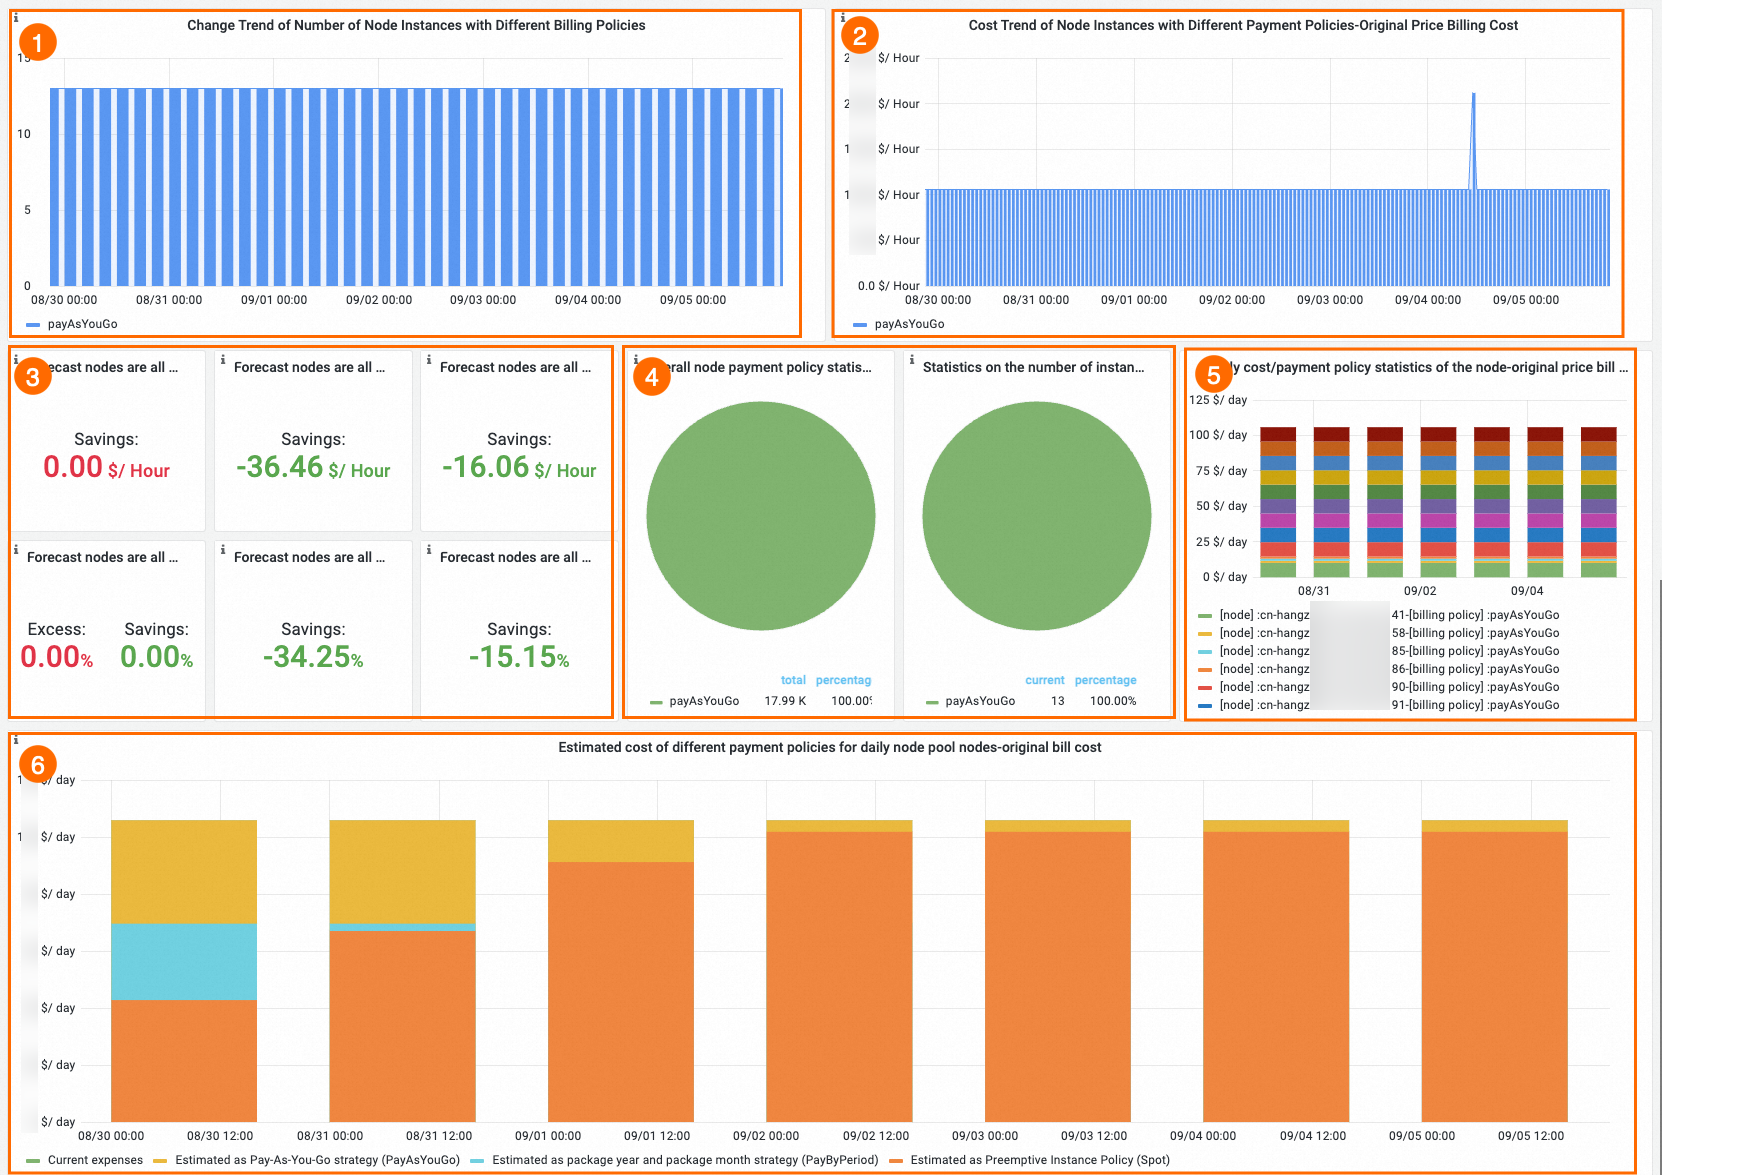
Estimate cost savings based on the billing methods of nodes to help you optimize resource allocation and select a proper billing method. | (1), (2), and (4) | Display the ratios of nodes that use different billing methods and the ratio changes within a period of time, and the cost ratios of nodes that use different billing methods and the ratio changes within a period of time. The following billing methods are supported:
|
(3) and (6) | Estimate cost savings (or additional costs incurred) after you change the billing method of all nodes in the node pool. This helps you optimize resource allocation and select a proper billing method. | |
(5) | Cost and billing method statistics about the nodes in the node pool. |
Application dimension
The application dashboard allows you to use label wildcards to filter applications and view the cost and resource usage of the desired applications. Application cost analysis focuses on scenario-specific cost optimization. Application cost analysis applies to scenarios such as big data computing, AI computing, and elastic scaling.
By using label wildcards to filter applications, you can also monitor multiple applications that depend on each other at the same time. For example, you can add the same label to all applications that are streamlined in a pipeline so that you can analyze the costs of the entire pipeline.
Filter criteria

Feature | Number | Description |
Node pool cost analysis options | (1) | The following cluster cost analysis options are available:
|
Namespaces | (1) | Select a namespace to analyze its cost. The default setting is All, which means that all namespaces in the cluster are selected. |
Filter applications by label | (2) | Enter a pod label. You can specify a label key and a label value separated by a equal sign ( If the label key contains forward slashes ( |
Cost allocation models | (3) | Cost allocation models include the single resource cost allocation model and weighted hybrid resource cost allocation model. For more information, see Cost estimation policies.
|
Time range | (4) | The time range of the data displayed in the dashboard. The default time range is the last 7 days. You can specify a time range to view the changes in costs and resources within the specified time period. |
Billing overview
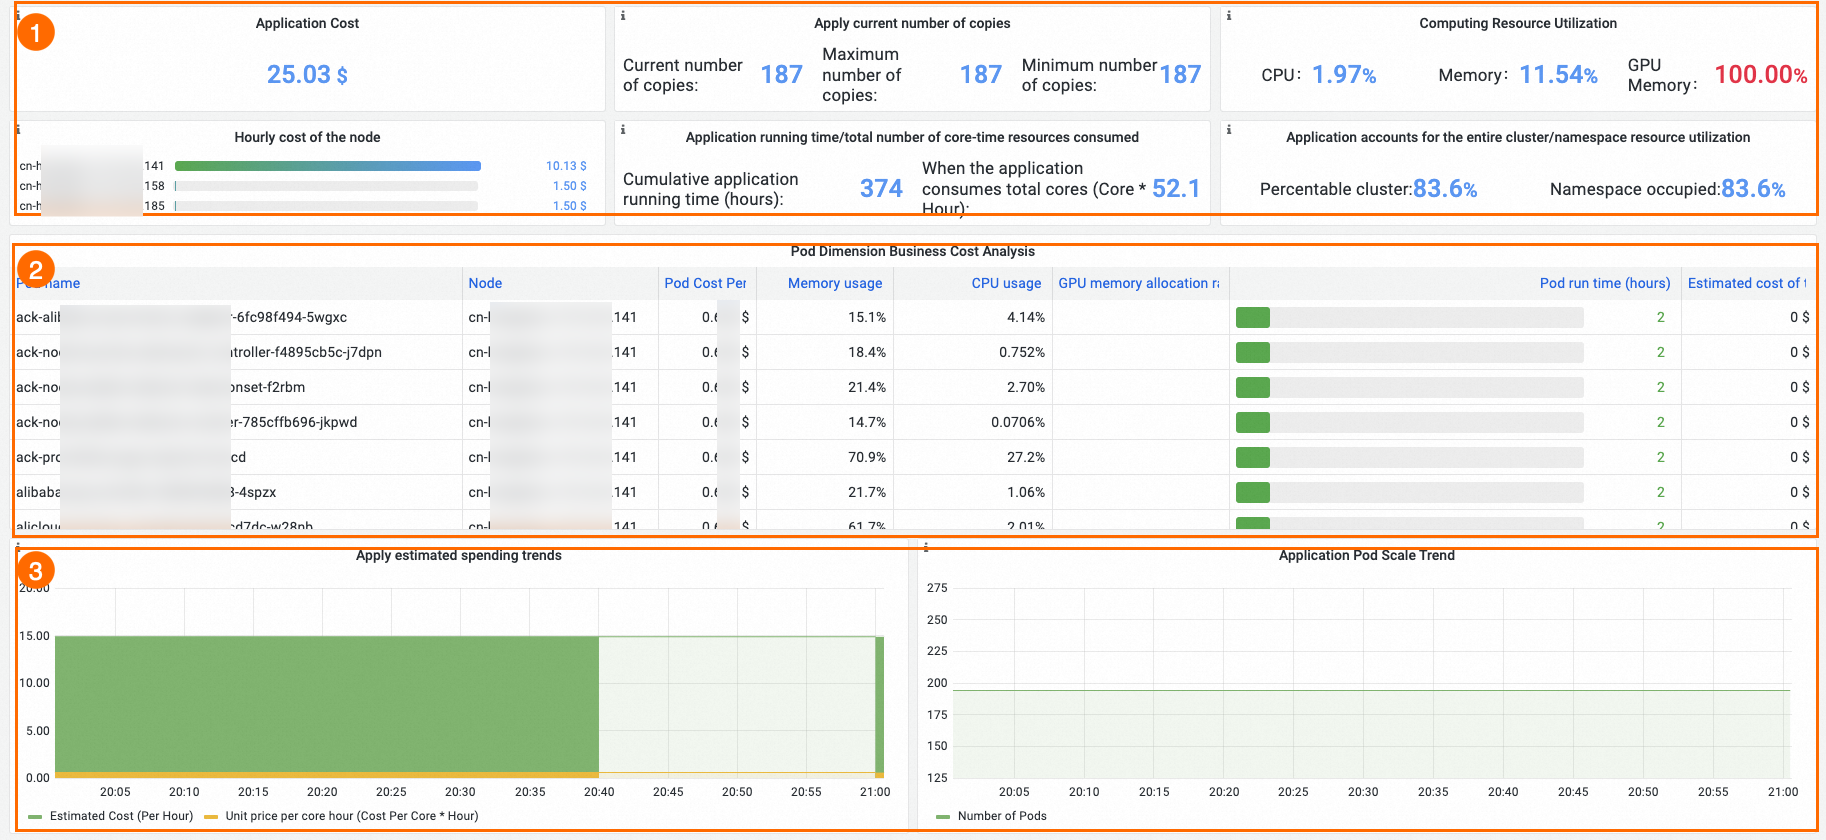
Feature | Number | Description |
Application costs and computing resource utilization | (1) | Display the cost of an application in real time and analyze the resource utilization of the application.
|
Pod cost analysis | (2) | Display the resource statistics and real-time estimated cost of each pod of the application. |
Changes in estimated application costs and number of pods | (3) |
|
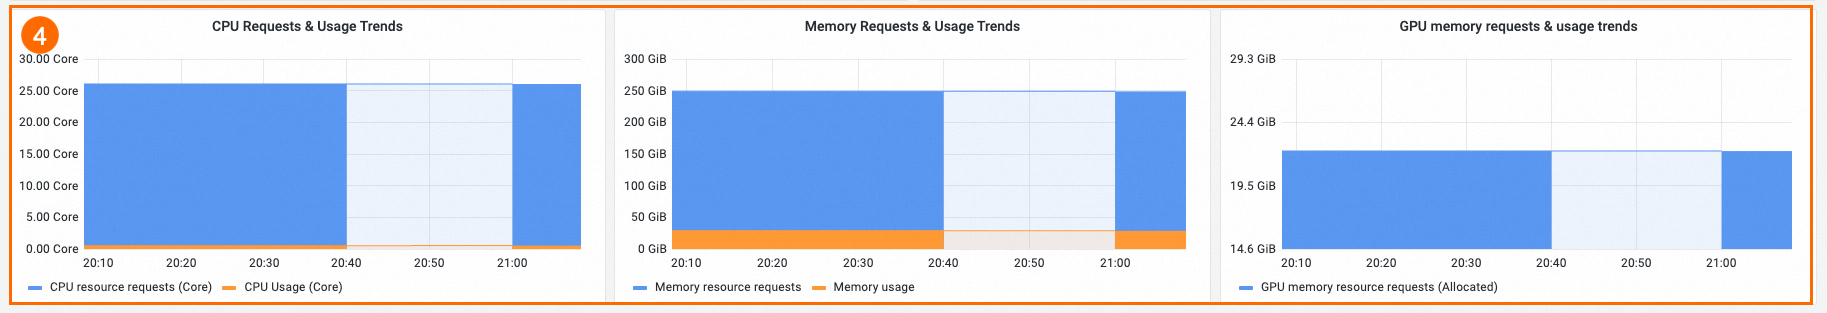
Changes in CPU, memory, and GPU requests and usage | (4) | CPU, memory, and GPU requests and charts:
Resources that are allocated to applications but are not in use = Blue column - Yellow column Allocatable cluster resources = Y-axis - Blue column Analysis procedure:
|
Billing methods and pod usage
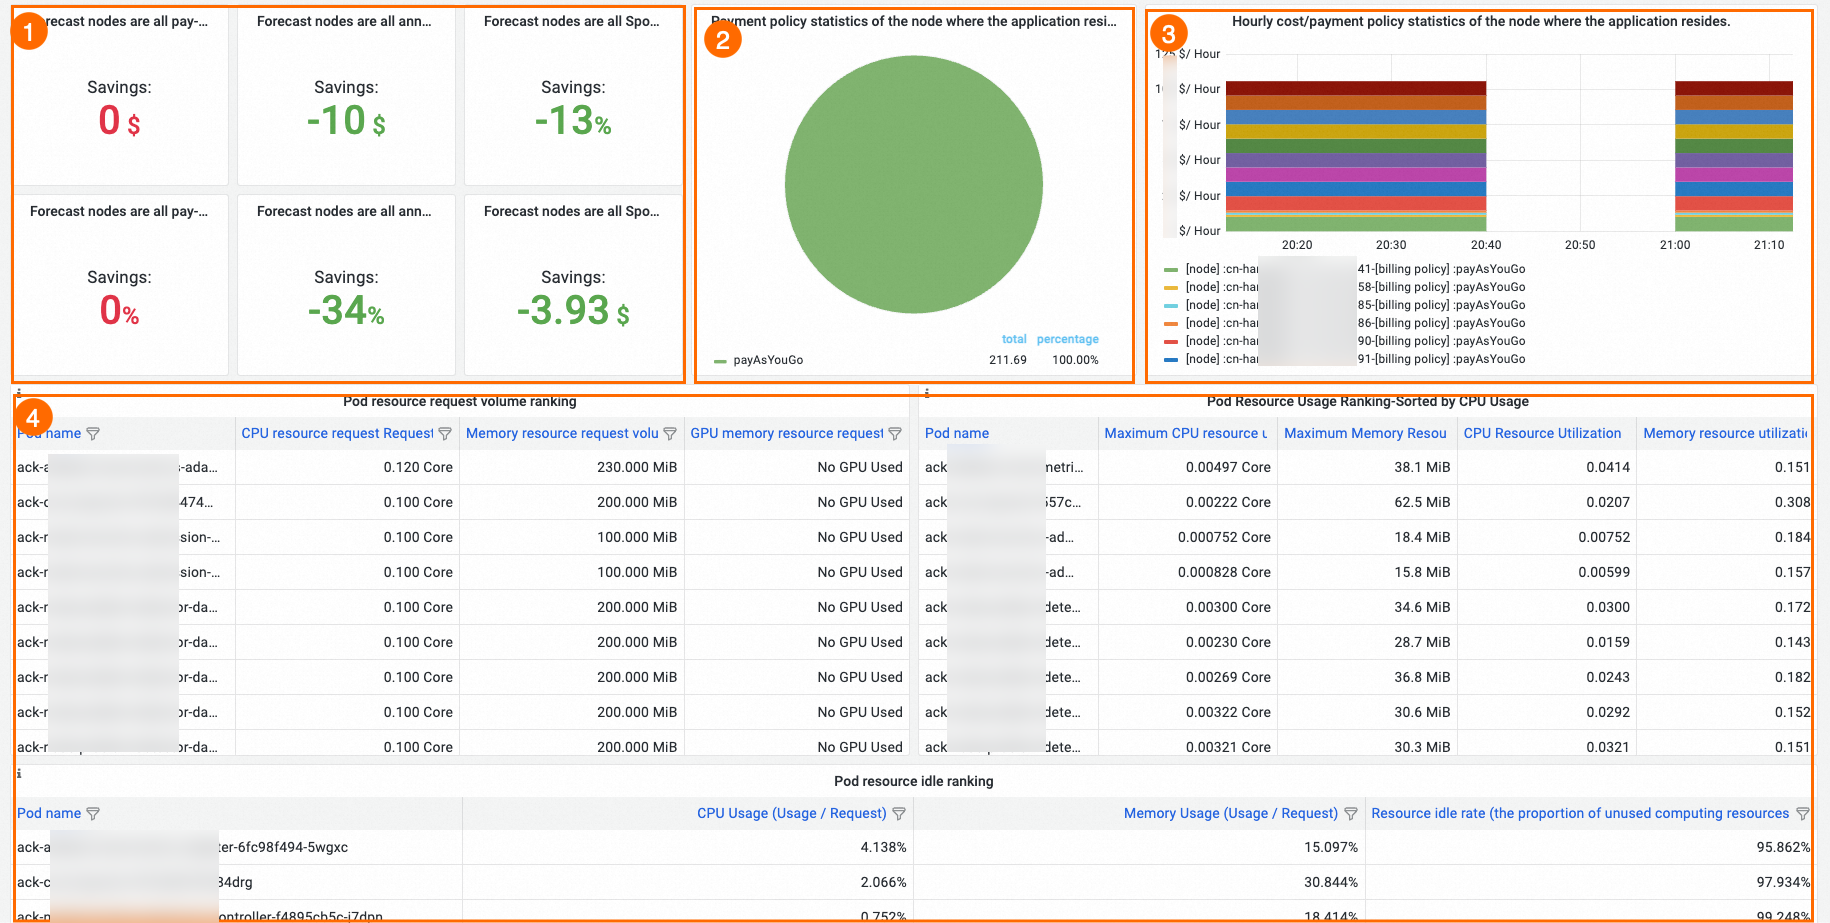
Feature | Number | Description |
Estimate cost savings after you change the billing method of nodes | (1) | Estimate cost savings (or additional costs incurred) after you change the billing method of all nodes in the node pool. This helps you optimize resource allocation and select a proper billing method |
Application cost statistics | (2) and (3) | Display the billing method statistics of the nodes that host the application pods and the hourly cost of the nodes to help you select a proper billing method for the nodes. |
Pod ranking by resource requests, resource utilization, and idle resources | (4) | The following rankings can help you identify the application with the most idle resources to avoid resource waste:
|
Use the cost insights feature to analyze the costs of on-premises nodes in a registered cluster and the costs of applications deployed on these nodes
You can use cost insights to analyze the costs of on-premises nodes in a registered cluster and the costs of applications deployed on these nodes. By default, the cost insights feature calculates the costs of on-premises nodes in a registered cluster and the costs of applications deployed on these nodes at the unit price of CNY 0.3/core hour. The following section describes how to set a custom unit price.
Configure a unified price for all IDC nodes
In the kube-system namespace, you can configure a unified price for all IDC nodes by setting the
DefaultIDCPricePerCPUCoreHourenvironment variable in the ack-cost-exporter deployment.NoteThis price is the price per CPU core per hour (CNY/Core×Hour).
env:
# Set the price for each IDC node to CNY 0.3 per CPU core per hour.
- name: DefaultIDCPricePerCPUCoreHour
  value: "0.3"
Configure a separate price for a specific node
Add the label
"node.kubernetes.io/price-per-day”to the corresponding node to configure a separate price for that node.NoteThis price is the total price for this node for one day.
Run the following command to set the total price for a specific node to CNY 100 per day.
kubectl label nodes <node-name> node.kubernetes.io/price-per-day="100"
FAQ
Why is no data displayed after I enable cost analysis?
Check whether you have completed RAM role authorization. For more information, see Step 3 in the Enable cost insights topic. Cost analysis is based on monitoring data and cost data. The collection of monitoring data starts within 3 minutes after you enable the cost insights feature. Cost data is displayed at 08:00:00 (UTC+8) on the next day.
Check whether a NAT gateway is configured for the cluster. You cannot use the internal endpoint to query bills in certain regions. Make sure that your cluster has Internet access.
The data of the Day-on-day Ratio and Estimated Cost of Next Day metrics is displayed after the cost insights feature collects statistics for two consecutive days.
Why does the cost of a namespace differ from the actual bill amount?
The cost of a namespace is calculated based on cost estimation and is not directly related to the actual bill amount. Therefore, the cost estimation is based on the list prices. However, the actual cost of a cluster can be reduced by vouchers, discounts, and cost savings plans. As a result, the estimated cost of a namespace may not equal the bill amount. To obtain the actual cost of a namespace, you can multiply the actual cost of the cluster by the cost ratio of the namespace.
Why do I fail to obtain the cost data of pods on some nodes?
Check whether the RAM role is granted the required permissions. Make sure that the ecs:DescribeDisks permission is included in the permission policy. For more information, see Step 3 in the Enable cost insights topic.
Why does the bill not display all cloud services used by my cluster?
Cost analysis only collects information about cloud services that are exclusive to your cluster. Information about cloud services that are shared by multiple clusters is not collected.
The cost insights feature is based on the cost allocation tags feature in the Expenses and Costs console. This feature uses a specific identifier in the cloud service tags (key: value = ack.aliyun.com:{{ClusterId}}) to track and collect cluster cost statistics. If you disable this tag on the Cost allocation tags page of the Expenses and Costs console, the cluster cost information cannot be collected. In this case, you must follow the instructions on the Cost allocation tags page of the Expenses and Costs console to enable the tag whose key is ack.aliyun.com and the tag whose key is ack.alibabacloud.com/nodepool-id.
Why is the monthly or weekly spending lower than the actual amount?
The cost data of a cluster before you enable the cost insights feature is not analyzed when the cost insights feature calculates the cluster cost.