The cost insights feature of Container Service for Kubernetes (ACK) provides dashboards that display visualized cost data for your clusters, namespaces, node pools, and applications. Use these dashboards to identify resource waste, track spending trends, and optimize billing methods across your Kubernetes infrastructure.
Choose a dashboard dimension
Cost insights organizes data into four dimensions. Select the one that matches your analysis goal:
Dimension | Best for |
Full-cluster cost overview, namespace and node pool cost breakdown, resource utilization histograms | |
Cross-team cost allocation, identifying over-provisioned applications within a namespace | |
Node pool cost governance, billing method comparison and savings estimation | |
Label-based cost filtering, scenario-specific optimization (big data, AI, elastic scaling) |
Prerequisites
Before you begin, ensure that you have:
Enabled the cost insights feature. For more information, see Enable cost insights
Usage notes
Billing data is displayed at 08:00:00 (UTC+8) on the next day after you enable the cost insights feature. To change the time range of a dashboard, click the drop-down list in the upper-right corner of the dashboard.
View cost insights dashboards
Log on to the ACK console. In the left navigation pane, click Clusters.
On the Clusters page, click the name of the cluster. In the left-side navigation pane, choose Cost Suite > Cost Insights.
On the Cost Insights page, click a tab to open the corresponding dashboard:
Cluster dimension
The Cluster dimension dashboard gives a full-cluster view of costs, resource utilization, and stability metrics. Use it to understand overall spending trends, identify the namespaces and node pools driving the most cost, and detect workloads with resource waste or stability risks.
Filter criteria

Filter | Number | Description |
Cluster cost analysis options | (1) | Controls whether displayed costs reflect discounts: Actual Billing cost with discount (default) shows the amount actually paid. Original Billing cost without discount shows the list price before discounts. For more information, see Bill Details. Note Application costs are analyzed by namespace or pod and are based on bill amounts. |
Cost allocation models | (2) | Determines how pod costs are estimated. Four models are available: CPU model (default) estimates pod cost based on CPU requests. Memory model estimates pod cost based on memory requests. CPU-Memory Hybrid Model (recommended weights) weights both CPU and memory using recommended ratios. CPU-Memory Hybrid Model (Custom Weights) uses custom ratios — specify the CPU Weight Setting (%). For details on each model, see Cost estimation policies. |
Time range | (3) | The time range of data in the dashboard. Default is the last 7 days. |
Cluster cost overview
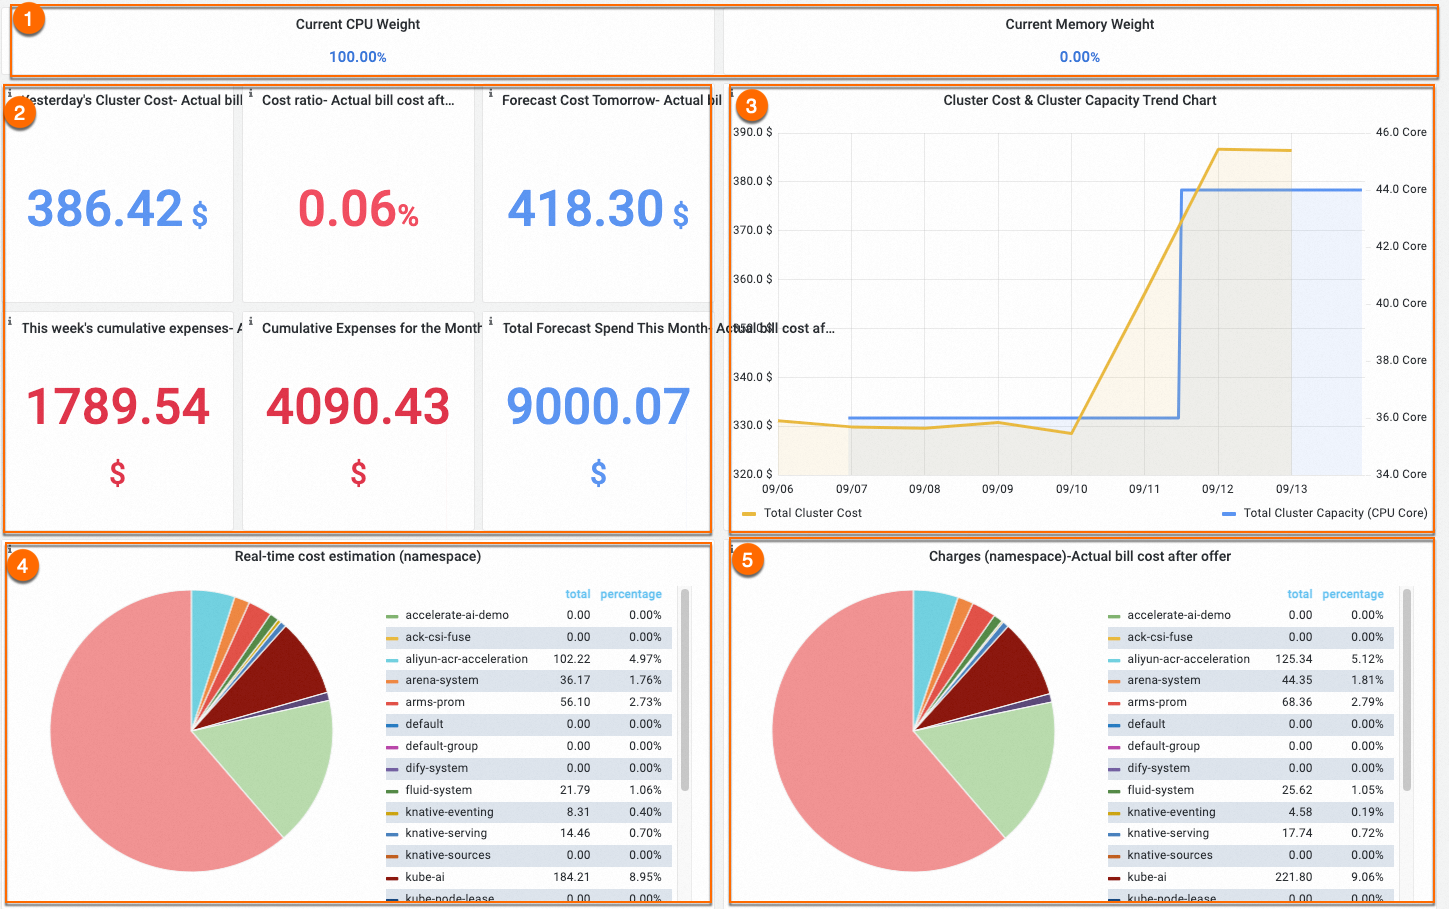
Metric | Number | Description |
Cost allocation model | (1) | Displays the active cost allocation model. The CPU model is selected by default. |
Previous day cost and cumulative costs | (2) | Shows cost of the previous day, the day-on-day ratio, cumulative cost of the current week, and cumulative cost of the current month — all based on bill amounts. Weekly and monthly costs are calculated per calendar period, so the weekly cost resets to zero on Monday and the monthly cost resets to zero on the first day of each month. Bills are generated one day after the transaction date. A green day-on-day ratio means costs decreased; red means costs increased. |
Cost and capacity trend charts | (3) | The yellow curve shows cluster cost and the blue curve shows actual cluster capacity. When the two curves diverge, the average cost per CPU core has changed — check whether higher-priced resources are being consumed. |
Namespace estimated and allocated costs | (4) and (5) | Section (4) shows the real-time estimated cost of each namespace, calculated as the sum of all pod costs. Section (5) shows the allocated cost per namespace — the total cluster cost multiplied by each namespace's cost ratio. Note Namespaces with no CPU resource requests are excluded from cost calculations. The namespace cost formula is: Σ (Pod resource request / Node capacity) × Node unit price. This formula may differ from the bill amount when discounts, vouchers, or subscription billing apply. |
Stability and efficiency analysis
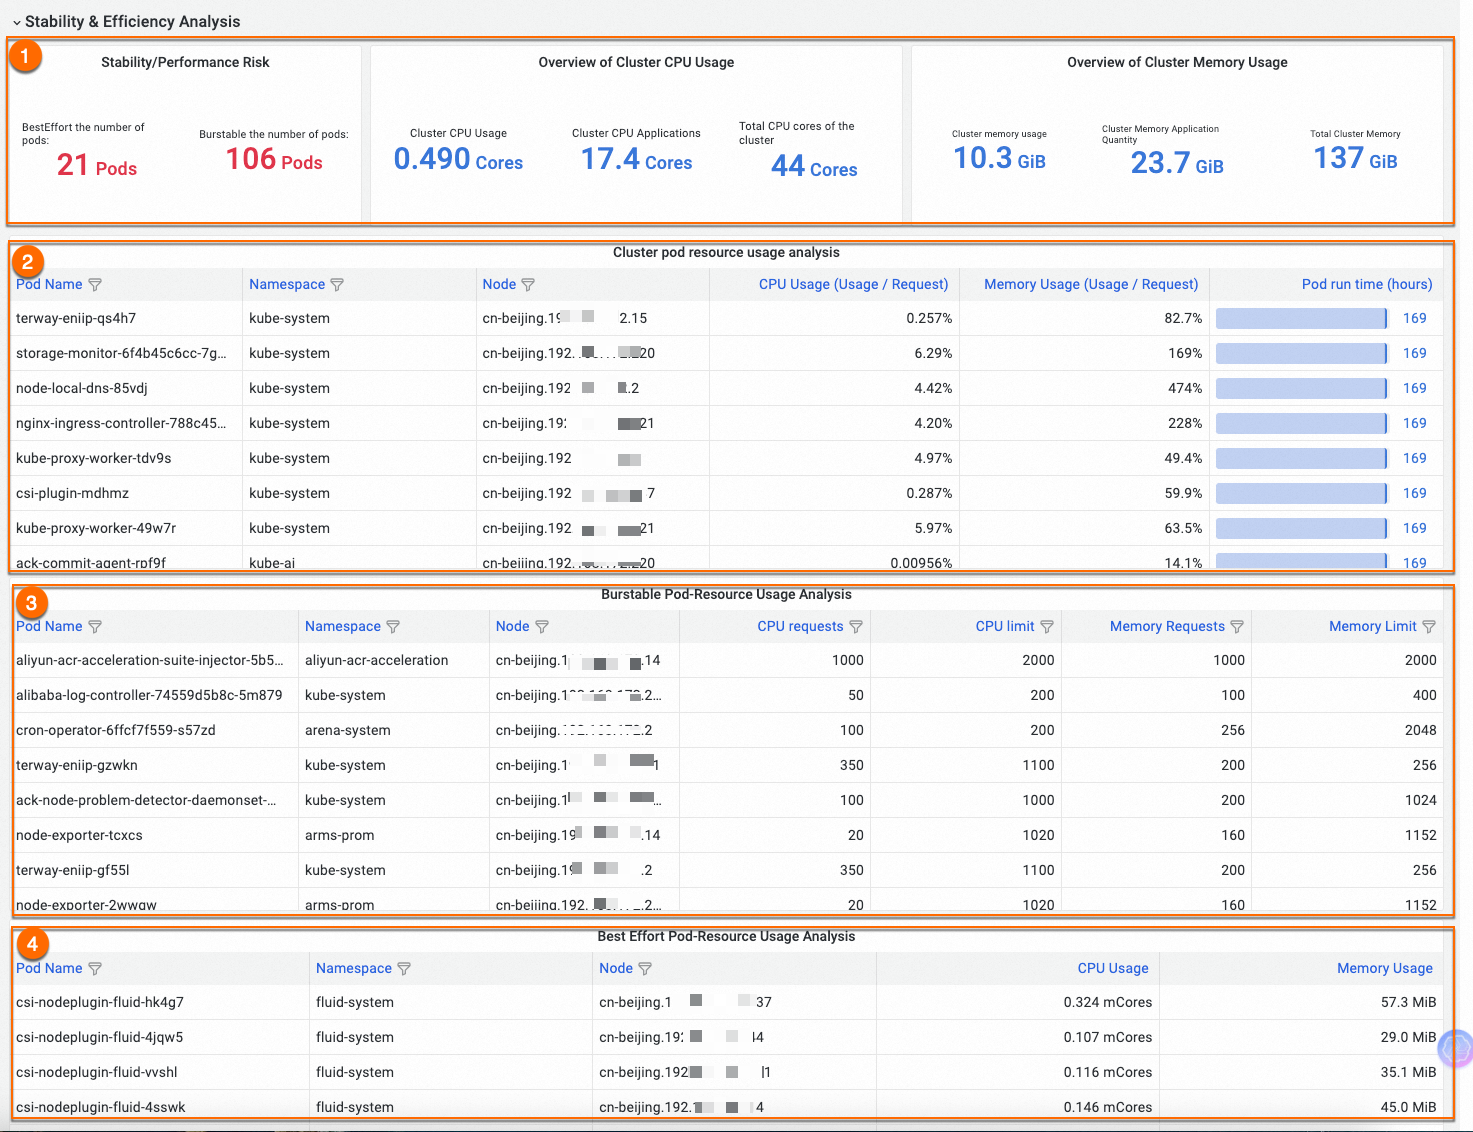
View | Number | Description |
Total resource usage by QoS class | (1) | Shows pod counts per quality of service (QoS) class and total resource usage in the cluster. |
Pod resource usage | (2) | Lists all pods with their basic information and resource utilization (usage/request). Filtering and sorting are supported — use this view to find workloads with the highest or lowest resource usage. |
Burstable pod resource configurations | (3) | Lists pods with QoS class Burstable and their CPU and memory requests and limits. Use this to identify resource bottlenecks caused by pods that may burst beyond their requests. |
BestEffort pod configurations | (4) | Lists pods with QoS class BestEffort. BestEffort pods carry a higher stability risk — sort and filter the list to check for unexpected BestEffort pods and address risks early. |
For more information, see Use cost insights to identify risks for cluster workloads.
Cluster cost analysis
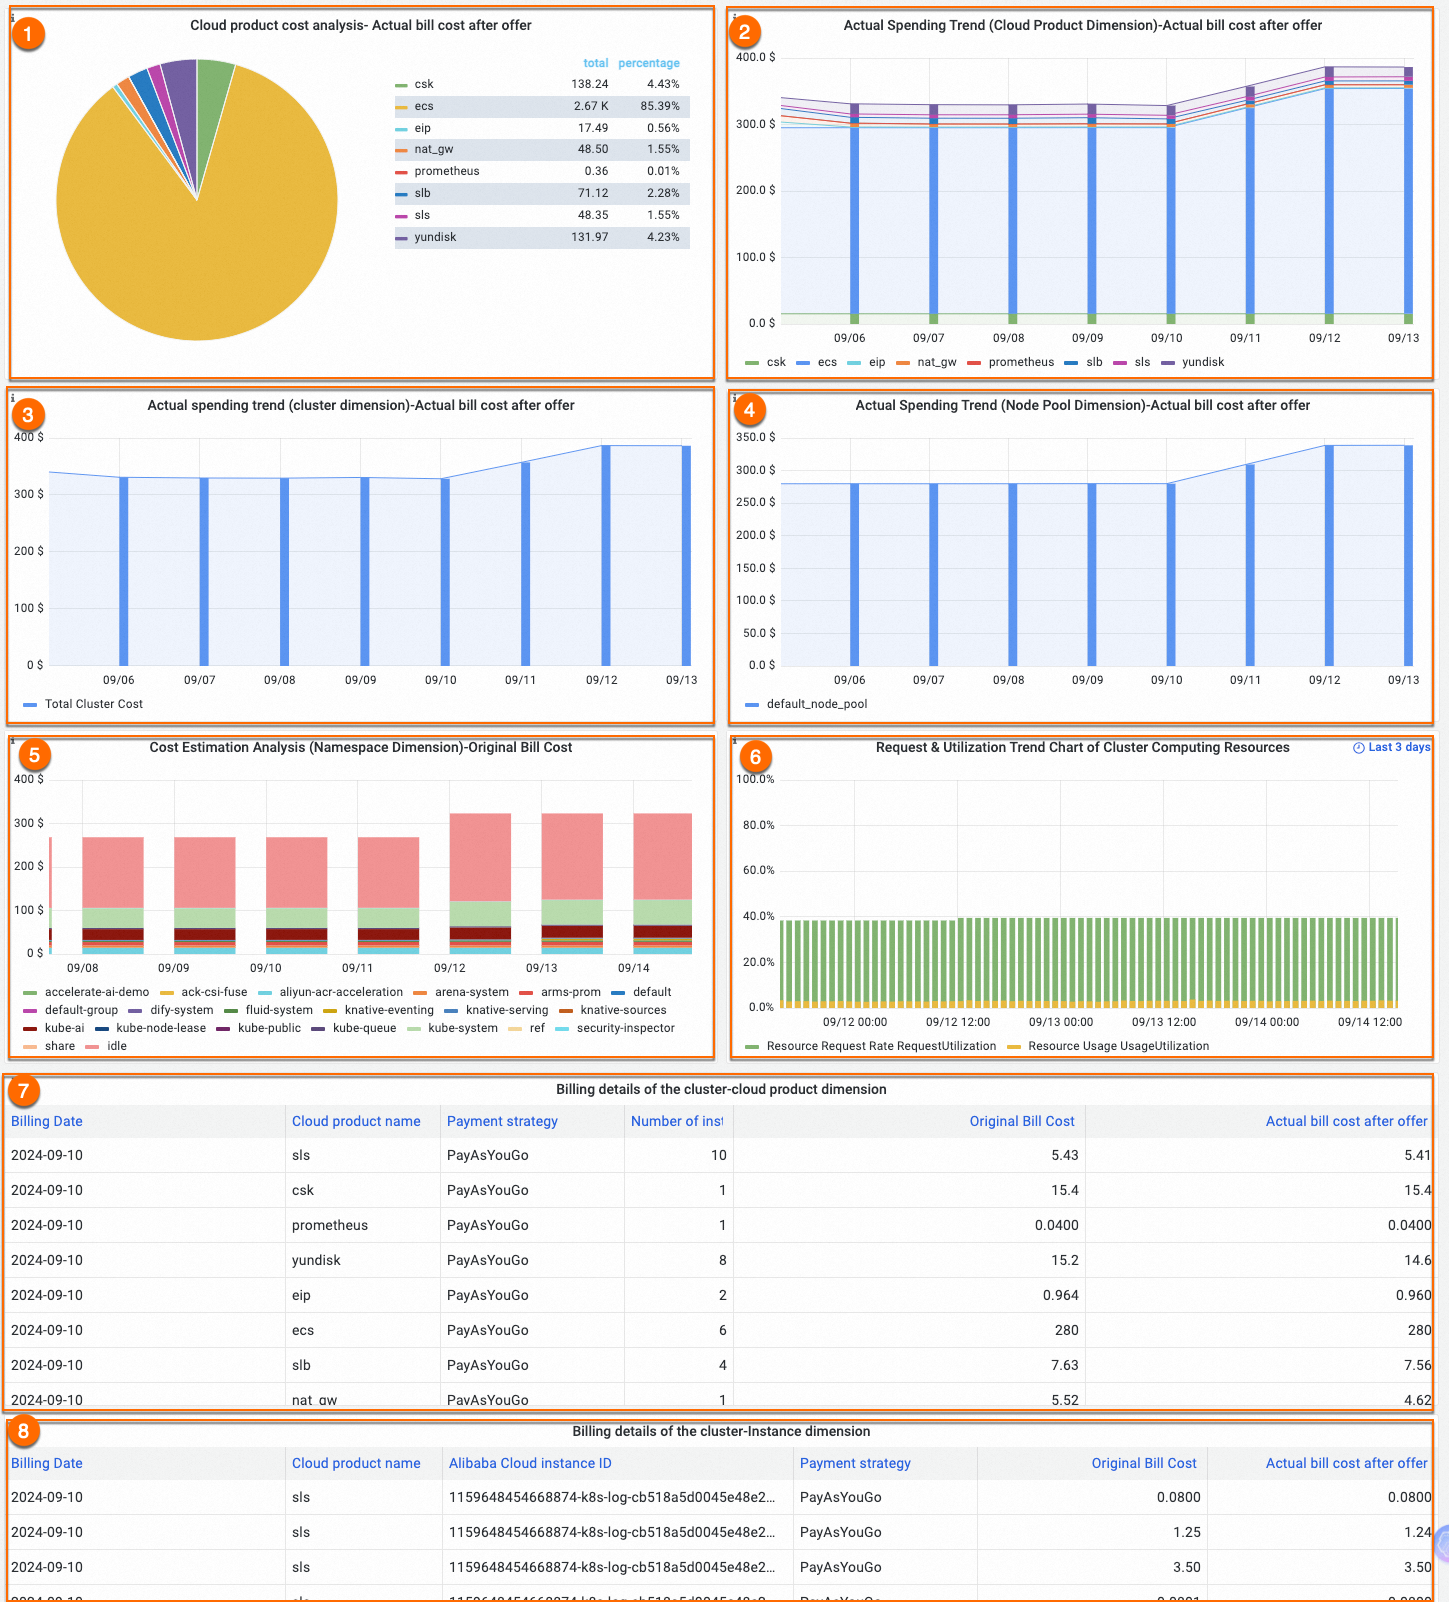
View | Number | Description |
Cloud resource cost ratios and trends | (1) and (2) | Displays the cost ratios of different cloud resource types and how those costs change over time. A cluster may use multiple cloud resources with different billing rules — use this view to identify which resource types are driving costs. |
Total cluster cost over time | (3) | Shows daily changes in total cluster cost. |
Node pool costs | (4) | Shows the cost of each node pool or virtual node in the cluster. |
Namespace estimated cost trends | (5) | Tracks real-time estimated costs per namespace over time. The formula is: Σ (Pod resource request / Node capacity) × Node unit price. This may differ from the bill amount when discounts, vouchers, or subscription billing apply. To get the allocated cost, multiply the total cluster cost by the namespace cost ratio. |
Resource request and utilization histogram | (6) | Shows requested versus actual resource usage over time. The Y-axis is total allocatable capacity. Green columns show requested resources; yellow columns show actual usage. Resources allocated but not in use = Green column − Yellow column. Allocatable cluster resources = Y-axis − Green column. Use this histogram to: (1) identify and reclaim unallocated resources — keep about 20% unallocated as a buffer; (2) right-size over-provisioned workloads by locating pods with the most idle resources; (3) adjust scaling policies when resource watermarks show periodic fluctuations. |
Cluster billing details | (7) and (8) | Lists daily bills broken down by cloud resource type or instance. |
Namespace dimension
The Namespace dimension dashboard filters cost and resource data by namespace. Use it to understand how different teams or departments consume cluster resources, compare estimated costs against actual bills, and identify over-provisioned applications within a namespace.
Filter criteria

Filter | Number | Description |
Namespaces | (1) | Select a namespace to analyze. Default is ALL, which includes all namespaces. |
Cost allocation models | (2) | Same models as the Cluster dimension. CPU model is selected by default. For details, see Cost estimation policies. |
Namespace cost analysis options | (3) | Actual Billing cost with discount (default): shows the amount actually paid. Original Billing cost without discount: shows list prices from the Alibaba Cloud International site. For more information, see Bill Details. |
Time range | (4) | Default is the last 7 days. |
Billing overview
View | Number | Description |
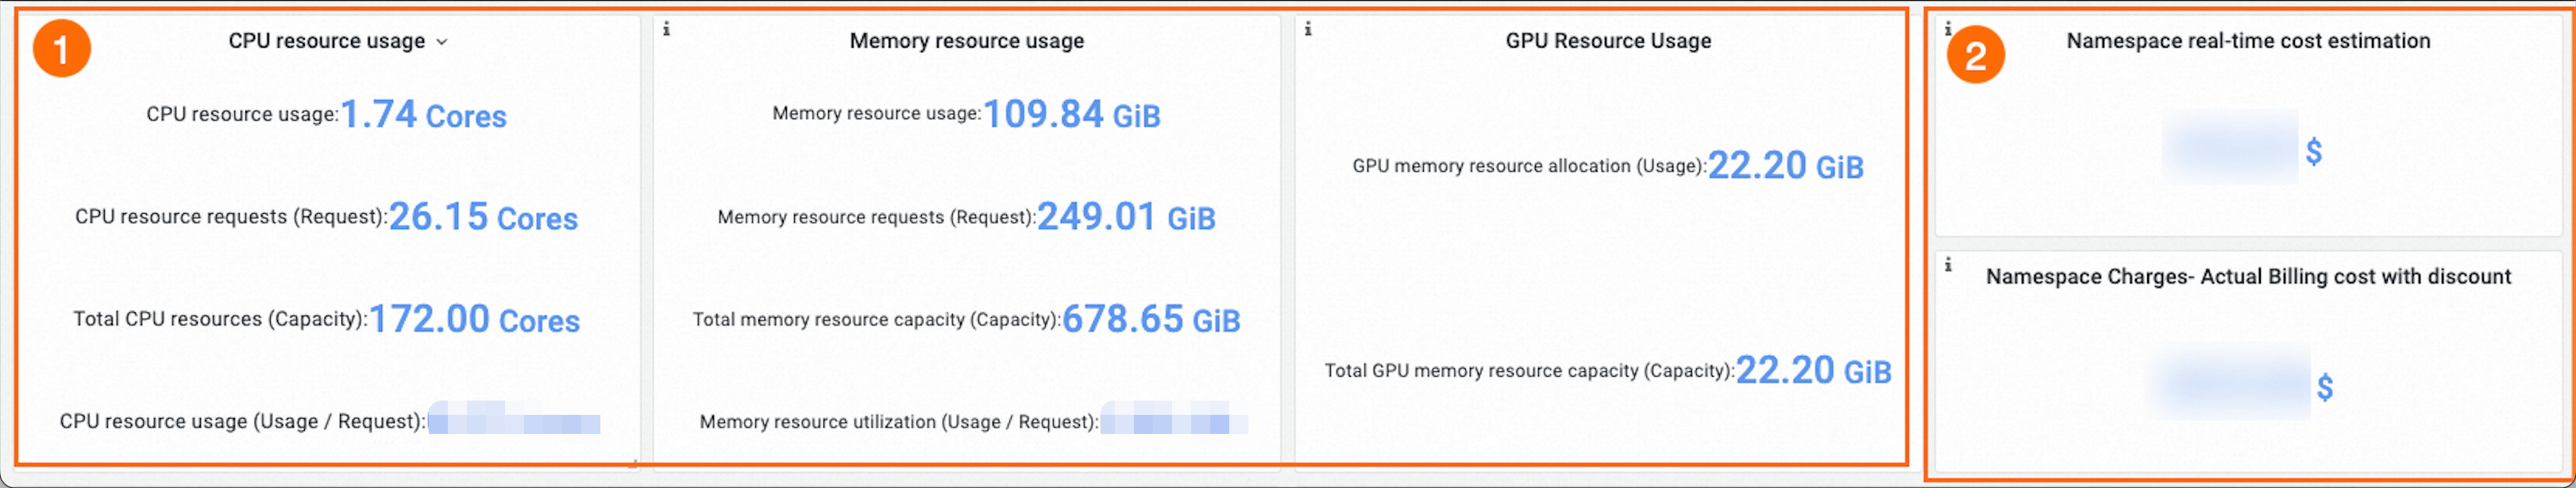
Resource statistics for the namespace | (1) | Shows CPU, memory, and GPU resource metrics for the selected namespace: usage, request, total capacity, and utilization ratio (usage/request). Use these metrics to identify resource waste within the namespace. |
Namespace cost summary | (2) | Namespace real-time cost estimation: the sum of costs of all pods in the namespace. Namespace Charges - Actual Billing cost with discount: the cluster cost allocated to this namespace based on its cost ratio. |
Cost details and trends
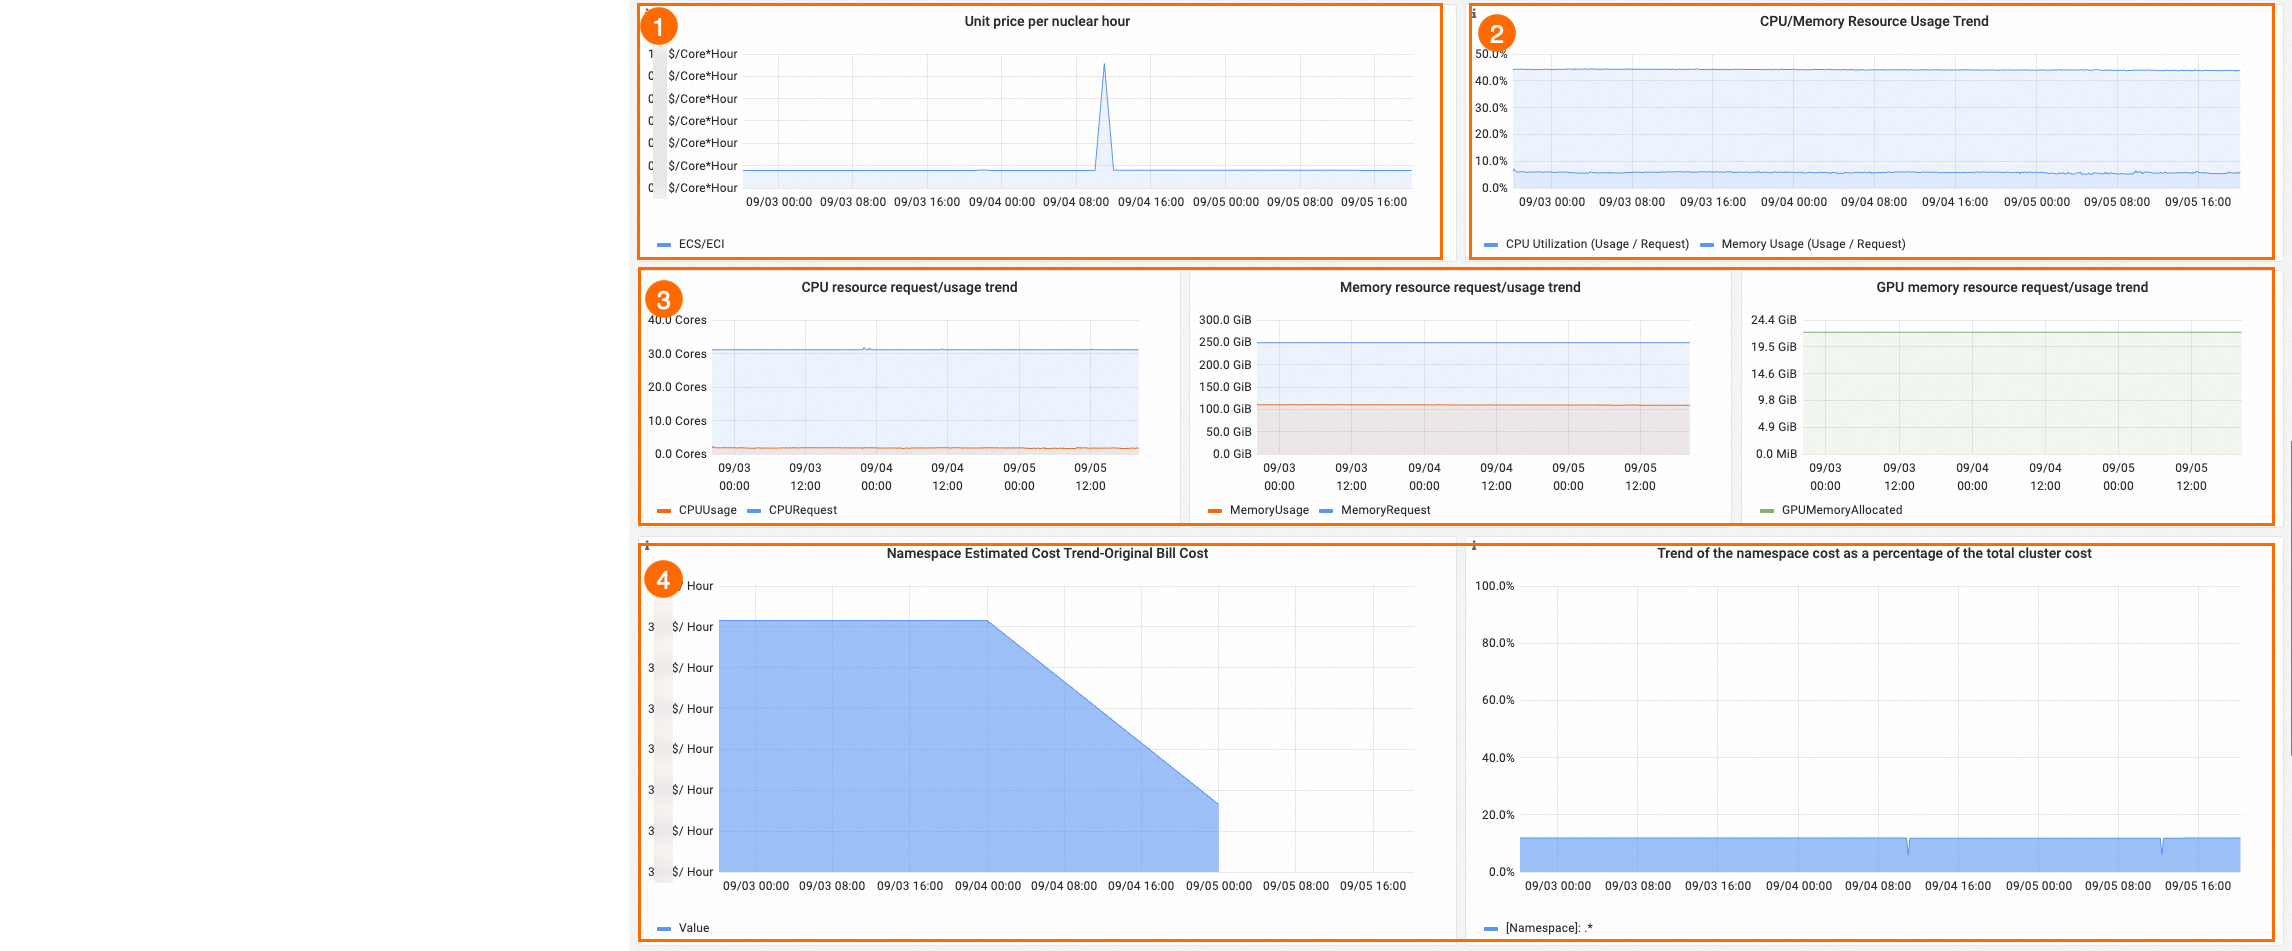
Chart | Number | Description |
Core hour unit price trend | (1) | Shows changes in the unit price of core hours for nodes hosting pods in this namespace. |
CPU and memory utilization trends | (2) | Shows changes in CPU and memory utilization over time. |
Resource allocation vs. usage | (3) | The blue curve shows allocated resources; the red curve shows actual usage. Gaps between the two curves indicate over-provisioned workloads. |
Application cost trends | (4) | Shows how costs for applications in the namespace change over time, including the namespace cost as a ratio of total cluster cost. |
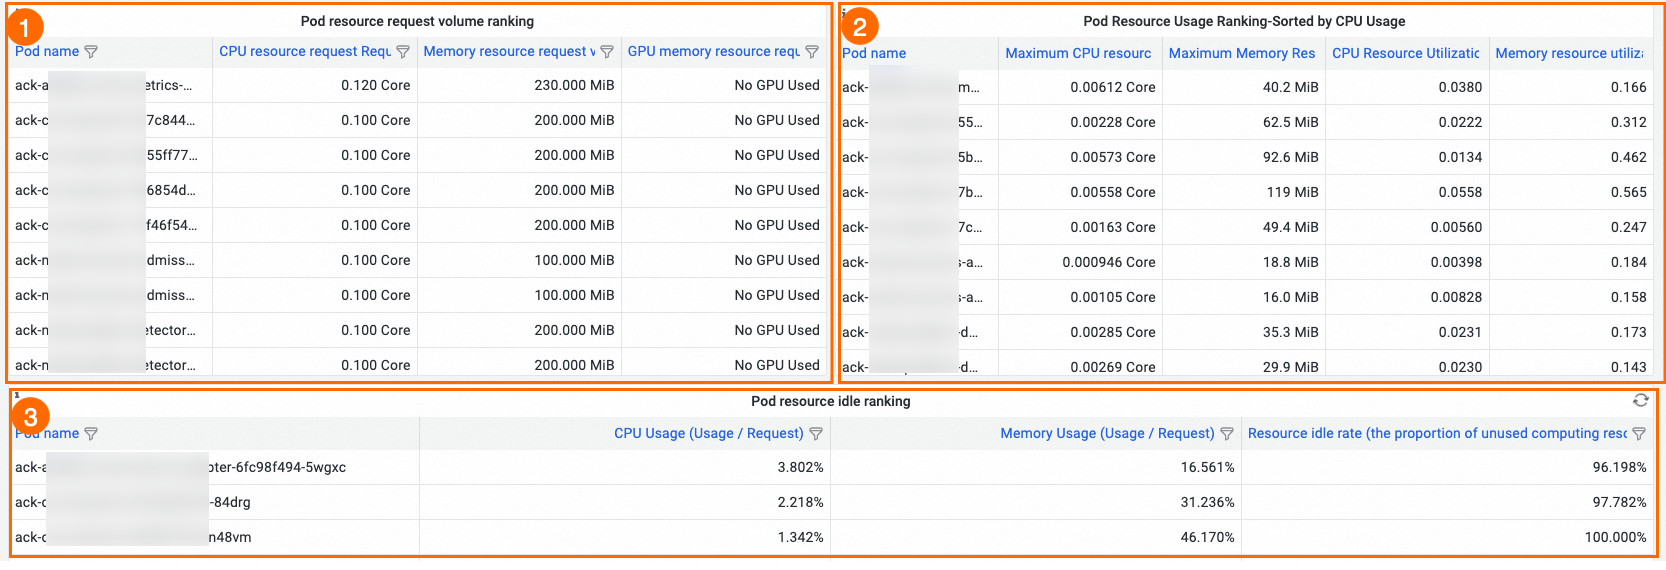
Ranking | Number | Description |
Pod ranking by resource requests | (1) | Sorts pods by resource requests — helps identify the applications consuming the most allocated resources. |
Pod ranking by resource utilization | (2) | Sorts pods by utilization ratio — helps identify the applications with the lowest actual usage relative to their requests. |
Pod ranking by idle resources | (3) | Ranks pods by idle resource ratio (idle resources / total allocated resources). Use this to pinpoint the pods wasting the most resources in the namespace, then right-size their resource requests accordingly. |
Node pool dimension
The Node pool dimension dashboard shows costs per node pool and estimates savings from switching billing methods. Use it to govern costs for node pools shared across departments — such as GPU-accelerated pools — where namespace-level allocation is insufficient.
Filter criteria

Filter | Number | Description |
Node pool cost analysis options | (1) | Actual Billing cost with discount (default). Original Billing cost without discount: list price on the Alibaba Cloud International site. For more information, see Bill Details. |
Node pools | (2) | Select a node pool to analyze. Default is All. |
Time range | (3) | Default is the last 7 days. |
Billing overview
View | Number | Description |
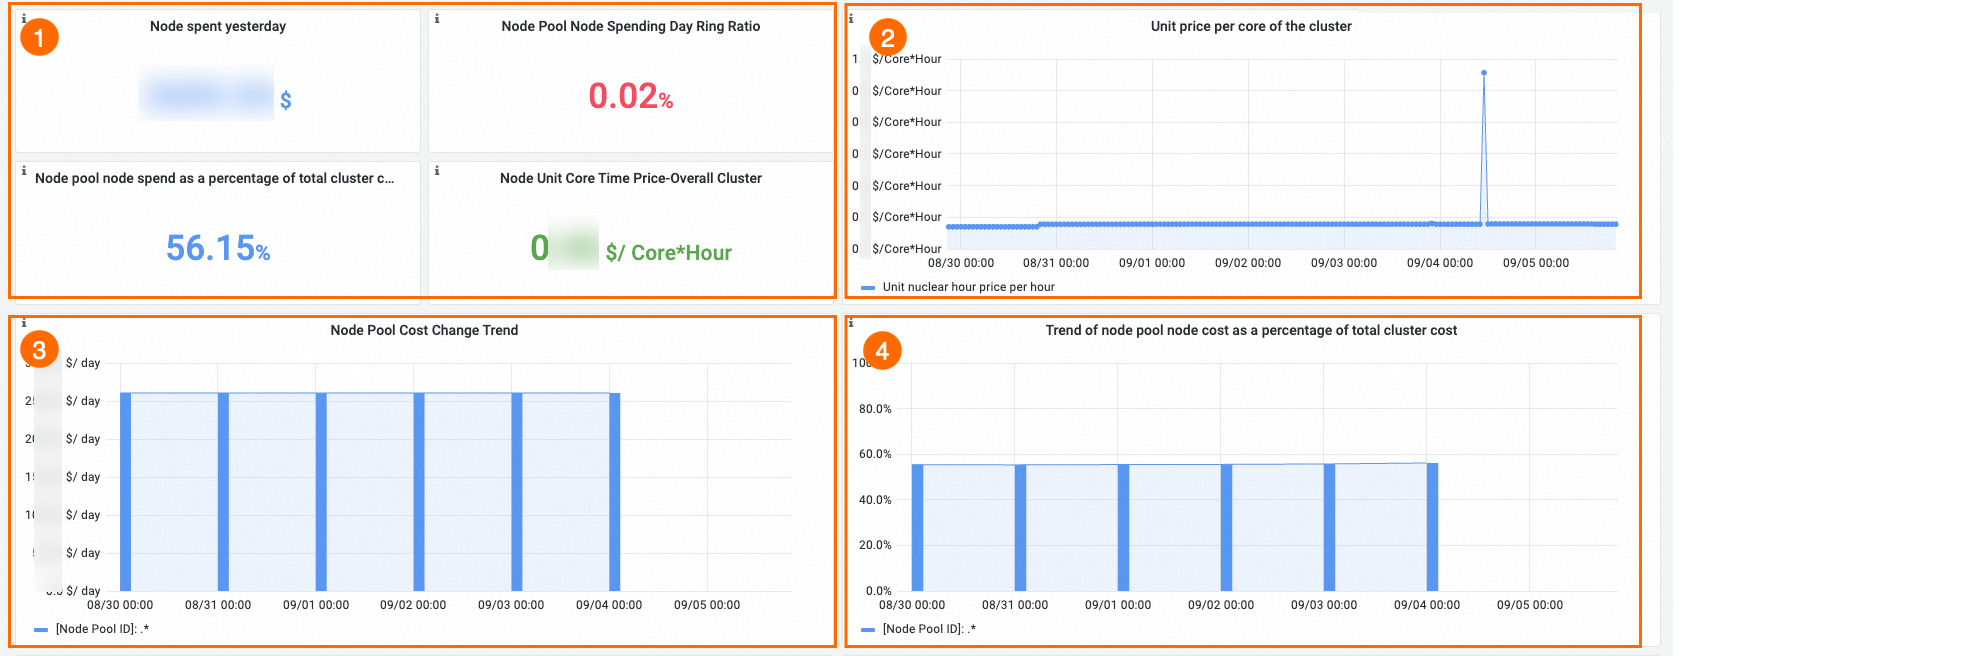
Node pool cost summary | (1) | Shows the cost of the selected node pool. A green day-on-day ratio means costs decreased; red means costs increased. |
Core hour unit price trend | (2) | Shows changes in the unit price of core hours for nodes in the pool. |
Node cost and pool cost ratio trends | (3) and (4) | Shows how individual node costs change over time and how the node pool cost compares to total cluster cost. |
Billing methods and cost estimation
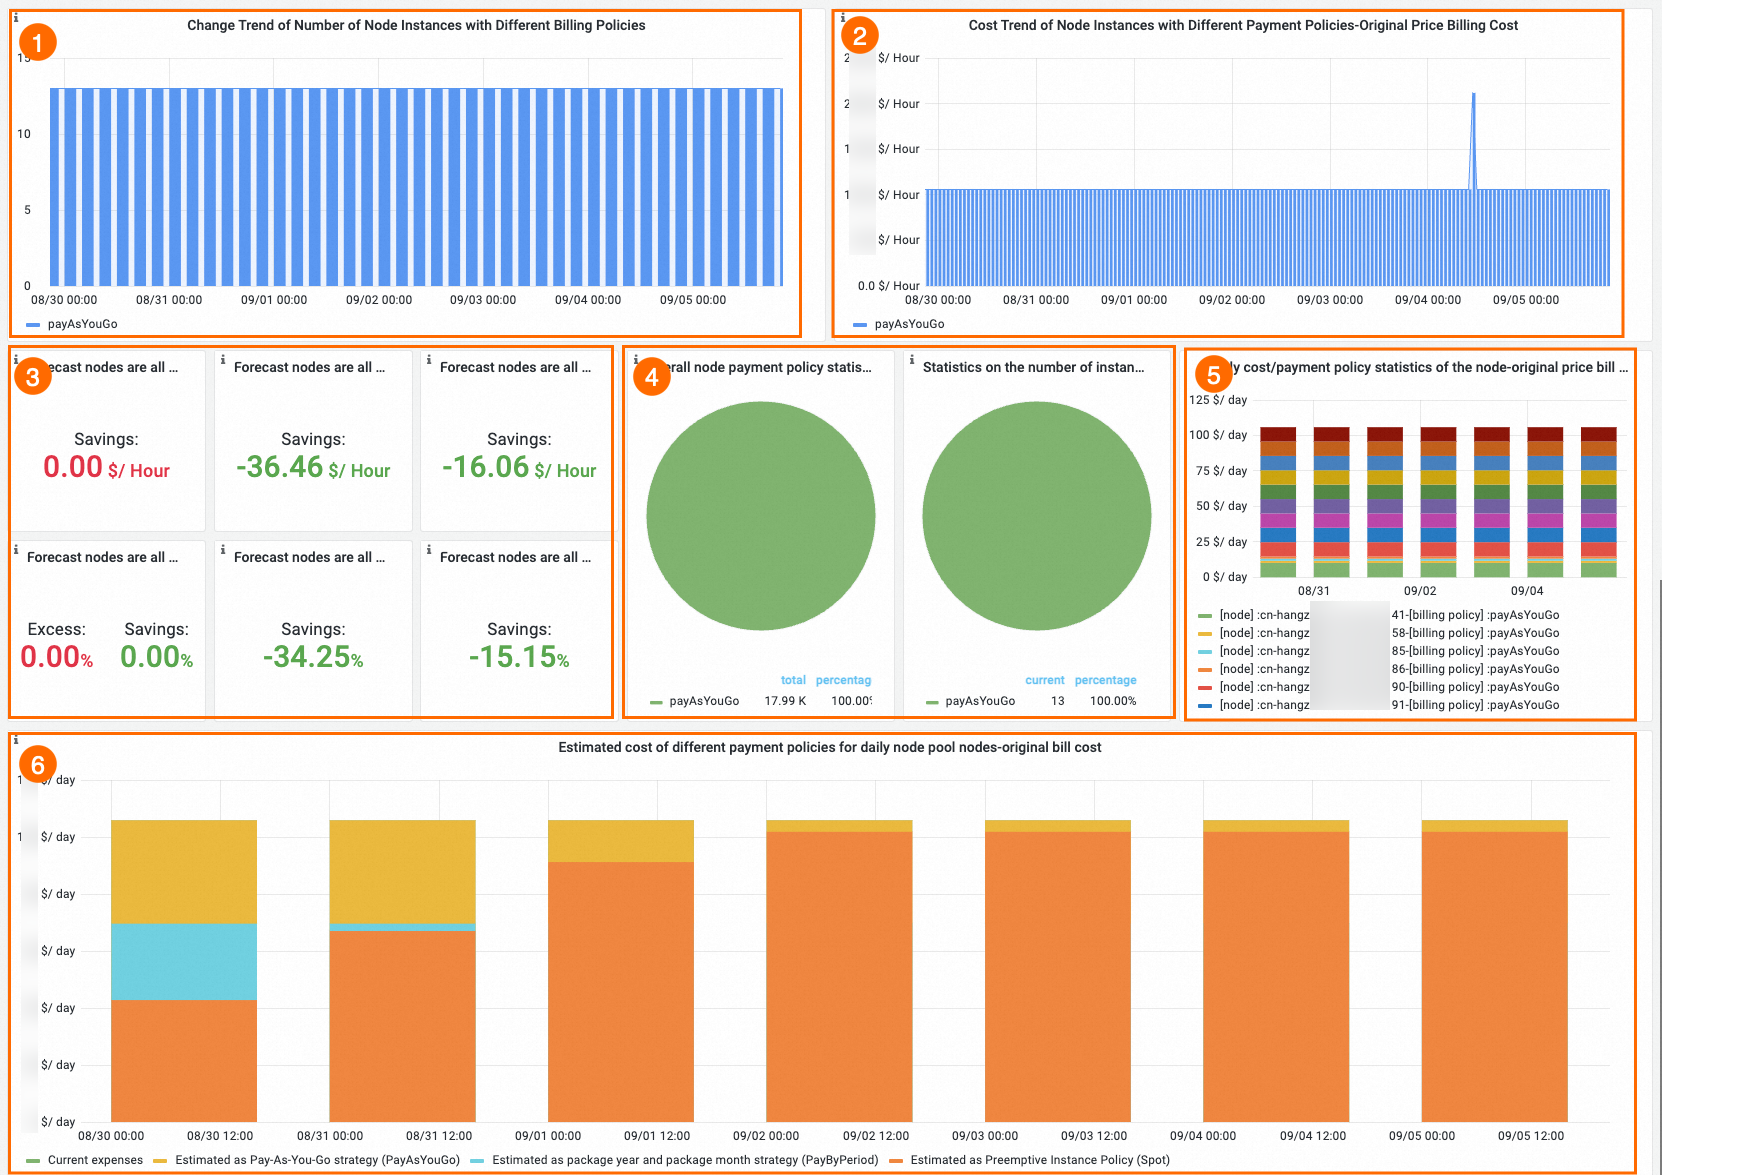
Three billing methods are supported for nodes in a node pool. No environment should rely on a single billing method — mixing types lets you optimize cost for different workload characteristics.
Billing method | Trade-offs |
PayAsYouGo | Flexible with no commitment. Higher per-hour cost. Best for variable or unpredictable workloads. |
PayByPeriod | Lower per-hour cost with upfront commitment. Best for stable, predictable workloads. |
Spot | Deepest discounts, but instances can be interrupted when capacity is reclaimed. Best for fault-tolerant, stateless workloads with flexible startup and shutdown requirements. |
View | Number | Description |
Node billing method distribution and trends | (1), (2), and (4) | Shows the proportion of nodes using each billing method and how costs are distributed across billing methods over time. |
Cost savings estimation | (3) and (6) | Estimates cost savings (or additional costs) if all nodes in the pool switch to a different billing method. Use this to evaluate whether a billing method change makes financial sense. |
Node billing method and cost statistics | (5) | Lists each node with its billing method and cost details. |
Application dimension
The Application dimension dashboard lets you filter applications using label wildcards and analyze their costs and resource usage. It is suited for scenario-specific cost optimization, including big data computing, AI computing, and elastic scaling.
Label wildcards also let you monitor groups of interdependent applications together. For example, tag all applications in a pipeline with the same label to track the cost of the entire pipeline in one view.
Filter criteria

Filter | Number | Description |
Cost analysis options | (1) | Actual Billing cost with discount (default). Original Billing cost without discount: list price on the Alibaba Cloud International site. For more information, see Bill Details. |
Namespaces | (1) | Select a namespace to scope the application search. Default is All. |
Filter applications by label | (2) | Enter a pod label in |
Cost allocation models | (3) | Same models as the Cluster dimension. CPU model is selected by default. For details, see Cost estimation policies. |
Time range | (4) | Default is the last 7 days. |
Billing overview
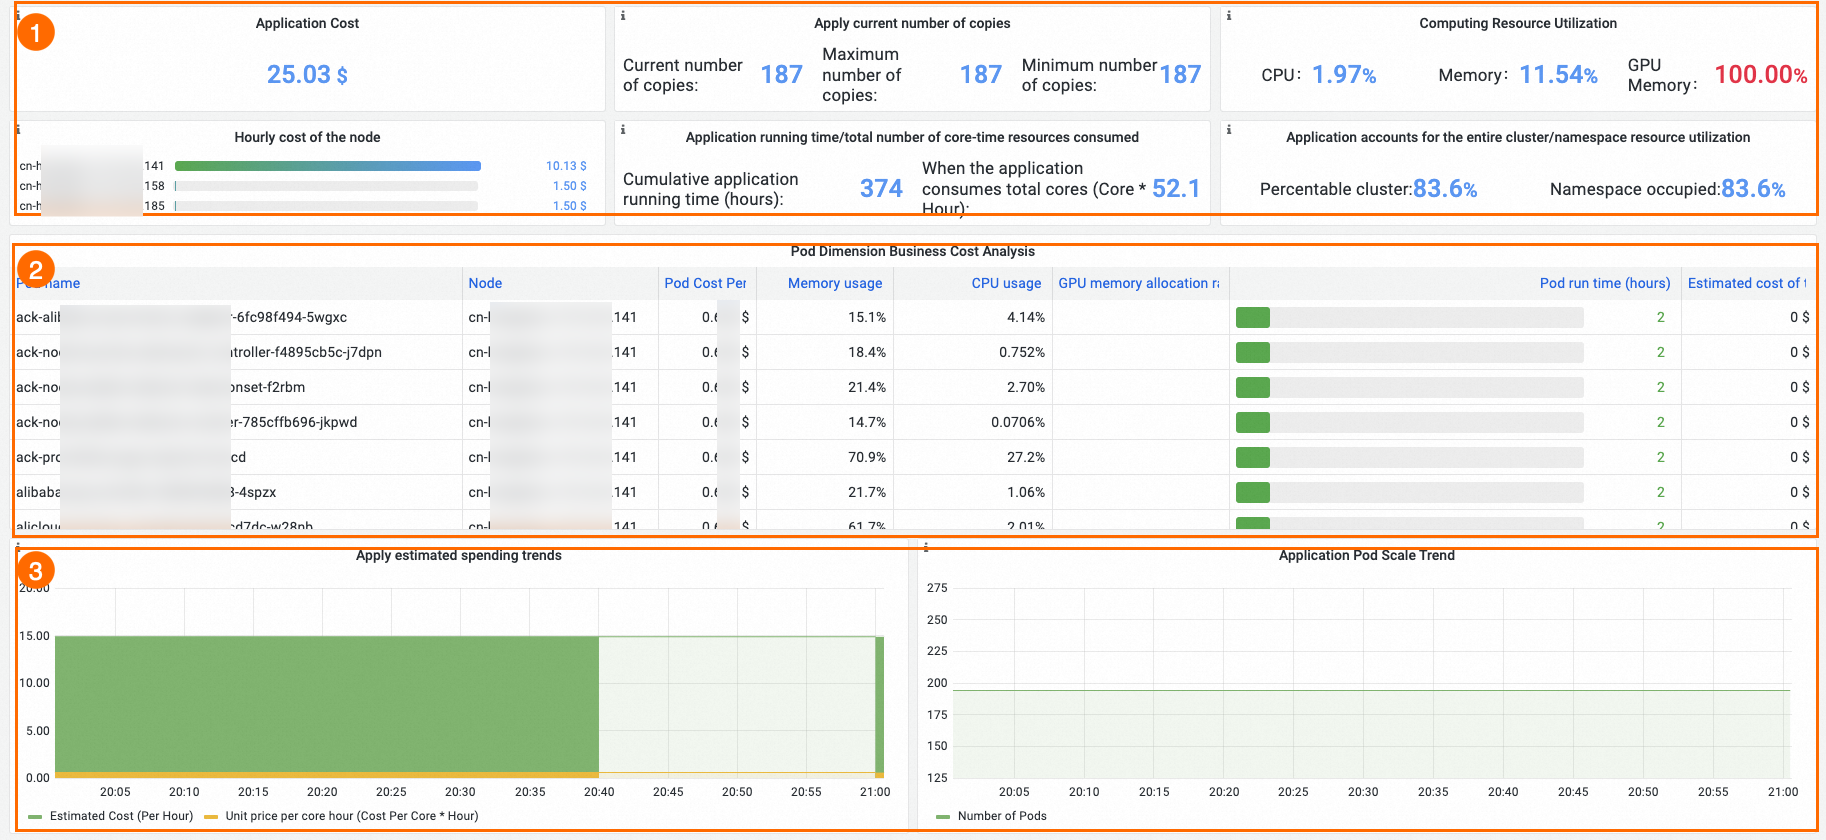
View | Number | Description |
Application cost and resource utilization | (1) | Displays a summary of the application's cost and resource consumption: Application Cost — total cost within the queried time range, based on bill amounts. Apply current number of copies — peak and minimum pod replica counts. Computing Resource Utilization — CPU and memory utilization (usage/request). Hourly cost of the node — core hour unit price for nodes hosting the application. Application running time — runtime statistics. Total number of core-time resource consumption — total core hours consumed. Application accounts for the entire cluster/namespace resource utilization — the application's resource share relative to the cluster and to its namespace. |
Pod cost analysis | (2) | Shows resource statistics and real-time estimated cost for each pod of the application. |
Application cost and replica count trends | (3) | Apply estimated spending trends: hourly cost and core hour unit price changes over time. Application Pod Scale Trend: changes in the number of running replicas over time. |
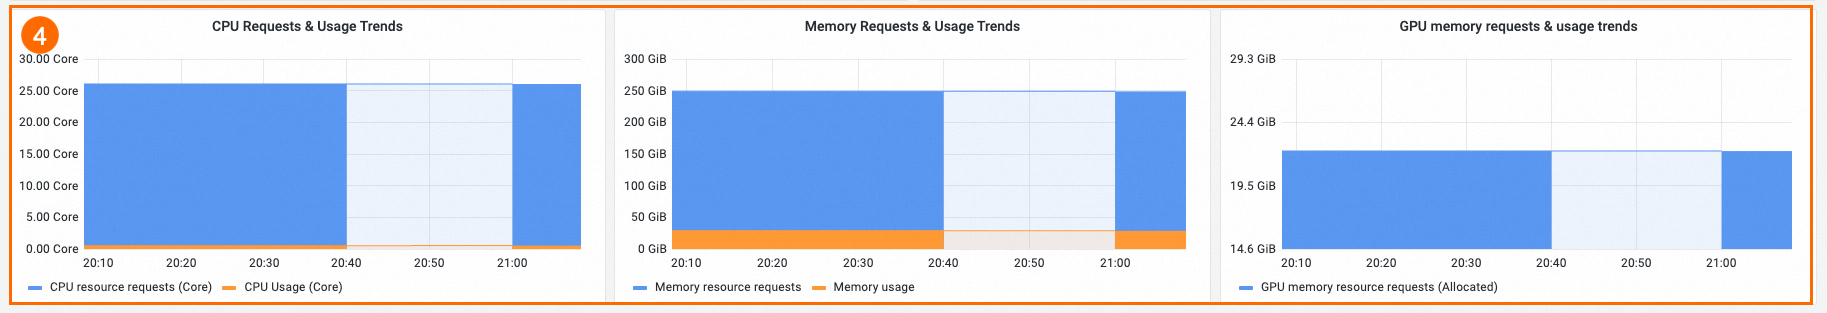
CPU, memory, and GPU request and usage histogram | (4) | The Y-axis is total allocatable capacity. Blue columns show requested resources; yellow columns show actual usage. Allocated but not in use = Blue column − Yellow column. Allocatable resources = Y-axis − Blue column. Use this histogram to right-size resource requests, reclaim idle capacity, and tune scaling policies for periodically fluctuating workloads. Keep about 20% of cluster resources unallocated as a buffer. |
Billing methods and pod usage
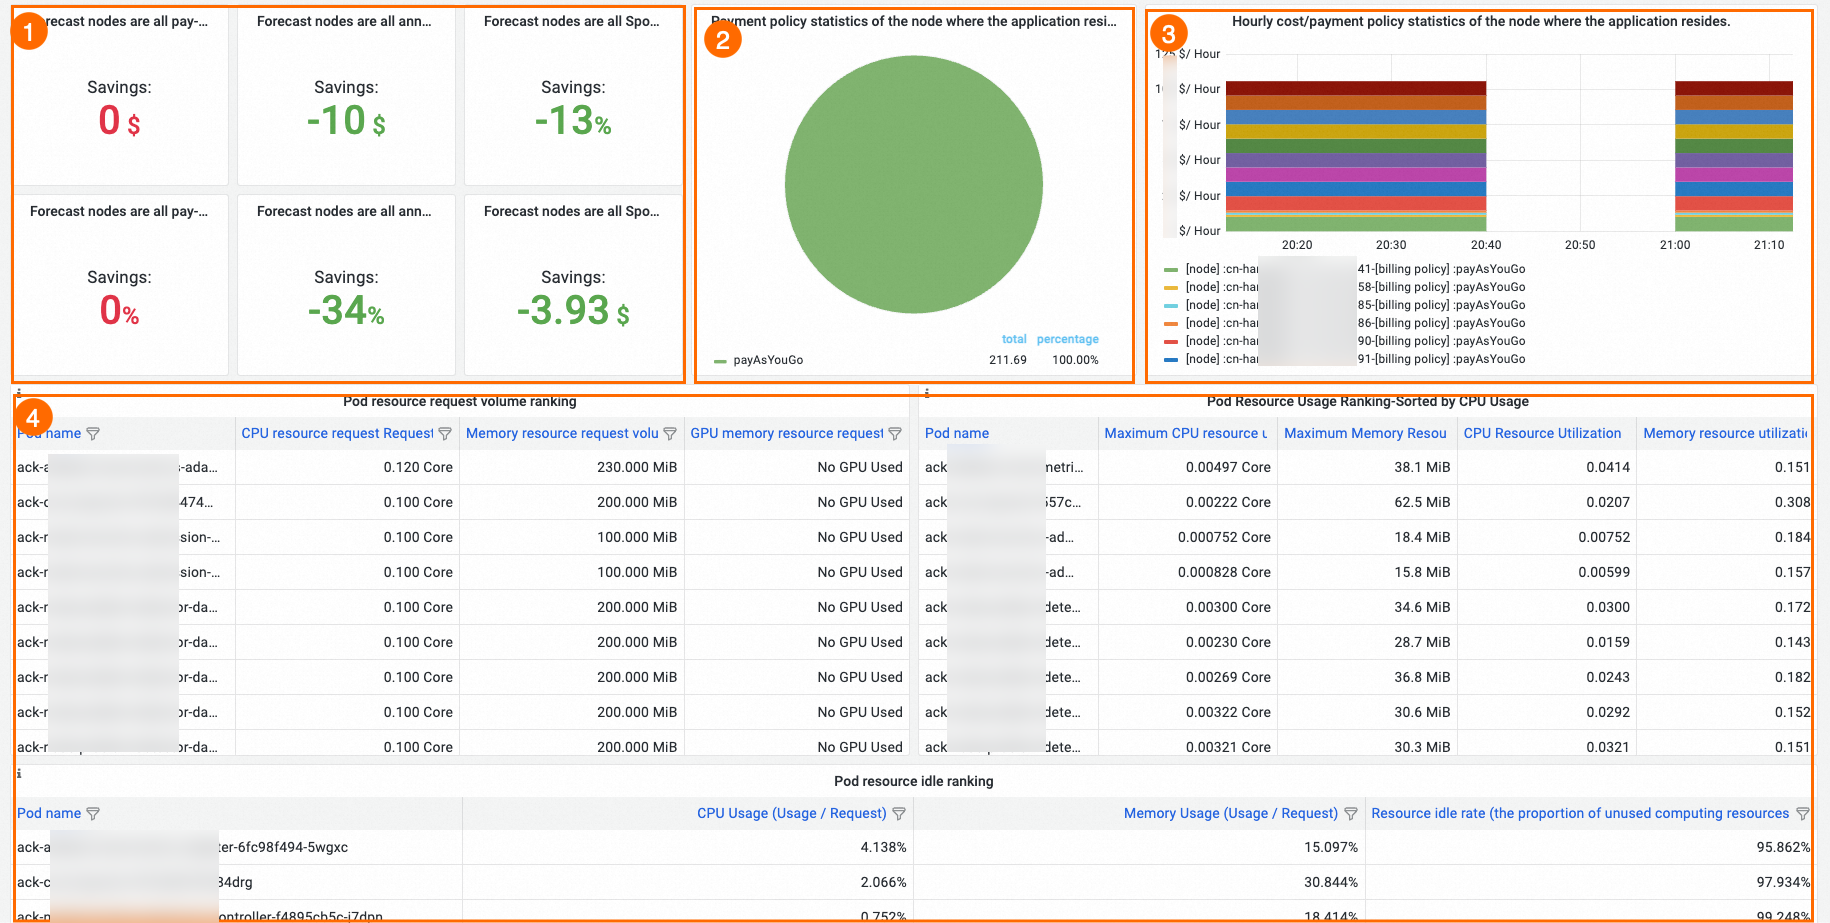
View | Number | Description |
Cost savings estimation | (1) | Estimates cost savings (or additional costs) if all nodes hosting this application switch to a different billing method. |
Node billing method and cost statistics | (2) and (3) | Shows the billing method distribution of nodes hosting the application pods and their hourly costs — use this to decide the best billing method for the application's underlying nodes. |
Pod rankings | (4) | Three rankings help identify resource waste: Pod resource request volume ranking — sorts pods by resource requests to find the most resource-intensive applications. Pod Resource Usage Ranking — sorts pods by utilization to find the applications with the most idle resources. Pod resource idle ranking — ranks pods by idle resource ratio (idle resources / allocated resources). Use this to locate the pods wasting the most resources, then adjust their requests accordingly. |
Set custom pricing for on-premises nodes in registered clusters
By default, cost insights calculates on-premises node costs in registered clusters at CNY 0.3 per core hour. Set a custom price to get more accurate cost tracking for your IDC hardware.
Configure a unified price for all on-premises nodes
In the kube-system namespace, set the DefaultIDCPricePerCPUCoreHour environment variable in the ack-cost-exporter Deployment. The value is the price per CPU core per hour (CNY/core×hour).
env:
# Set the price for each IDC node to CNY 0.3 per CPU core per hour.
- name: DefaultIDCPricePerCPUCoreHour
  value: "0.3"
Configure a separate price for a specific node
Add the label node.kubernetes.io/price-per-day to the node. The value is the total price for that node per day (CNY/day).
Run the following command to set the price to CNY 100 per day:
kubectl label nodes <node-name> node.kubernetes.io/price-per-day="100"FAQ
Why is no data displayed after I enable cost analysis?
Cost data is displayed at 08:00:00 (UTC+8) the next day, and monitoring data collection starts within 3 minutes of enabling the feature. If data is still missing, check the following:
RAM role authorization: Make sure you completed Step 3 of Enable cost insights.
Internet access: In certain regions, the internal endpoint cannot query bills. Make sure your cluster has Internet access, typically through a NAT gateway.
Day-on-day ratio and next-day cost estimate: These metrics require two consecutive days of data and won't appear immediately after enabling the feature.
Why does the namespace cost differ from the actual bill amount?
Namespace cost is an estimate based on list prices, not the actual bill. Vouchers, discounts, and cost savings plans reduce the actual cluster bill but are not reflected in per-namespace estimates. To calculate the allocated cost of a namespace, multiply the actual cluster cost by the namespace's cost ratio.
Why can't I get cost data for pods on some nodes?
The RAM role is missing the ecs:DescribeDisks permission. Add this permission by following Step 3 of Enable cost insights.
Why doesn't the bill show all cloud services used by my cluster?
Cost insights only collects data for cloud services exclusive to your cluster. Services shared across multiple clusters are not tracked.
The feature uses cost allocation tags in the Expenses and Costs console — specifically the tag Billing Managementack.aliyun.com:{{ClusterId}}Cost Allocation Tag page — to identify cluster resources. If this tag is disabled, cost data cannot be collected. On the Cost allocation tags page of the Expenses and Costs console, enable the tag with key ack.aliyun.com and the tag with key ack.alibabacloud.com/nodepool-id.
Why is the weekly or monthly spending lower than the actual amount?
Cost data from before you enabled the cost insights feature is not included. The feature only analyzes data from the point of enablement onward.