The latency insight feature helps you troubleshoot failures and performance degradation in your Tair (Redis OSS-compatible) database instance. It collects latency statistics with microsecond precision for all commands and custom events. This lets you analyze an instance based on events, time, and latency to quickly identify and resolve issues.
Prerequisites
The Tair (Redis OSS-compatible) instance uses one of the following minor versions. For information about how to update a minor version, see Update the minor version of an instance.
Minor version 1.6.9 or later if the instance is a Tair (Enterprise Edition) DRAM-based instance. If you want to collect statistics about Tair module commands, update the minor version to 1.7.28 or later.
Minor version 5.1.4 or later if the instance is a Redis Open-Source Edition 5.0 instance.
Minor version 0.1.15 or later if the instance is a Redis Open-Source Edition 6.0 instance.
Minor version 7.0.0.6 or later if the instance is a Redis Open-Source Edition 7.0 instance.
Overview
Redis 2.8.13 introduced a new feature called latency monitoring to help you identify and troubleshoot possible latency issues based on events. The latency monitoring feature lets you collect data generated only within the last 160 seconds and access only events that have the highest latency within each second.
Latency insight is an advanced latency statistics feature provided by Tair (Redis OSS-compatible). It can record up to 27 events and the execution time of all Redis commands. It also saves all latency statistics for the last three days. Latency insight provides the following features:
Persistence: supports data persistence and latency spike tracing.
High precision: provides monitoring information that is accurate to the microsecond for all events.
High performance: uses an asynchronous implementation with minimal impact on performance.
Real-time operations: supports real-time data queries and aggregation operations.
Multidimensional statistics: provides comprehensive latency data that lets you analyze an instance based on events, time, and latency.
Billing
This feature is available free of charge.
Procedure
Log on to the DAS console.
In the left-side navigation pane, choose Intelligent O&M Center > Instance Monitoring.
On the page that appears, find the database instance that you want to manage and click the instance ID. The instance details page appears.
In the navigation pane on the left, choose Request Analysis > Latency Insight.
On the Latency Insight page, view the latency statistics of the corresponding node within a specific time range.
For a cluster or read/write splitting instance, you can view the statistics of Data Node and Proxy Node.
NoteOnly data of the last three days can be queried, and the time range must span within one hour.
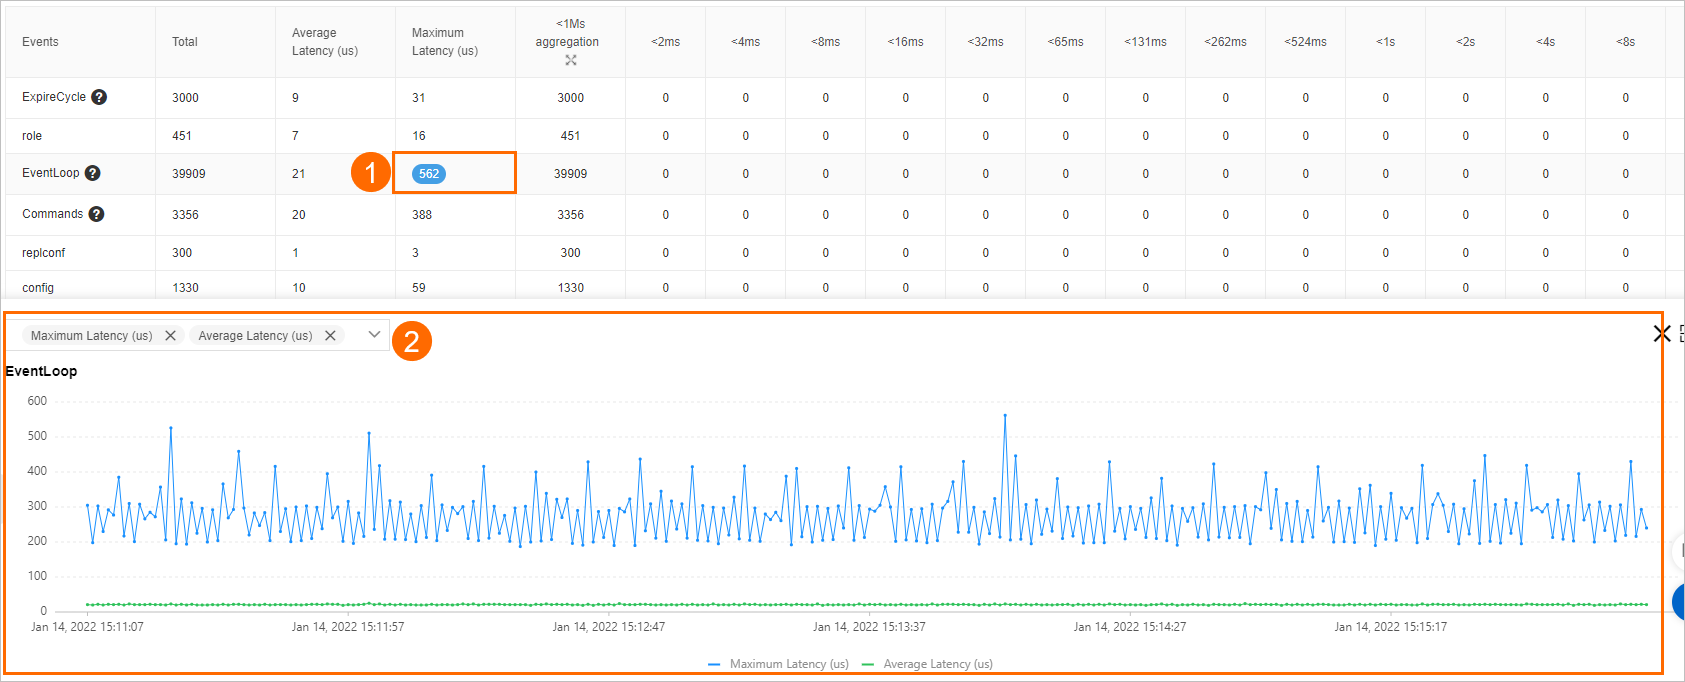
You can click a number corresponding to an event in the table. Then, a chart appears and shows the trend of the event-matched metric. You can also specify the metrics that you want to view on the chart by selecting the metric names from the drop-down list above the chart.
NoteOnly commands or events that take longer than the specified amount of time to run or execute are recorded and displayed. For information about how to troubleshoot issues associated with instance latency, see Suggestions for handling common latency events.
Metric
Description
Events
The name of the event.
Total
The total number of occurrences of the event.
Ave. Latency (μs)
The average latency of the event. Unit: μs.
Max. Latency (μs)
The maximum latency of the event. Unit: μs.
Aggregation of Instances (Latency < 1 ms)
The number of occurrences of the event whose latency is lower than 1 ms. You can click the
 icon to view finer-grained statistics, such as the number of occurrences of the event whose latency is lower than 1 μs, 2 μs, 4 μs, 8 μs, 16 μs, 32 μs, 64 μs, 128 μs, 256 μs, and 512 μs. Note
Counting method: The number of occurrences of the event whose latency is from 0 μs to 1 μs is counted and displayed within the <1μs category, and the number of occurrences of the event whose latency is from 1 μs to 2 μs is counted and displayed within the <2μs category. Other categories follow the same pattern.
<2ms
<4ms
...
>33s
The number of occurrences of the event whose latency is within the specified range.
NoteCounting method: The number of occurrences of the event whose latency is from 1 ms to 2 ms is counted and displayed within the <2ms category, and the number of occurrences of the event whose latency is longer than 33s is counted and displayed within the >33s category. Other categories follow the same pattern.
Common special events
Category | Name | Threshold | Description |
Memory eviction | EvictionDel | 30 ms | The amount of time required to delete evicted keys in a specific eviction cycle. |
EvictionLazyFree | 30 ms | The amount of time that background threads take to release the memory in a specific eviction cycle. | |
EvictionCycle | 30 ms | The amount of time required to perform an eviction. An eviction cycle involves the time required to select and delete data that you want to evict and the time spent on waiting for background threads. | |
Memory defragmentation | ActiveDefragCycle | 100 ms | The amount of time required to defragment memory. |
Rehash | Rehash | 100 ms | The amount of time required to perform a rehash. |
Data structure upgrade | ZipListConvertHash | 30 ms | The amount of time required to convert a ziplist to a dictionary by means of hash encoding. |
IntsetConvertSet | 30 ms | The amount of time required to convert an intset to a set by means of set encoding. | |
ZipListConvertZset | 30 ms | The amount of time required to convert a ziplist to a skiplist by means of ziplist encoding. | |
Append-only file (AOF) | AofWriteAlone | 30 ms | The amount of time required to write an AOF as expected. |
AofWrite | 30 ms | The amount of time required to write an AOF. Each time an AOF is successfully written, an AofWrite event and one of the following three events are recorded: AofWriteAlone, AofWriteActiveChild, and AofWritePendingFsync. | |
AofFstat | 30 ms | Fstat latency. | |
AofRename | 30 ms | The amount of time required to rename an AOF. | |
AofReWriteDiffWrite | 30 ms | The amount of time consumed by an incremental AOF write performed by a parent process after its child process rewrites an AOF. | |
AofWriteActiveChild | 30 ms | The amount of time required to write an AOF to a disk. Other child processes may write data to the disk when the AOF is written. | |
AofWritePendingFsync | 30 ms | The amount of time required to write an AOF. A background process may be performing a fsync operation when the AOF is written. | |
Redis database (RDB) file | RdbUnlinkTempFile | 50 ms | The amount of time required to delete a temporary RDB file after a bgsave child process is terminated. |
Others | Commands | 30 ms | The time it takes to execute regular commands that are not marked with @fast. |
FastCommand | 30 ms | The time it takes to execute commands that are marked with @fast. These commands have a time complexity of O(1) or O(log N). | |
EventLoop | 50 ms | The amount of time required to run a main event loop. | |
Fork | 100 ms | The amount of time required to call a fork operation. | |
Transaction | 50 ms | The actual amount of time consumed by a transaction. | |
PipeLine | 50 ms | The amount of time consumed by a multi-threaded pipeline. | |
ExpireCycle | 30 ms | The amount of time required to clear expired keys at a time. | |
ExpireDel | 30 ms | The amount of time required to delete expired keys in a specific cycle for clearing the keys. | |
SlotRdbsUnlinkTempFile | 30 ms | The amount of time required to delete a temporary RDB file from a slot after a bgsave child process is terminated. | |
LoadSlotRdb | 100 ms | The amount of time required to load an RDB file from a slot. | |
SlotreplTargetcron | 50 ms | The amount of time required to load an RDB file from a slot to a temporary database and then migrate the file to a destination database using a child process. |