DAS Agent is an intelligent database operations and maintenance (O&M) assistant powered by Large Language Model (LLM) technology. It integrates insights from over 100,000 Alibaba Cloud support tickets and expert experience to resolve daily O&M and stability issues for cloud databases. DAS Agent provides a complete and autonomous solution for problem detection, diagnosis, and optimization. This ensures that your databases are efficient, stable, and reliable.
Prerequisites
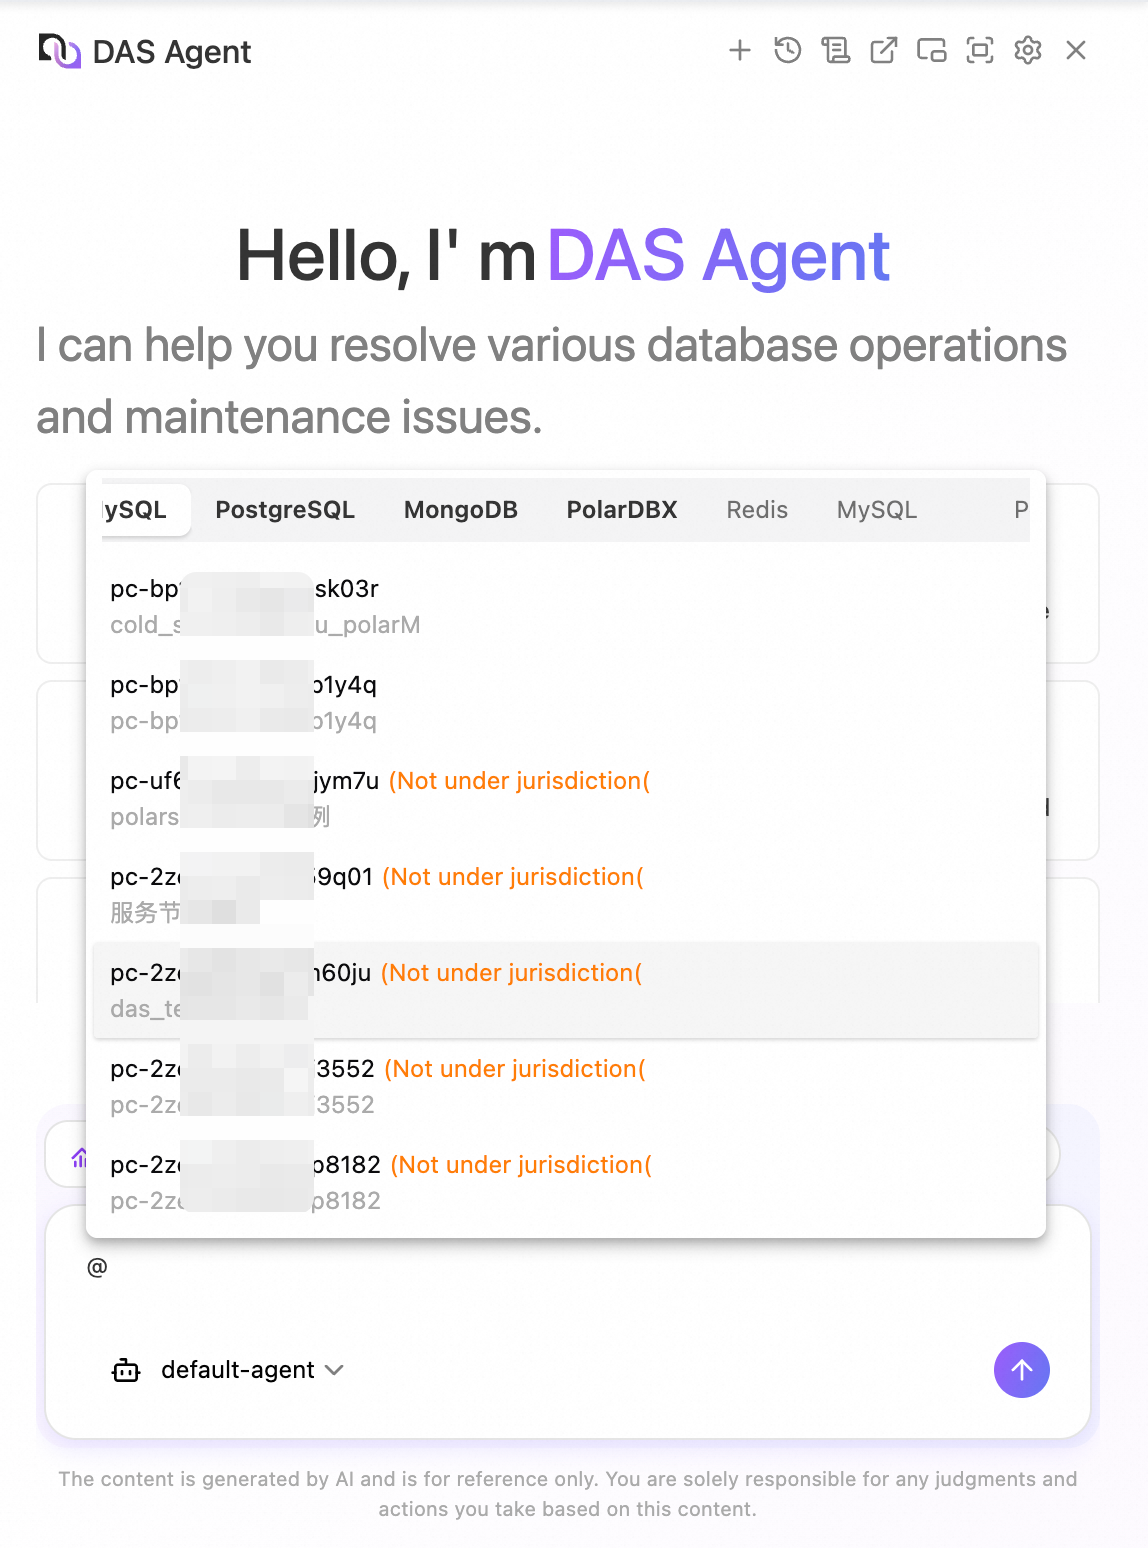
The target database must be connected to Database Autonomy Service (DAS).
Mainstream databases are supported.
MySQL: RDS MySQL, PolarDB for MySQL, MySQL from other cloud vendors, and on-premises MySQL.
PostgreSQL: RDS PostgreSQL, PolarDB for PostgreSQL, PostgreSQL from other cloud vendors, and on-premises PostgreSQL.
Redis: ApsaraDB for Tair (Redis-compatible), Redis from other cloud vendors, and on-premises Redis.
MongoDB: ApsaraDB for MongoDB, MongoDB from other cloud vendors, and on-premises MongoDB.
SQL Server: RDS SQL Server.
Distributed database: PolarDB-X.
Notes
If you use a Resource Access Management (RAM) user to access DAS Agent, ensure that the RAM user has management permissions for DAS and the database instance.
To integrate the intelligent O&M capabilities of DAS Agent into a non-DAS console or other business systems, you can submit a ticket.
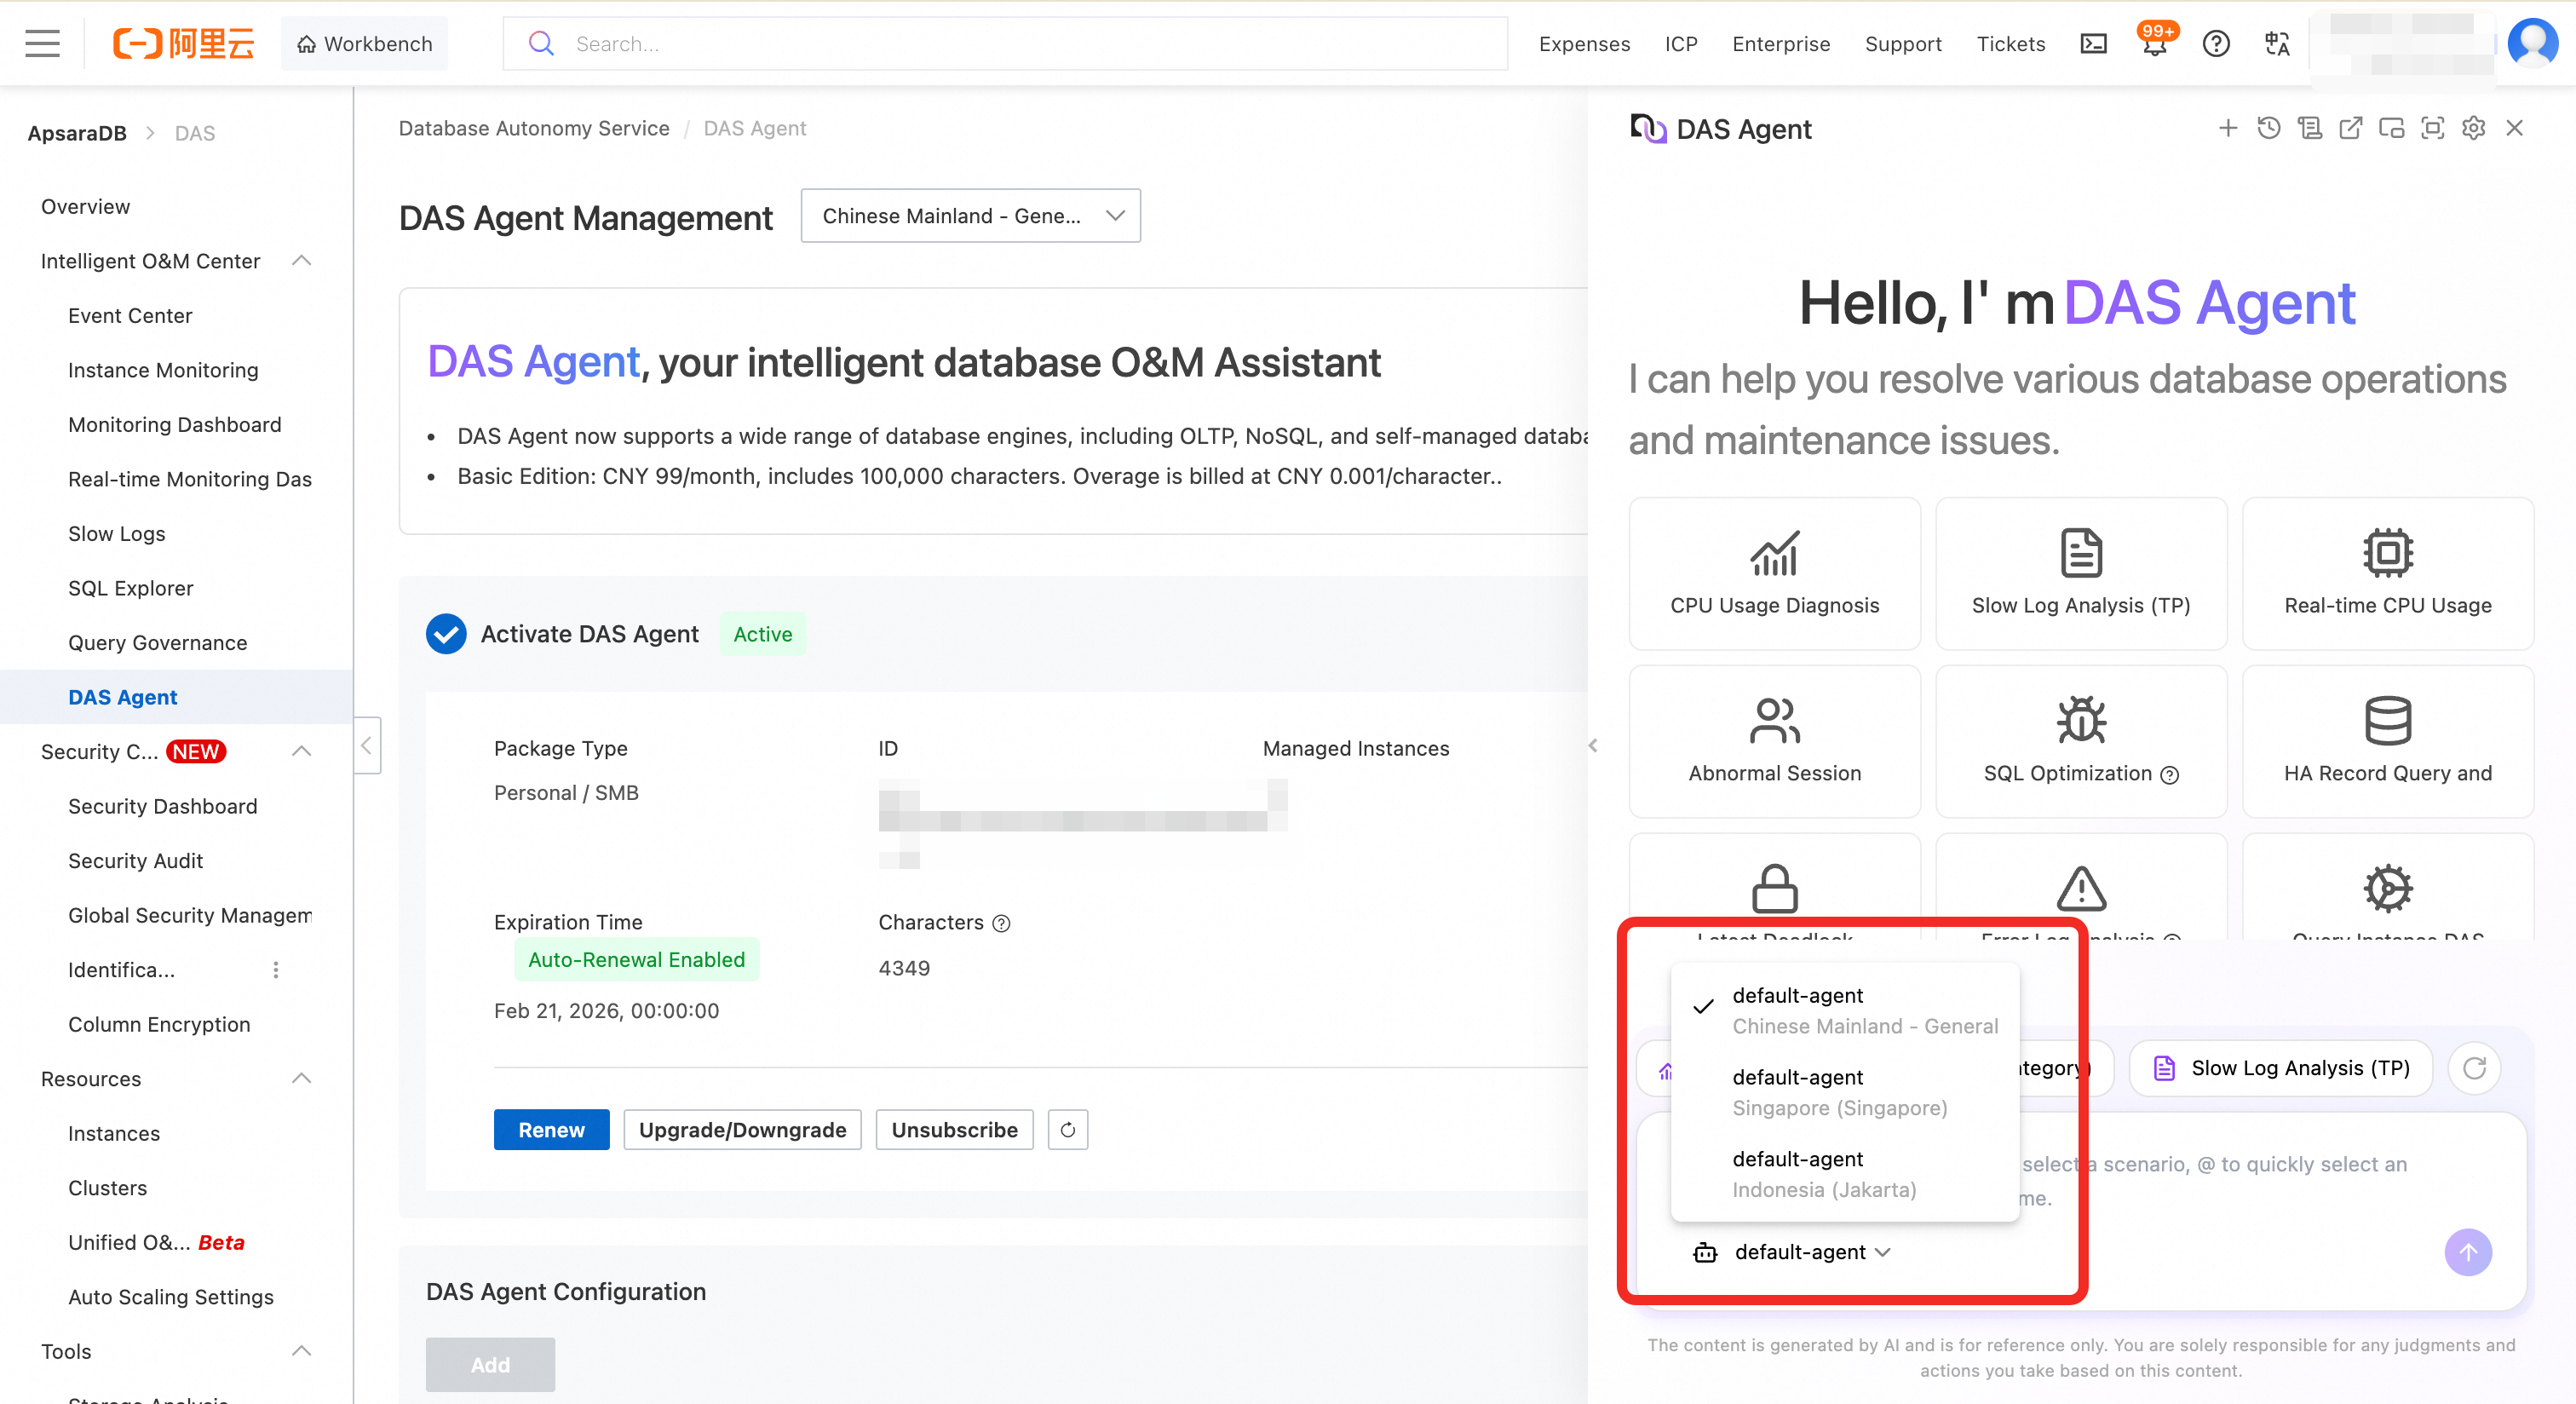
Data security regulations vary by country and region. Therefore, a single LLM service cannot manage database instances across different locations. If you have instances in multiple regions, you must activate DAS Agent separately for each country or region. For example, instances in the Chinese mainland (such as Beijing, Shanghai, Hangzhou, and Guangzhou) can share one DAS Agent. However, instances in the United States, Singapore, and Indonesia each require a separate DAS Agent activation in their respective countries or regions.
DAS Agent outside China relies on the Alibaba Cloud Model Studio (Bailian) LLM. Model Studio is currently deployed only in Singapore and the United States. Therefore, model calls are routed to the nearest of these two regions. After Model Studio is available in more countries or regions, DAS Agent will automatically migrate to the local Model Studio service.
Note: This applies only to cross-border calls to the Model Studio model. Data, such as database audit logs, always remains in the region where the instance is located.
Billing
For more information, see DAS Agent pricing.
Features
Feature | Status | Description |
Database Q&A | Supported | The knowledge base extends from general database knowledge to internal documents accumulated and organized by senior Alibaba Cloud industry experts over many years. It covers major online transactional processing (OLTP) and NoSQL engine types. The knowledge base includes various topics, such as anomaly handling suggestions, upgrade or downgrade recommendations, and change impact analysis. |
Database anomaly diagnosis | Supported | Covers various OLTP and NoSQL scenarios. These include metric and anomaly queries, real-time diagnostics (CPU, memory, and session), lock analysis, latency insight (Tair), large key analysis (Tair), slow SQL analysis (OLTP and MongoDB), and SQL optimization. The SQL optimization feature includes a dry run optimization for both executed and unexecuted SQL statements. It also includes database security risk detection. DAS Agent performs intelligent analysis to identify root causes and provide optimization and immediate remediation suggestions. Note At this stage, suggestions still require manual approval. The feature for automatic execution by the LLM is not yet available. |
Intelligent O&M report | Supported | Provides a unified O&M report for multiple instances under your account, supporting cross-engine analysis. The report includes metric trend comparison analysis, optimization suggestions, and monitoring recommendations. Note Currently, only daily reports are supported. Weekly and monthly reports, along with customizable report templates, will be available in the future. |
Anomaly detection and alerts | Not supported | This feature will provide anomaly detection and alerts based on performance trend monitoring metrics. |
Anomaly diagnosis scenarios
Scenario | Description | Supported database instances | Required parameters for diagnosis |
SQL diagnosis and optimization | Analyzes SQL statements executed in a specified database and provides suggestions for potential performance issues and optimizations. |
|
|
Real-time CPU diagnosis (MySQL) | Diagnoses the cause of abnormal CPU usage by collecting relevant data in real time. |
|
|
Real-time CPU diagnosis (Tair/Redis) | Performs real-time diagnosis of abnormal CPU usage for ApsaraDB for Tair (Redis-compatible) instances. It analyzes the root cause based on real-time session data, large keys, and hot keys. | Tair (Redis® OSS-Compatible) |
|
Abnormal session detection | Analyzes abnormal sessions by querying |
|
|
Slow Log Analysis (TP) | Identifies various problematic SQL statements based on slow query log statistics and provides corresponding optimization suggestions. |
|
|
Anomalous security events | Queries for anomalous security events in database instances under your Alibaba Cloud account. These events include account cracking attempts, sensitive data downloads, abnormal logons, large-scale data deletion in a short period, and dictionary attacks. This helps you quickly identify potential security threats, analyze the context of anomalous activities, and take targeted protective measures to improve database security and compliance. |
| None |
Overview of instances to be optimized | Queries for a list of database instances under your Alibaba Cloud account that require attention. This includes instances with database payload changes, sudden CPU spikes, sudden I/O spikes, high IOPS, sudden instance memory increases, and an abnormal number of slow query logs. |
| Time range (start_time and end_time) |
Instance information query | Queries for information about database instances under your Alibaba Cloud account. This includes but is not limited to the database engine type, database engine version, instance ID, instance alias, instance region, and instance status. You can filter by database engine type or keyword. |
|
Note Both parameters are optional. |
HA query analysis | Queries and analyzes the primary/secondary switchover records of RDS MySQL instances and outputs a concise report. | RDS MySQL |
|
Error log analysis | Analyzes deadlock, Warning, and Error level logs in the database instance's error log. It returns detailed deadlock information and the causes of the error logs. Important
|
|
|
Instance configuration query | Queries the configuration and status information of a database instance. This includes metadata such as log settings, storage policies (hot/cold storage), audit features, Performance Insight status, and migration and version support. |
| Instance ID |
CPU usage diagnosis (MySQL) | Diagnoses the cause of abnormal CPU usage by obtaining relevant data such as sessions, slow query logs, and SQL Explorer data for a specified period. |
|
|
Recent deadlock analysis | Analyzes the latest deadlock log from the information returned by the |
|
|
Memory anomaly diagnosis (MySQL) | Analyzes whether the memory usage of the database instance is abnormal. If an anomaly is found, it further analyzes the cause. If no anomaly is found, it alerts you to potential memory risks. |
|
|
Memory anomaly detection (MySQL) | Analyzes whether the memory usage of the database instance is abnormal. If an anomaly is found or if usage remains high for a long time, it provides common reasons for abnormal or high memory usage. |
|
|
Slow Log Analysis (MongoDB) | Identifies various problematic query templates based on MongoDB slow query log statistics. It recommends a list of QueryIDs that require attention and provides corresponding handling suggestions. | ApsaraDB for MongoDB |
|
Monitoring metric query | Queries metrics for a database instance, such as CPU usage, memory usage, and storage space usage. |
|
|
Latency insight interpretation (Tair/Redis) | Analyzes latency data for proxy nodes or data nodes based on the latency insight data of ApsaraDB for Tair (Redis-compatible) instances. It identifies commands or nodes with high latency. | ApsaraDB for Tair (Redis-compatible) |
|
Large key query analysis | Analyzes historical large keys of an ApsaraDB for Tair (Redis-compatible) instance and returns corresponding hot key information. | ApsaraDB for Tair (Redis-compatible) |
|
Security baseline changes | Queries the security baseline change trends for a database instance within a specified time range. This helps you understand the evolution of the instance's secure configuration, identify risk improvements, deteriorations, or long-unrepaired items, and provides actionable remediation guidance to enhance database security and compliance. |
|
|
Latest security baseline | Queries the latest security baseline inspection results for each database instance under your Alibaba Cloud account. This helps you understand the security configuration status of your databases, identify potential threats, and provides practical remediation guidance to enhance database security and compliance. |
| None |
Sensitive data discovery | Queries the sensitive data scan results for each database instance under your Alibaba Cloud account and provides detailed information on data classification and categorization. This helps you understand if sensitive data exists in your database instances, its distribution, and its risk level, supporting data security management and compliance checks. |
| None |
Instance topology query | Queries the topology information of a database instance and the detailed information of each node. |
| Instance ID |
Procedure
Go to the DAS Agent page.
PC
Log on to the DAS console.
Click the DAS Agent icon.
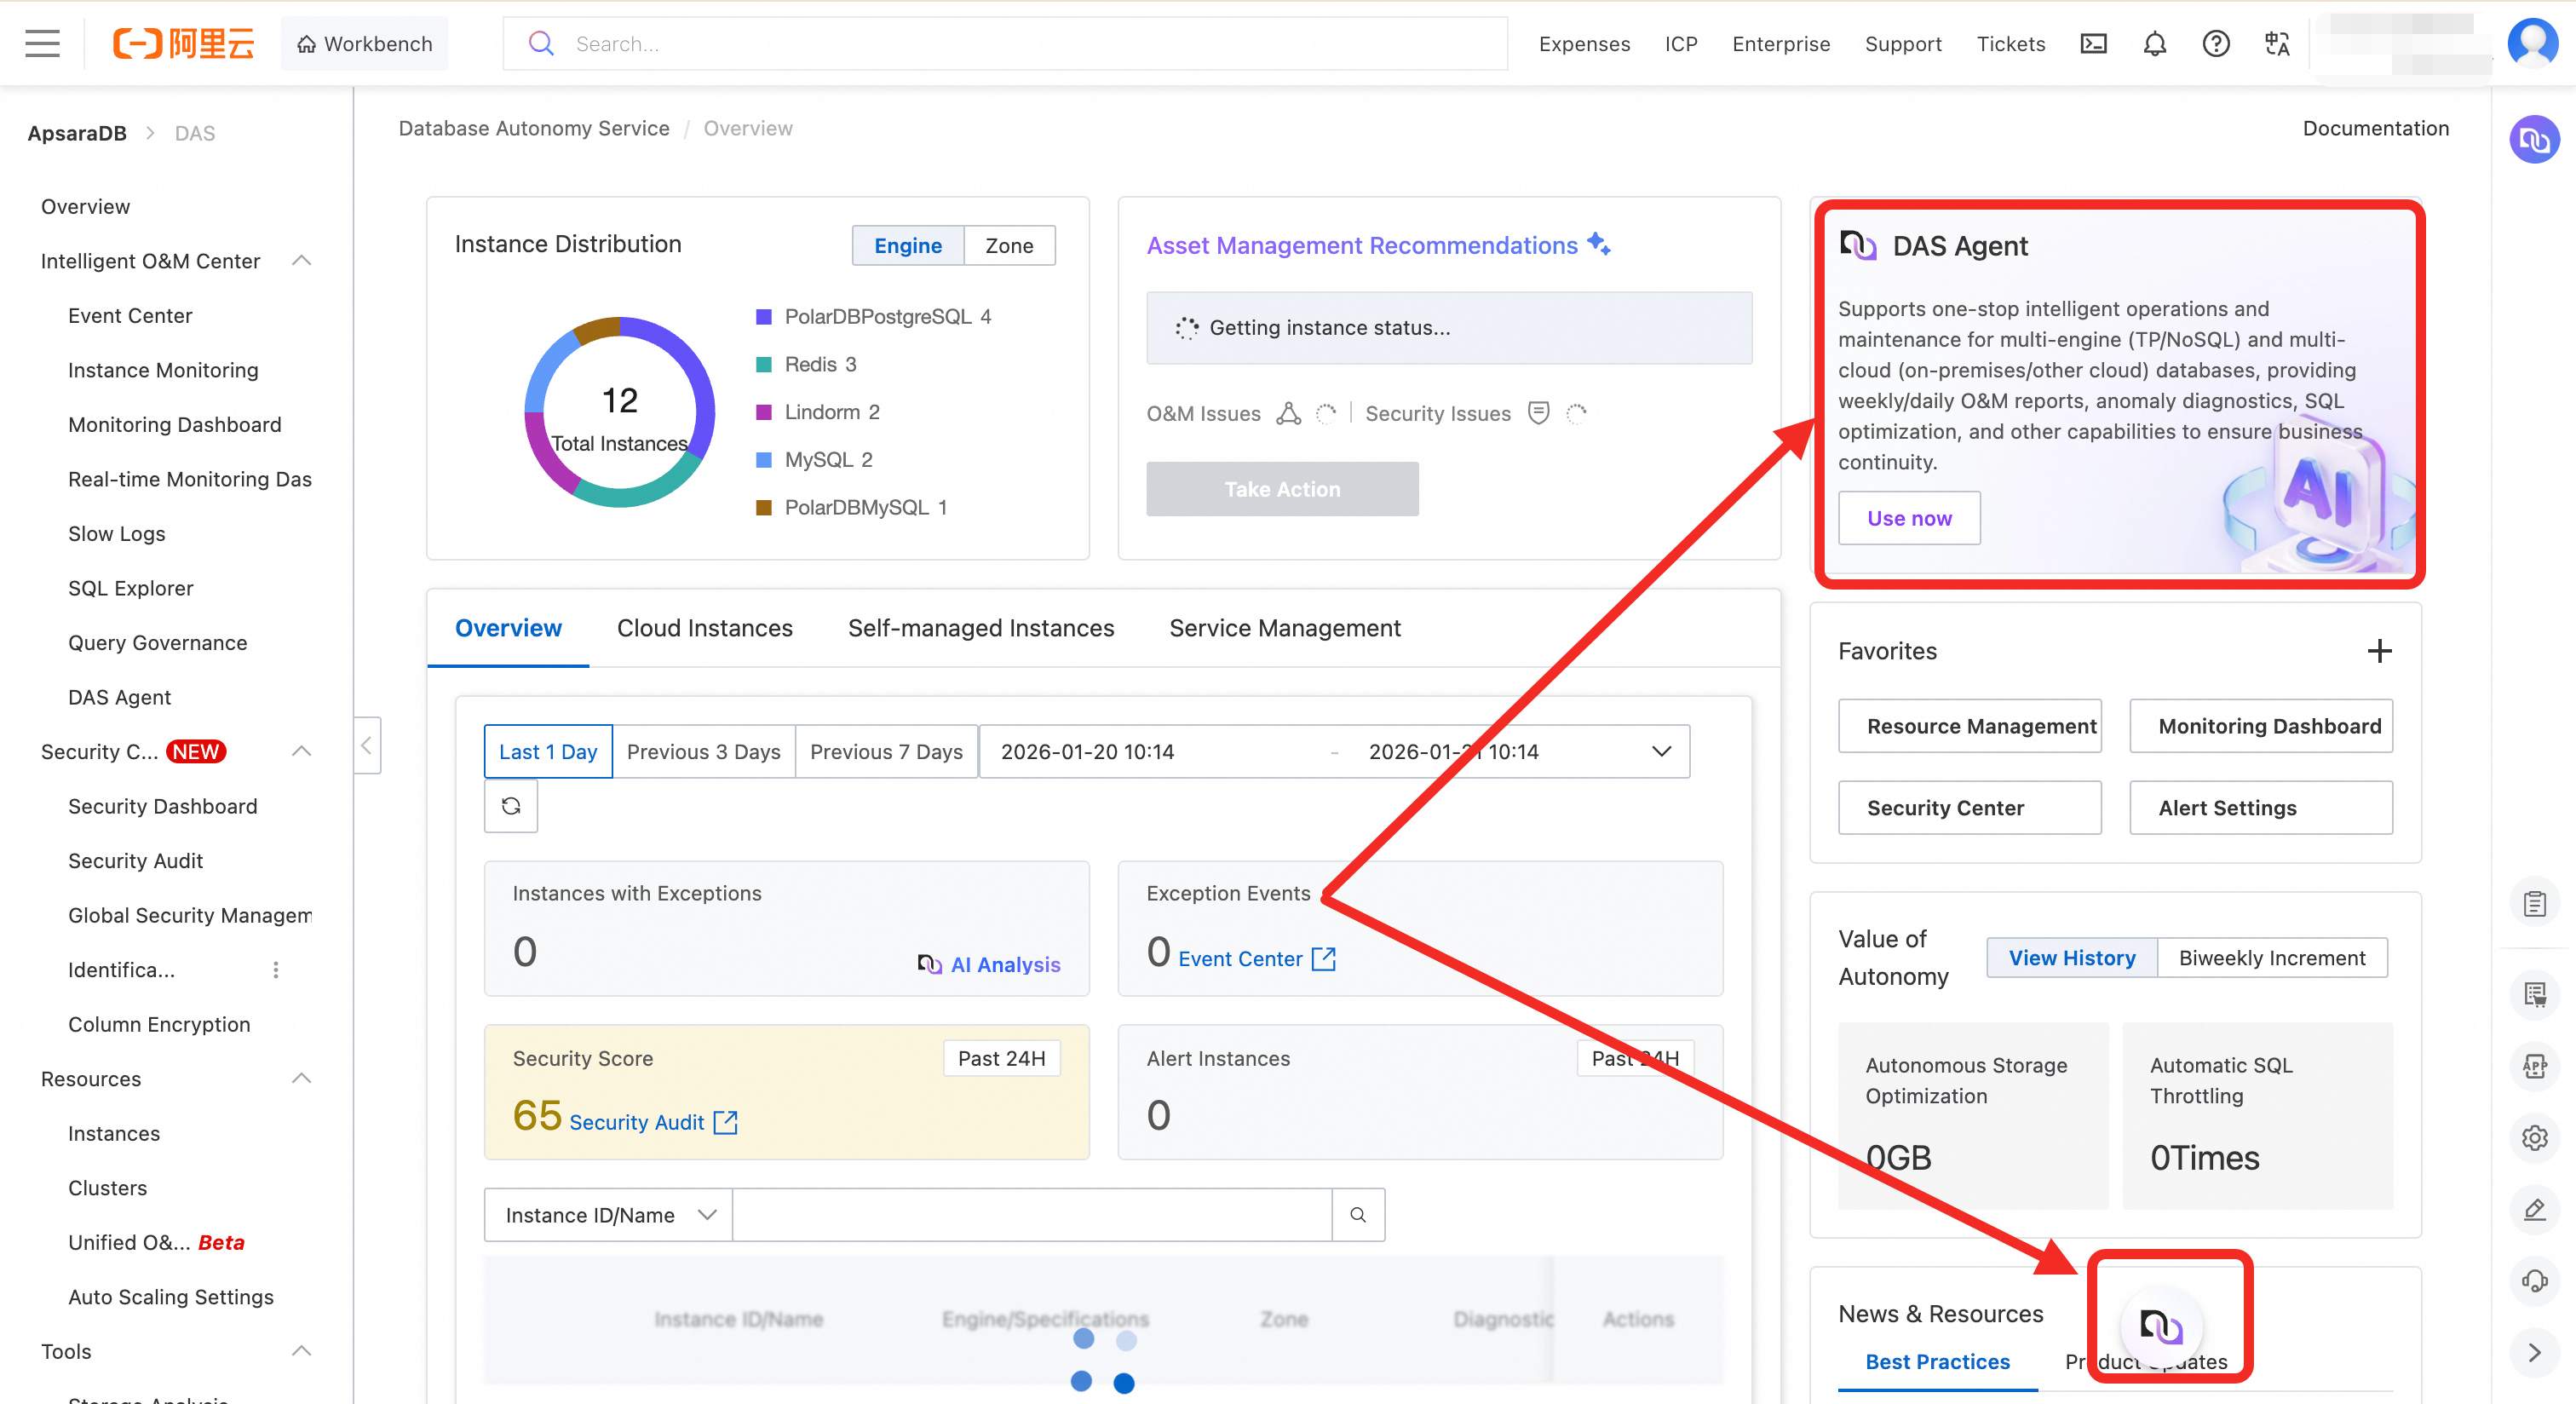
Select an appropriate instance type and complete the purchase. For more information about specifications and billing, see DAS Agent pricing.
Mobile web
Go to the DAS Agent page and log on.
NoteYou can access DAS Agent on a mobile device only through a web browser. Access from within an application is not supported.
Configure DAS Agent.
After you complete the purchase, you must configure DAS Agent to manage different instance groups. DAS provides different management capabilities based on the edition:
Basic Edition (formerly Personal Edition): Supports only one agent to manage up to 10 instances.
Enterprise Edition: Allows you to configure multiple agents to manage different instance groups separately. It also allows a single instance to be managed by multiple agents simultaneously. This is useful in scenarios where multiple DBAs are responsible for the same group of instances in shifts.
Configuration steps:
Log on to the Agent Management page.
(Optional) Click the Add button on the list page. The Enterprise Edition lets you create multiple agents and specify which instances each agent manages.
Edit the agent configuration.
In the Actions column of the target agent, click Edit to open the Edit Configuration page.
In the Associated Instances section, select the instance IDs you want the agent to manage, and then click OK to complete the configuration.
Feature limitations.
After configuration, each agent can perform queries, diagnostics, and interactive operations only on the instances it manages.
Scenario examples:
API integration with your own systems
If you integrate DAS Agent into your own systems using APIs, you can use different agent IDs to connect. This allows different personnel, such as DBAs or developers, to access and operate only the instances within their permission scope.
Console dialog usage
When you work directly in the console, you must switch to the agent for the specific country or region to manage the instances in that region.
Configure permissions.
To ensure system security and operational compliance, you must configure appropriate access permissions for the user account before you use DAS Agent. DAS provides two built-in system policies for different roles and scenarios:
Policy Name
Permission Level
Main Capabilities
AliyunHDMReadOnlyAccessRead-only permission
View all instances within the current account's permission scope in the DAS console.
Cannot perform any change operations, such as restarts or parameter modifications.
Use DAS Agent's intelligent diagnosis, performance analysis, and natural language interaction capabilities for permitted instances.
AliyunHDMFullAccessFull control
Has full control over all DAS features.
Can perform diagnosis, optimization, changes, exports, and other operations on all database instances under the current UID.
Includes all capabilities of
AliyunHDMReadOnlyAccess.
Configuration:
Log on to the RAM console.
In the navigation pane on the left, choose .
Find the target user and click Add Permissions in the Actions column.
In the Access Policy list, search for and select
AliyunHDMReadOnlyAccessorAliyunHDMFullAccess.Click OK to attach the policy.
Use the DAS Agent feature to initiate an AI diagnosis.
Initiate diagnosis from a diagnosis card
Click the card for the relevant scenario.
In the dialog box that appears, select the diagnosis object (instance ID), diagnosis time range, and other required parameters.
NoteThe required parameters vary by scenario. For more information, see the page. For example, for SQL Diagnosis and Optimization, you must enter the database and the SQL statement for analysis.
Click OK.
Initiate diagnosis through autonomous conversation
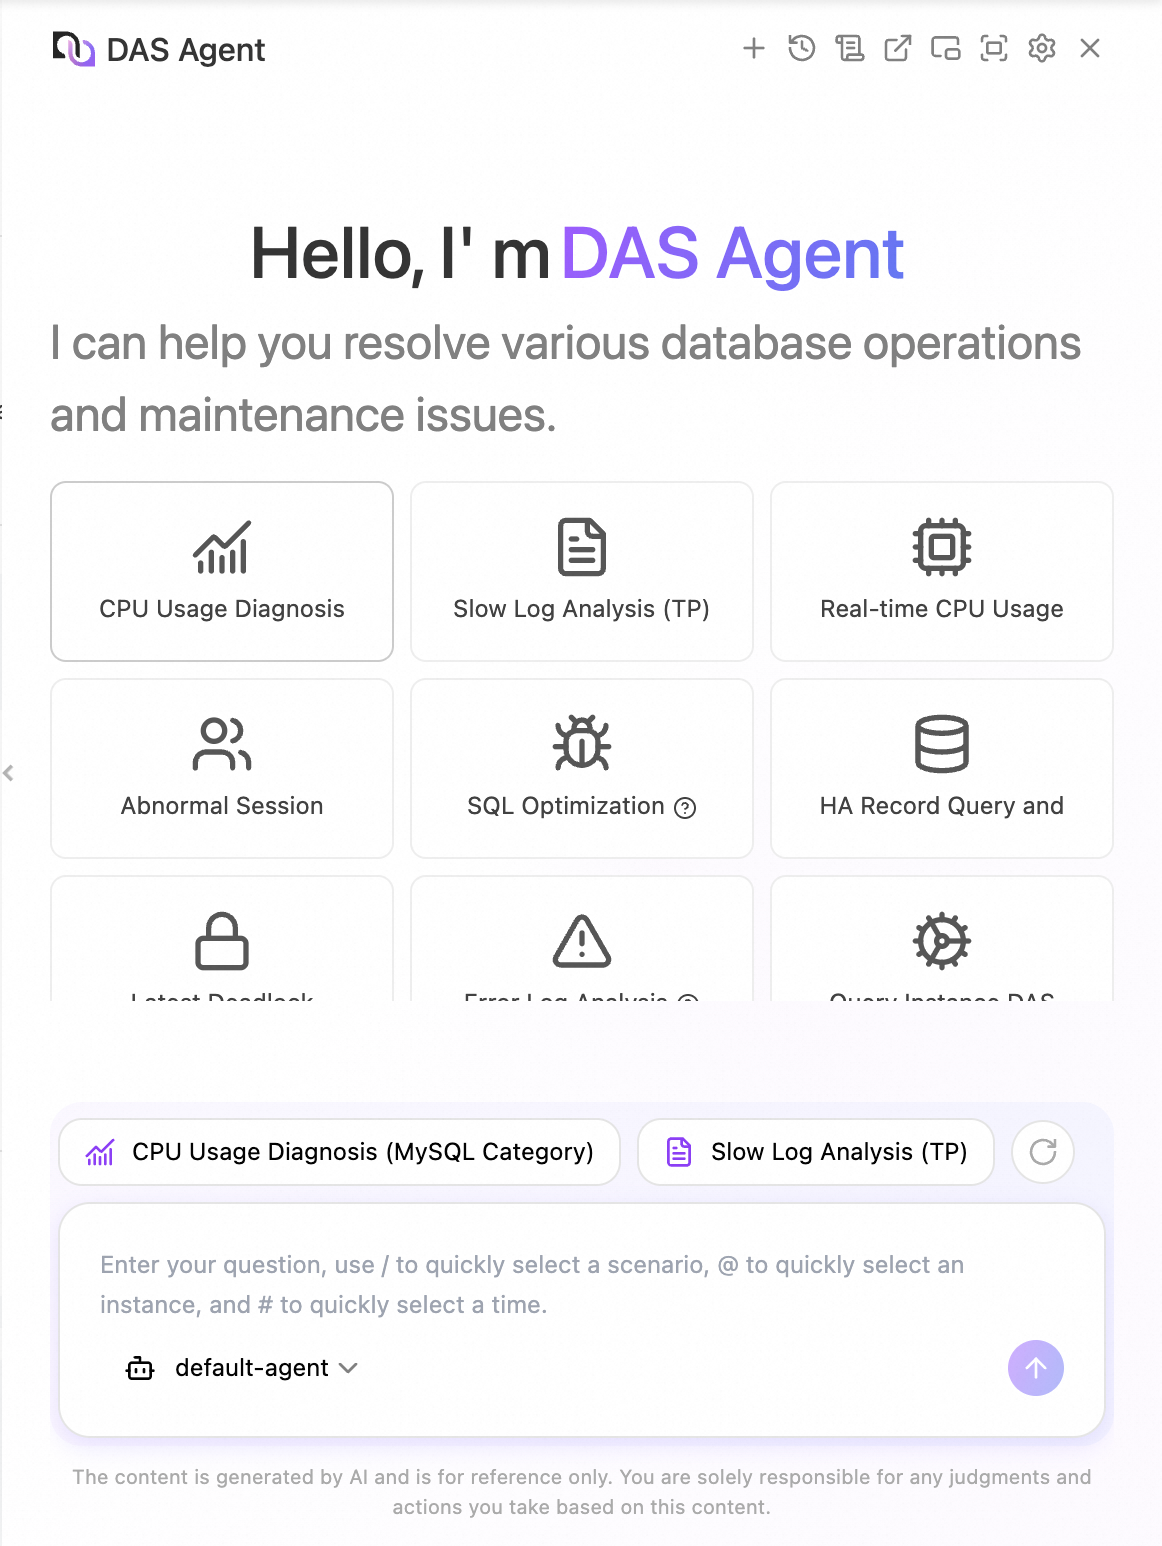
After you enter a question in the dialog box, DAS Agent automatically identifies your intent, matches the most relevant knowledge, and starts an intelligent diagnosis. With its Agentic diagnostic capabilities, the agent can autonomously plan a diagnostic path based on your question and dynamically adjust the subsequent steps based on execution feedback. For example, if you want to assess the health of an instance, it performs a comprehensive analysis from multiple dimensions, such as CPU usage, session count, memory usage, TPS, QPS, deadlocks, and slow SQL statements. If it finds a significant slow SQL issue, it performs an SQL optimization diagnosis and provides index suggestions or statement rewriting solutions.
You can also use the keyboard shortcuts /, @, or # to quickly open diagnostic scenarios, display instance lists, or select a time range.
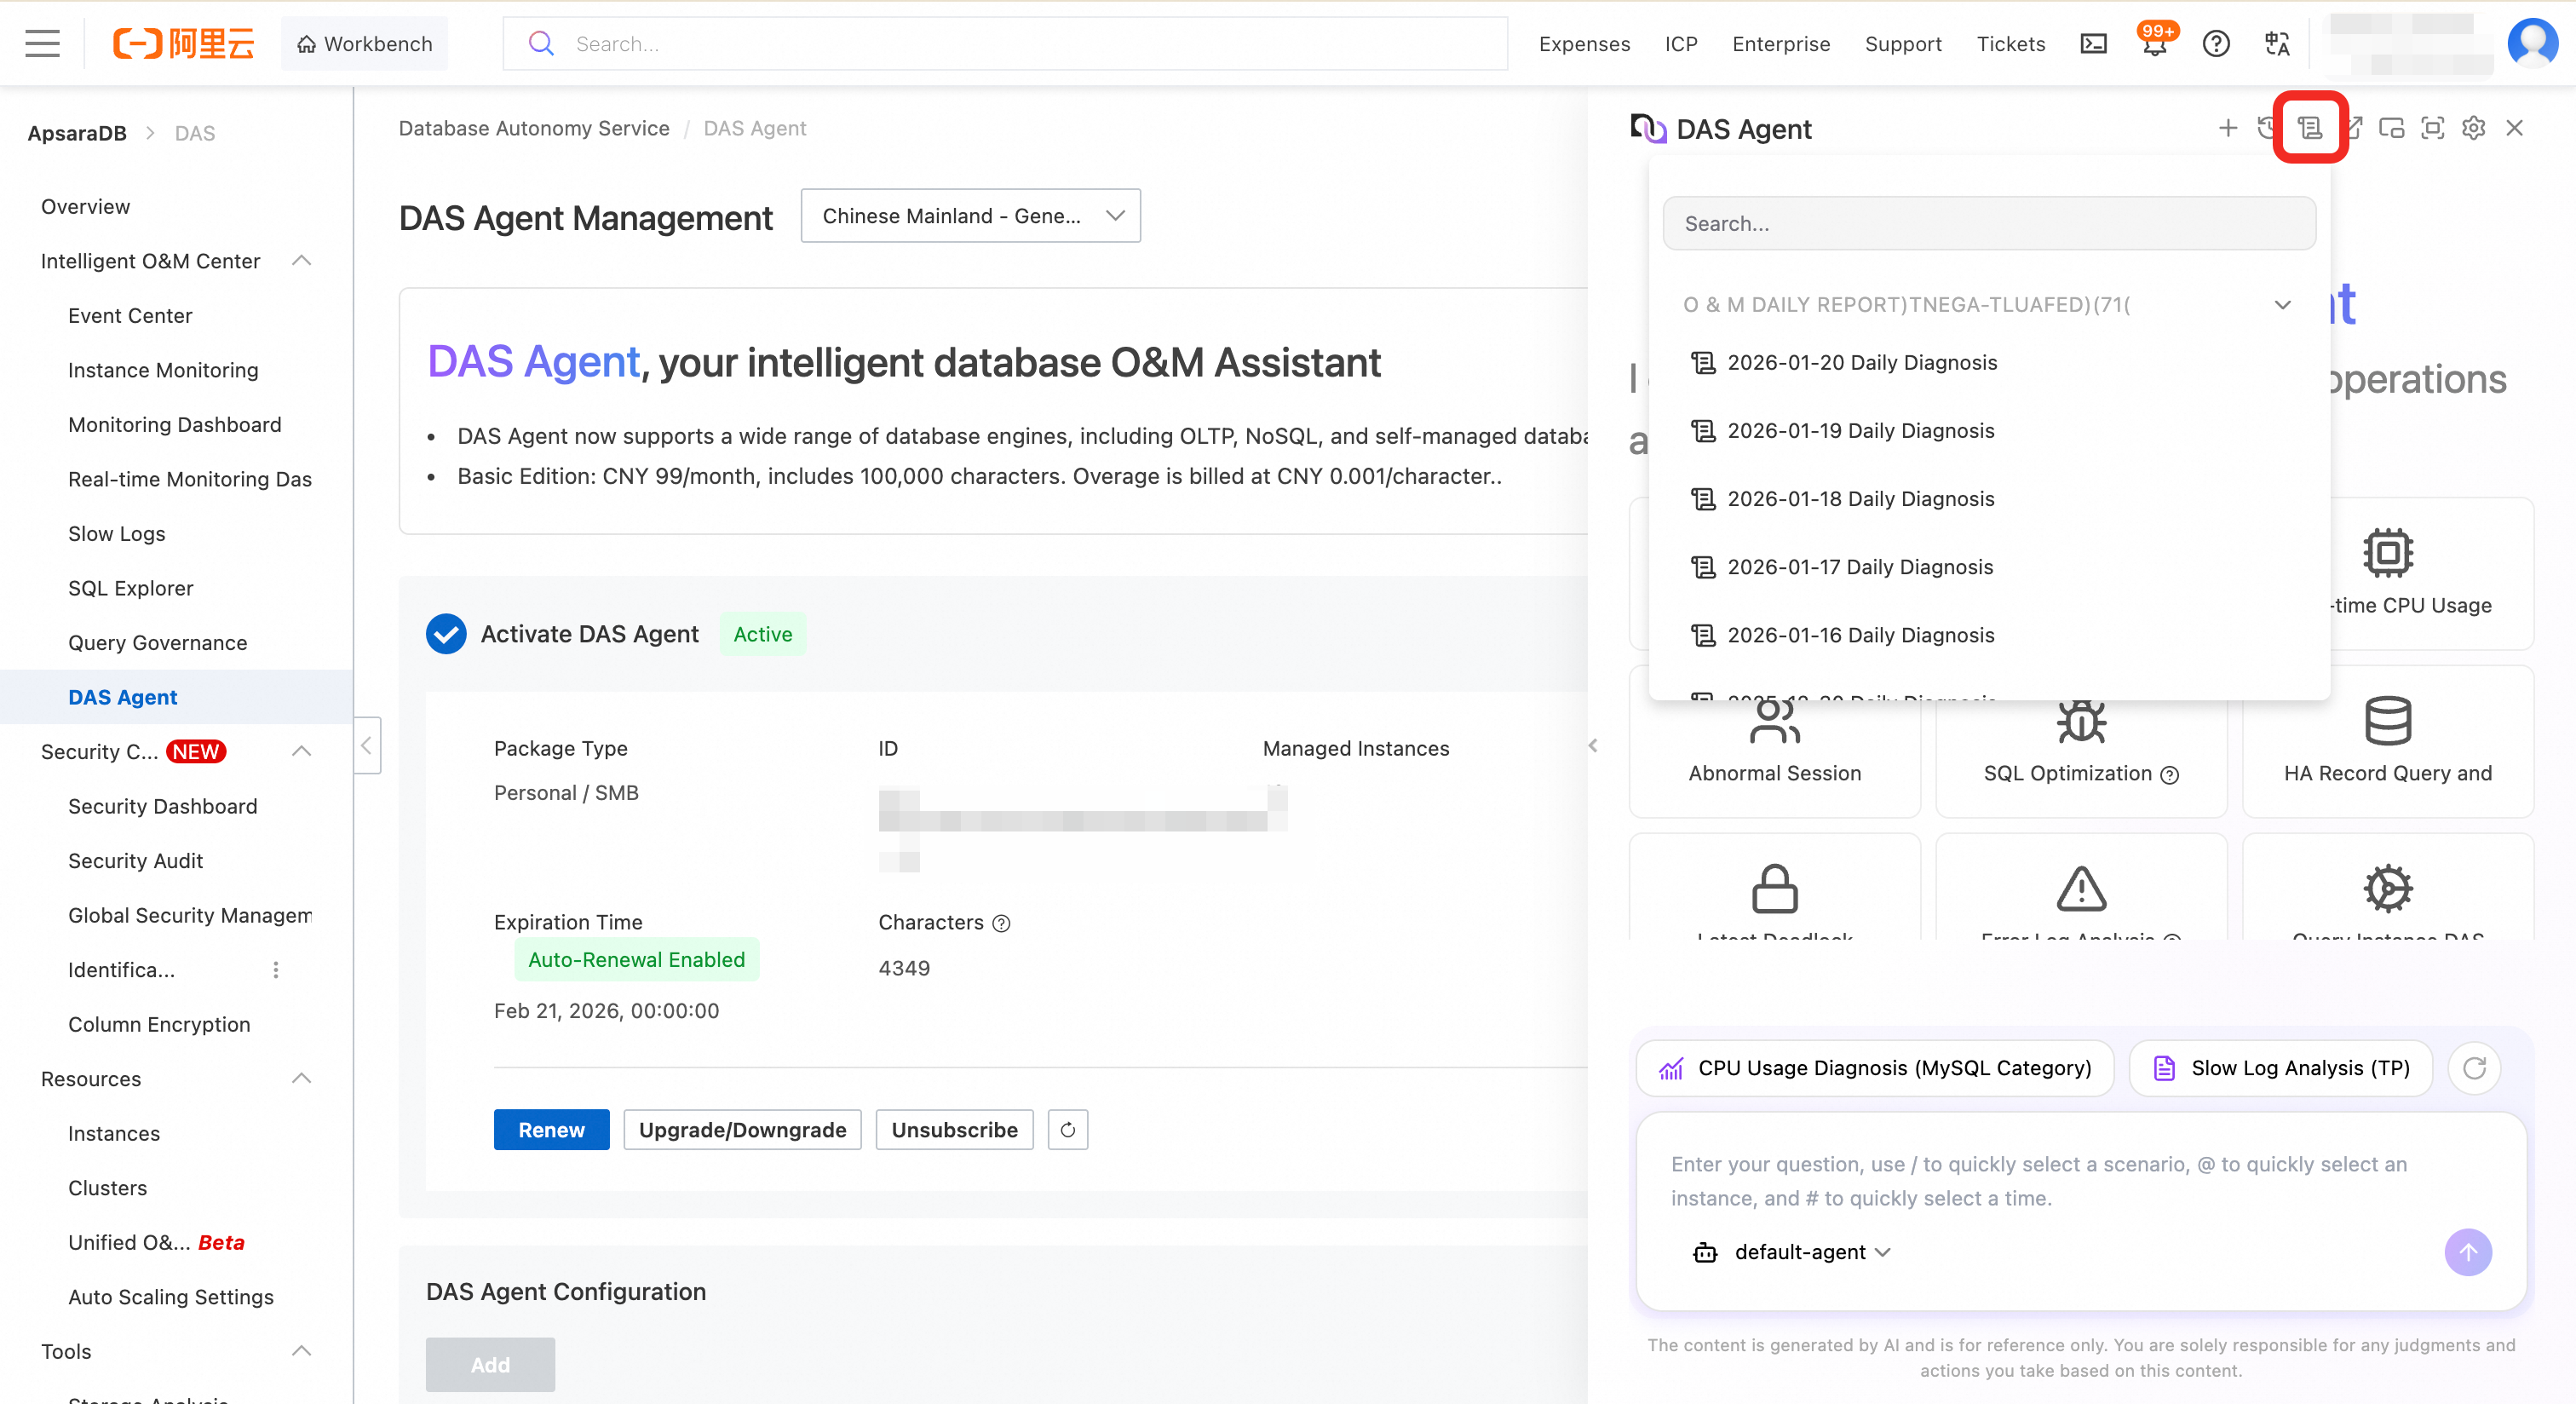
The Enterprise Edition of DAS Agent provides an intelligent O&M daily report for all managed database instances. This feature analyzes core O&M metrics, processing at least 200 million tokens per day, to provide deep insights and a structured summary. The analyzed metrics include anomaly alert details, key optimization suggestions such as high-value slow SQL identification, disk space usage trends, invalid index detection results, and key resource usage, including CPU, memory, and I/O. This process generates a unified and actionable O&M overview that helps teams understand the health status of their databases. The feature enables proactive risk warnings and precise optimization, providing data-driven support for decisions that ensure system stability and continuous performance improvement.
In the navigation pane on the left of the DAS console, choose .
Find the target diagnosis report.
In the Actions column of the target diagnosis report, click View Details.
You can also click the
 icon at the top of the DAS Agent page to view report information.