Mobile computing is a method that performs calculations on data based on sliding window technology. The window represents the range of data that participates in the calculation (for example, from one row before to one row after a specific value). This window advances step by step along the data, covering a new set of data points each time and performing specified calculations based on these data points. For example, if you calculate the average sales amount every 3 months, the first set of data covered by the window is January to March, the second set is February to April, and so on. By strategically selecting the window size and calculation type, you can effectively improve the quality and accuracy of data analytics. This topic describes how to configure mobile computing.
Prerequisites
You have created a dashboard. For more information, see Create a Dashboard.
A dataset is selected and chart fields are configured. For more information, see Configure Chart Fields.
Limitations
Totals and subtotals do not participate in mobile computing. If a field is configured with mobile computing, totals and subtotals will automatically become invalid (displayed as "-").
Empty values are not included in the mobile results. They do not affect other data results, and their own results remain empty (displayed as "-").
This analysis method is based on the returned result set calculation. The current limit in the public cloud is 10,000. If the total amount of returned data exceeds 10,000, the calculation results may not meet expectations.
You should sort data before performing mobile computing.
When you need to combine multiple datasets for calculation, associate the datasets first, and then perform calculations based on the complete associated dataset. If you calculate on unassociated datasets, the results may not match the actual situation.
When there are only measure fields in cross tables or detail tables, without dimension fields, mobile computing will not be available.
The charts that support mobile computing are shown below.
Mobile computing method
Description
Supported chart types
Overall mobile computing
Performs mobile computing on the overall data.
Line/Area charts: Line chart, Area chart, Stacked area chart, 100% stacked area chart, Combination chart.
Column/Bar charts: Column chart, Stacked column chart, 100% stacked column chart, Ring column chart, Ranking board, Bar chart, Stacked bar chart, 100% stacked bar chart, Waterfall chart, Bullet chart, Box plot, Histogram.
Bubble/Scatter charts: Bubble chart, Scatter chart, Facet scatter chart.
Table charts: Cross table, Detail table, Heat map.
Pie/Ring charts: Pie chart, Rose chart, Radar chart, Treemap chart.
Geographic charts: Color map, Bubble map, Heat map, Flow map, Symbol map.
Metric charts: Metric card, Metric trend chart.
Funnel/Conversion charts: Funnel chart, Comparison funnel chart.
Other charts: Word cloud.
Shift within group
Groups data by a certain dimension and performs mobile computing on data within the group.
Table charts: Cross table.
Configuration Entry
In the Fields panel of the chart, find the measure field that needs to use mobile computing, click the  icon on its right, and select Advanced Calculation > Mobile Computing from the dropdown list. Then set the mobile computing method according to your actual business scenario.
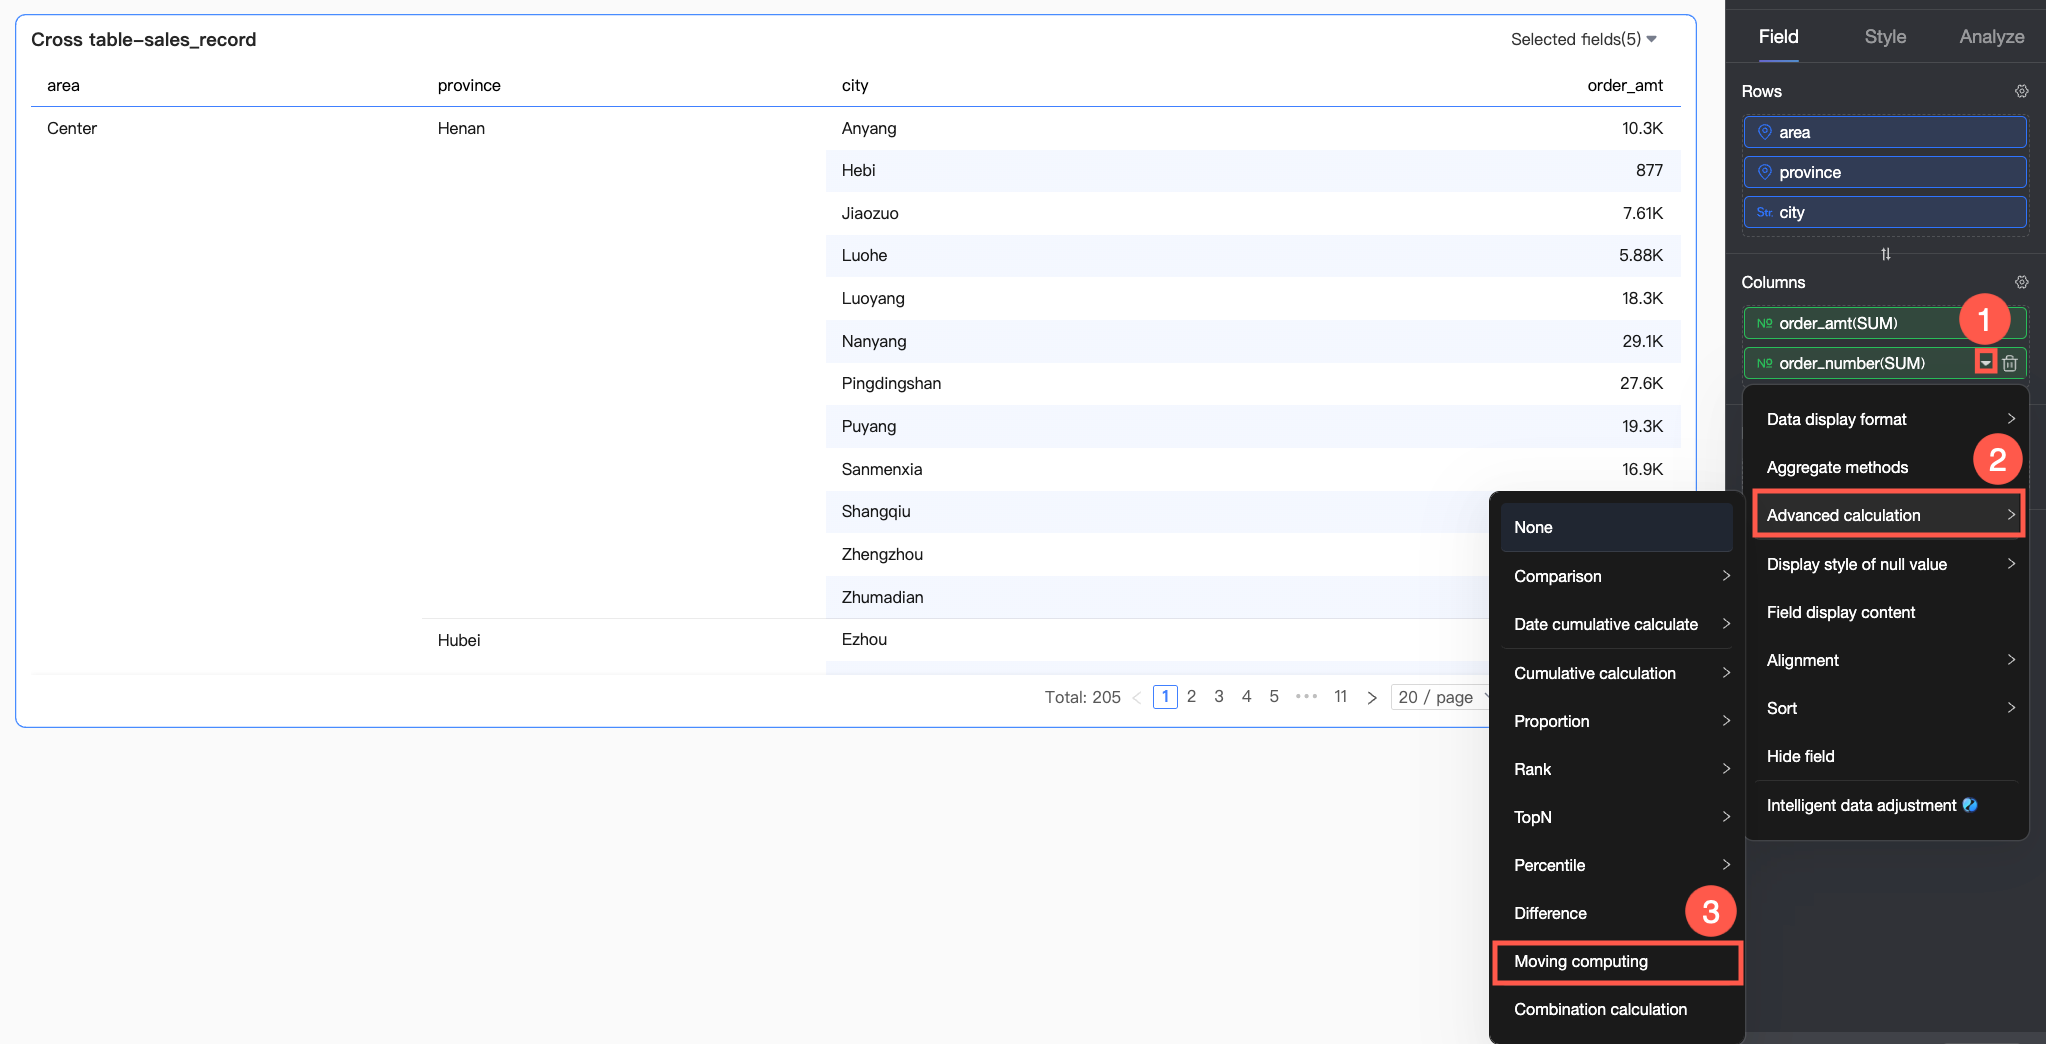
The mobile computing configuration for cross tables differs from other charts. The specific descriptions are as follows.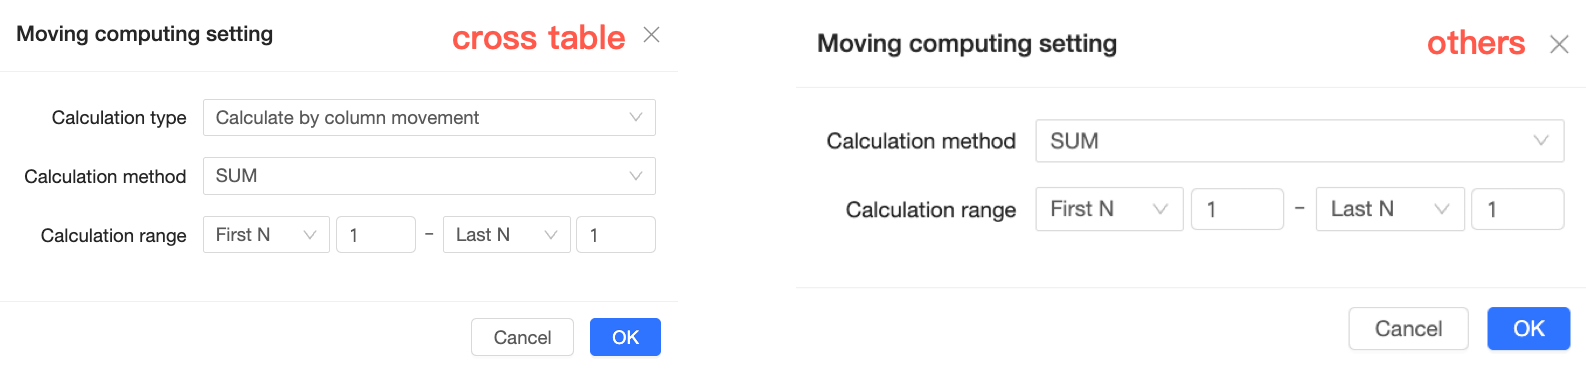
Chart type | Calculation type | Limitation | Calculation logic |
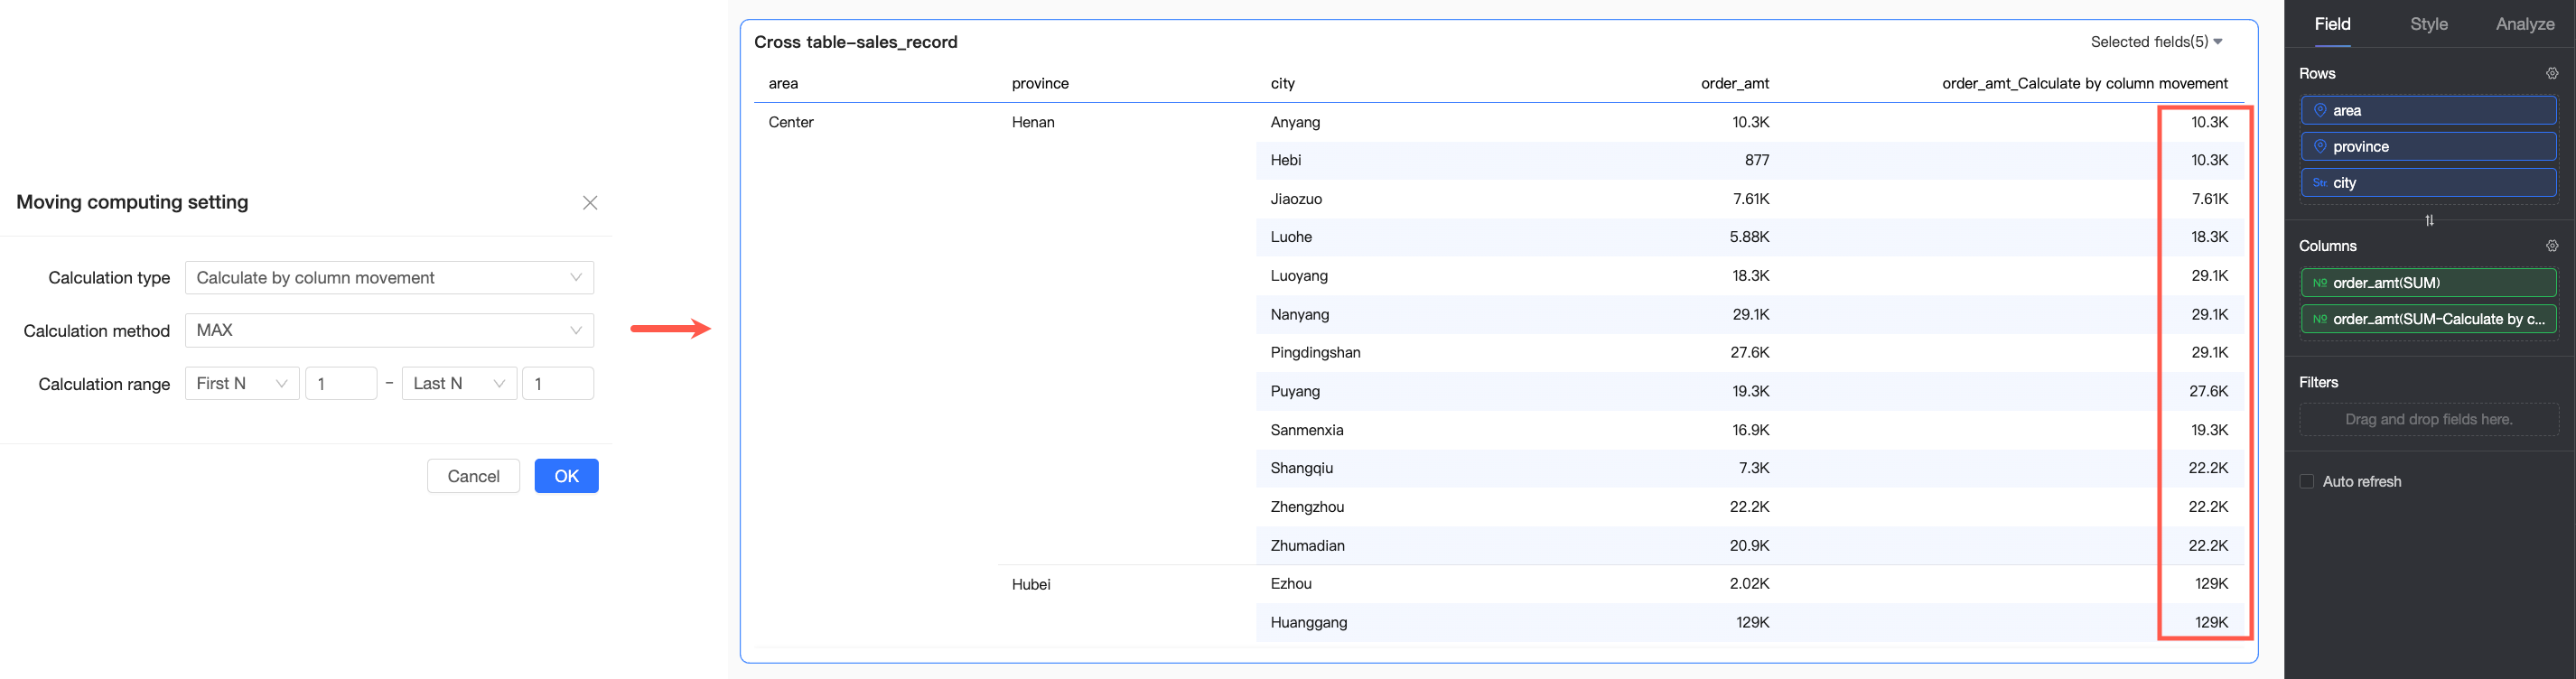
Cross table | Mobile computing by column | The Row area has dimension fields | Performs mobile computing with each column as an independent analysis unit. |
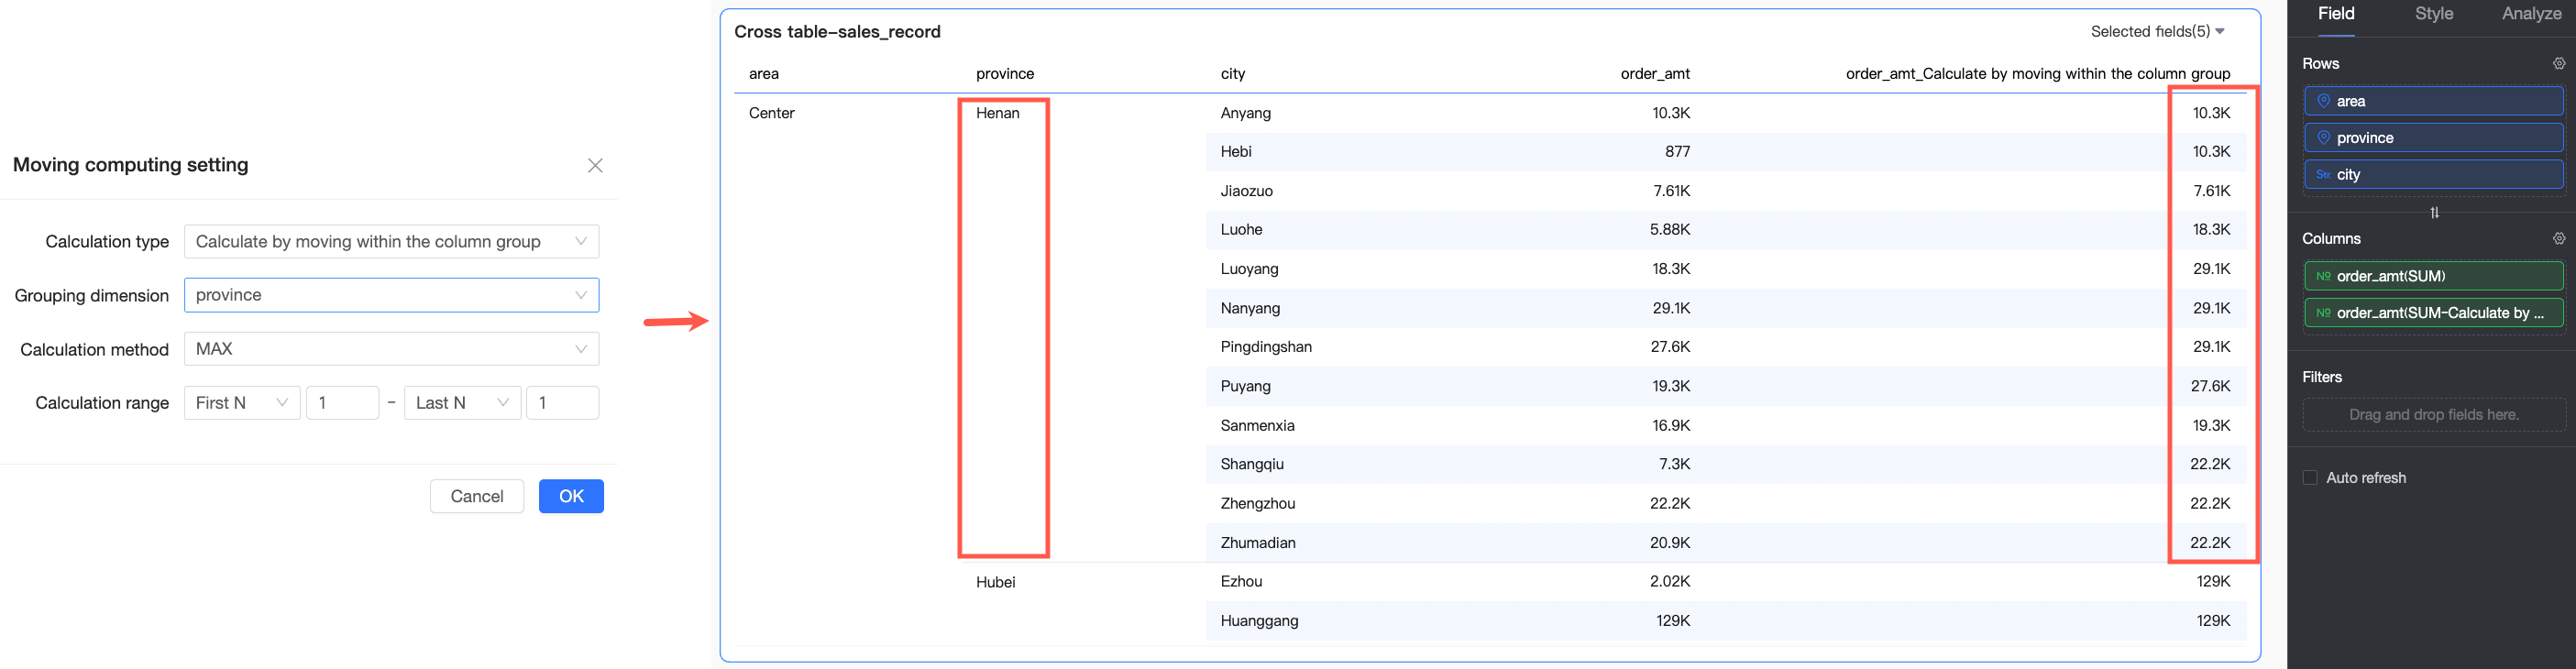
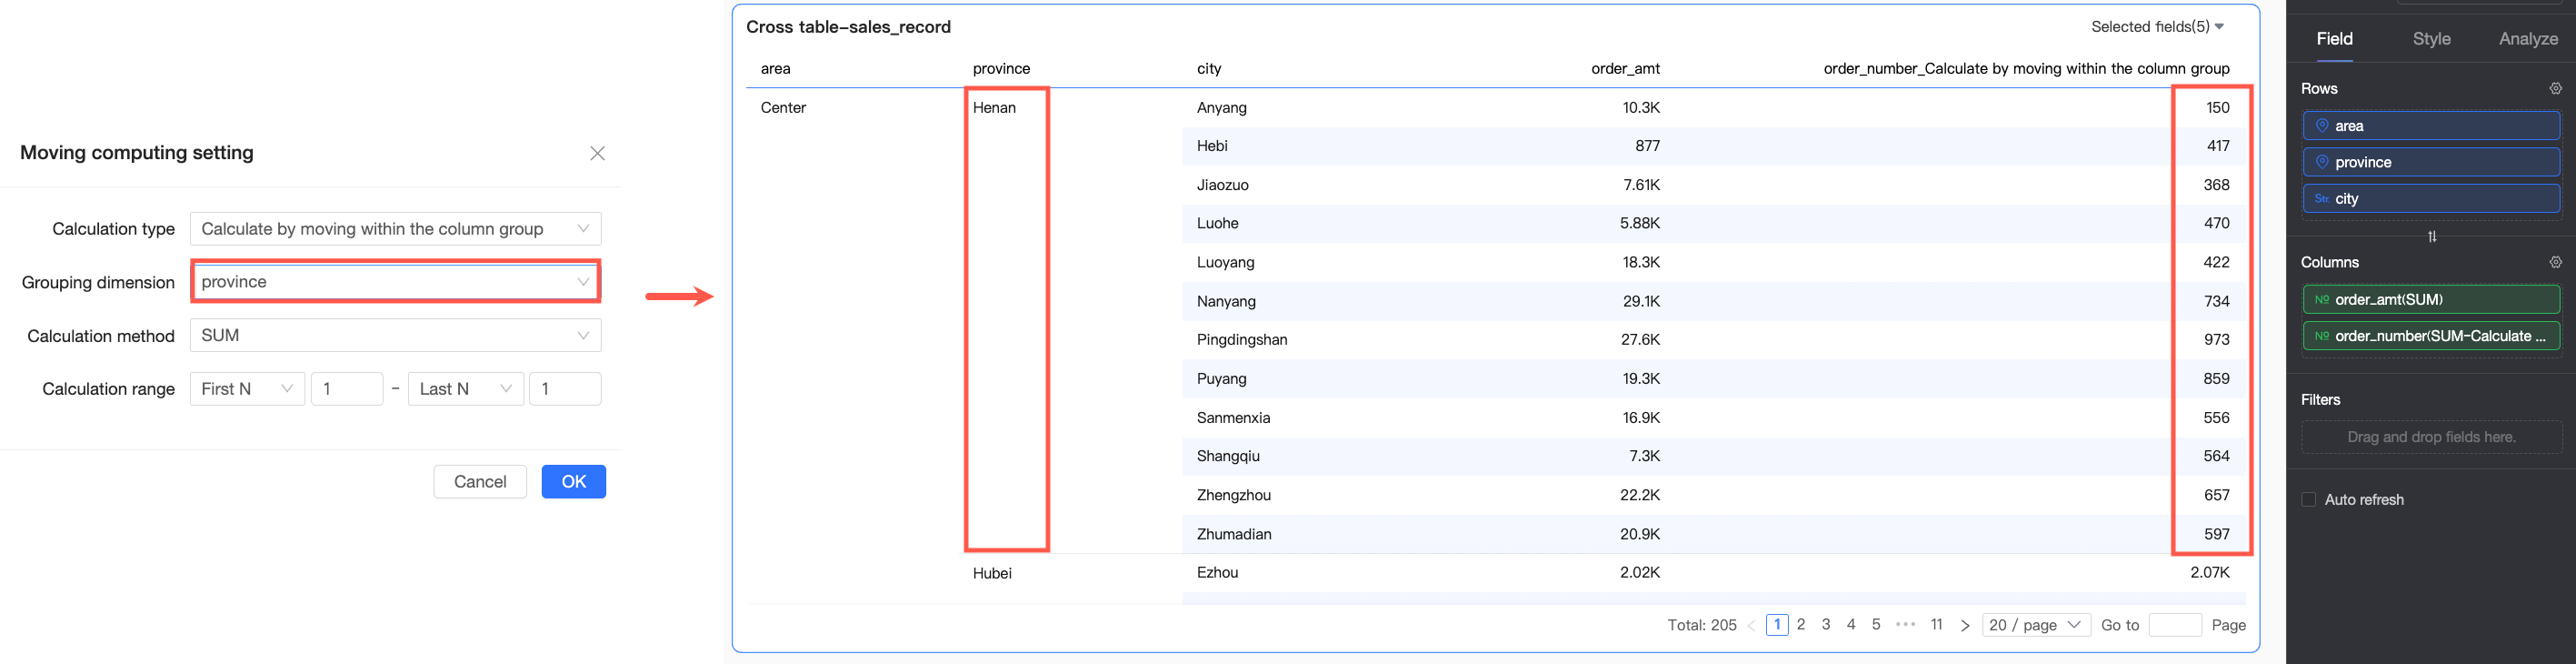
Mobile computing by column group | The Row area has two or more dimension fields | Groups single column data according to the selected dimension and performs mobile computing within the group. The grouping logic is: starting from the first dimension in the Row area, all dimensions up to the selected grouping dimension are treated as a whole for grouping operations. For example, in the figure below, the Region and Province fields will be used for grouping operations. | |
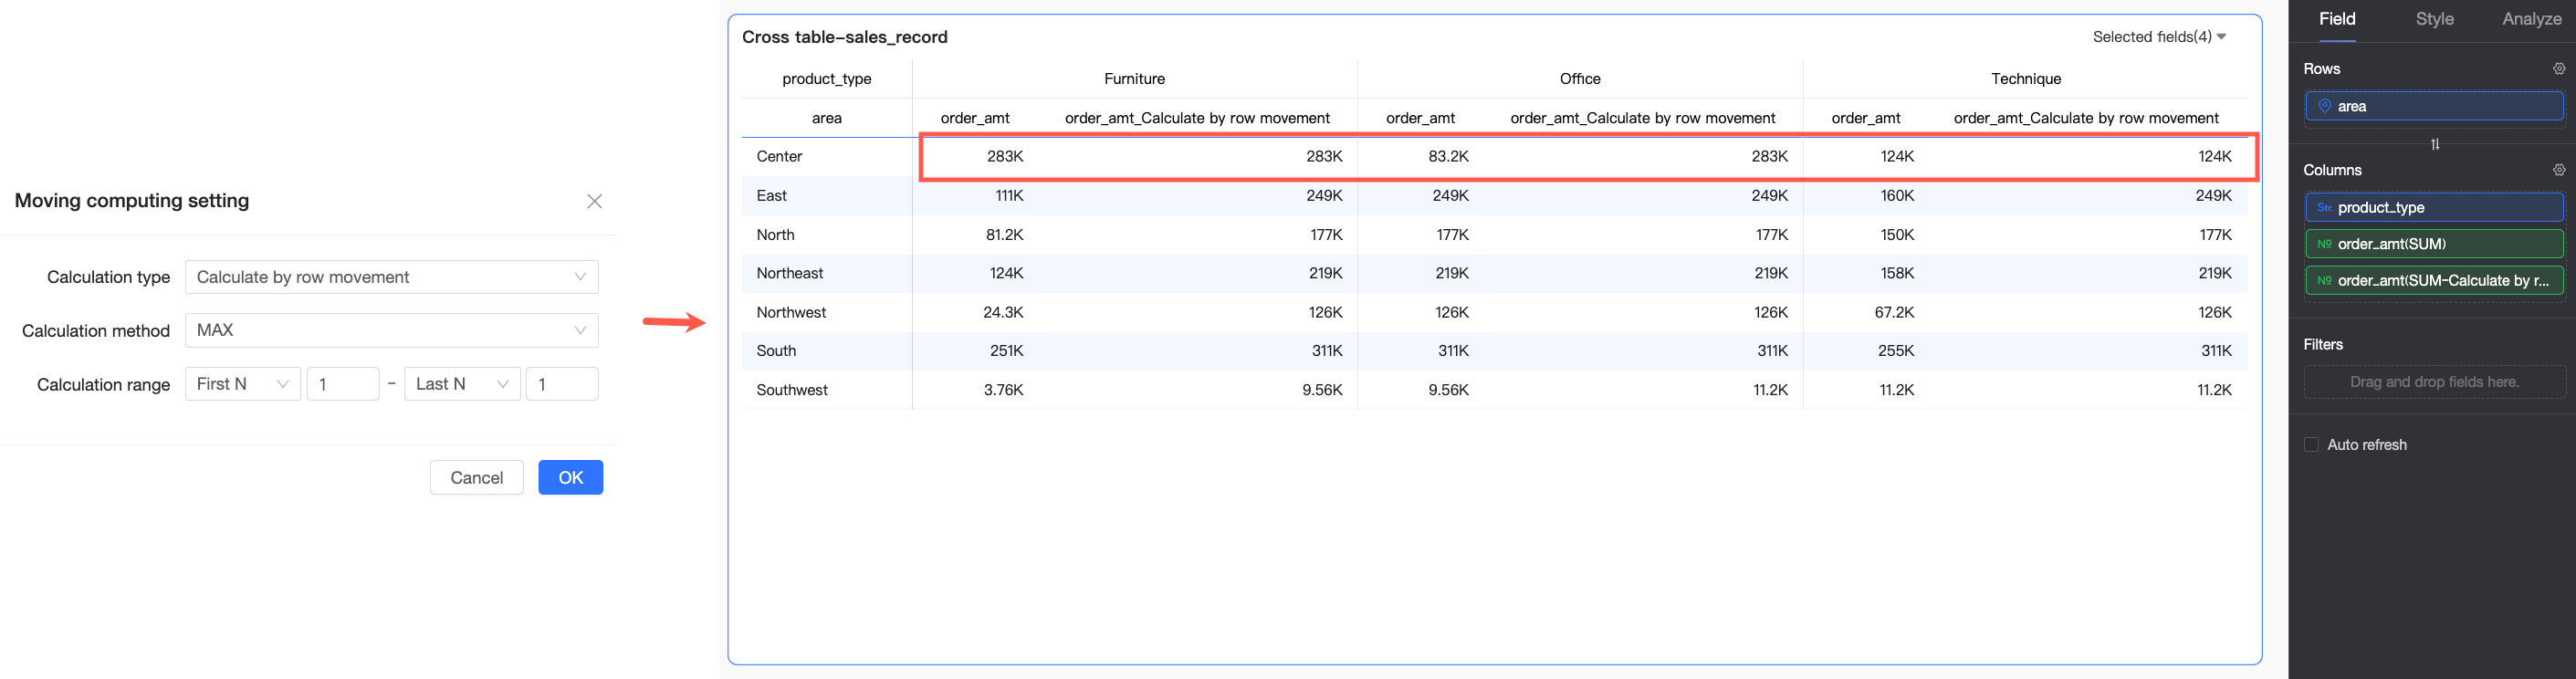
Mobile computing by row | The Column area has dimension fields | Performs mobile computing with each row as an independent analysis unit. | |
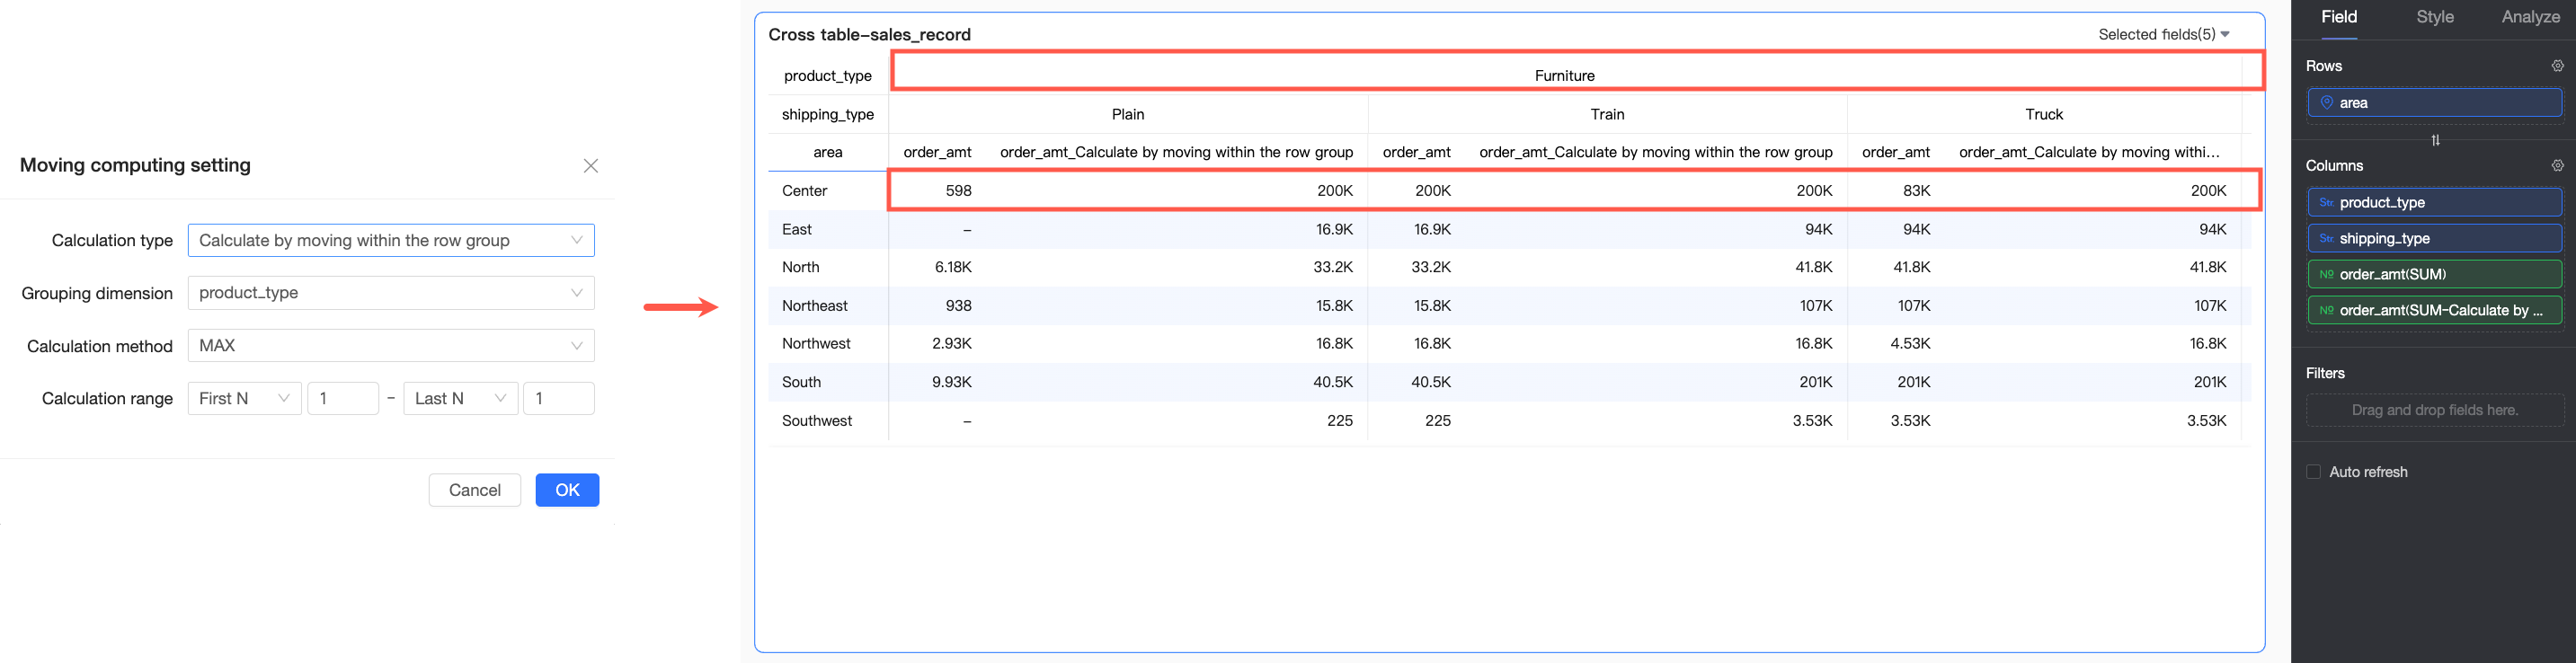
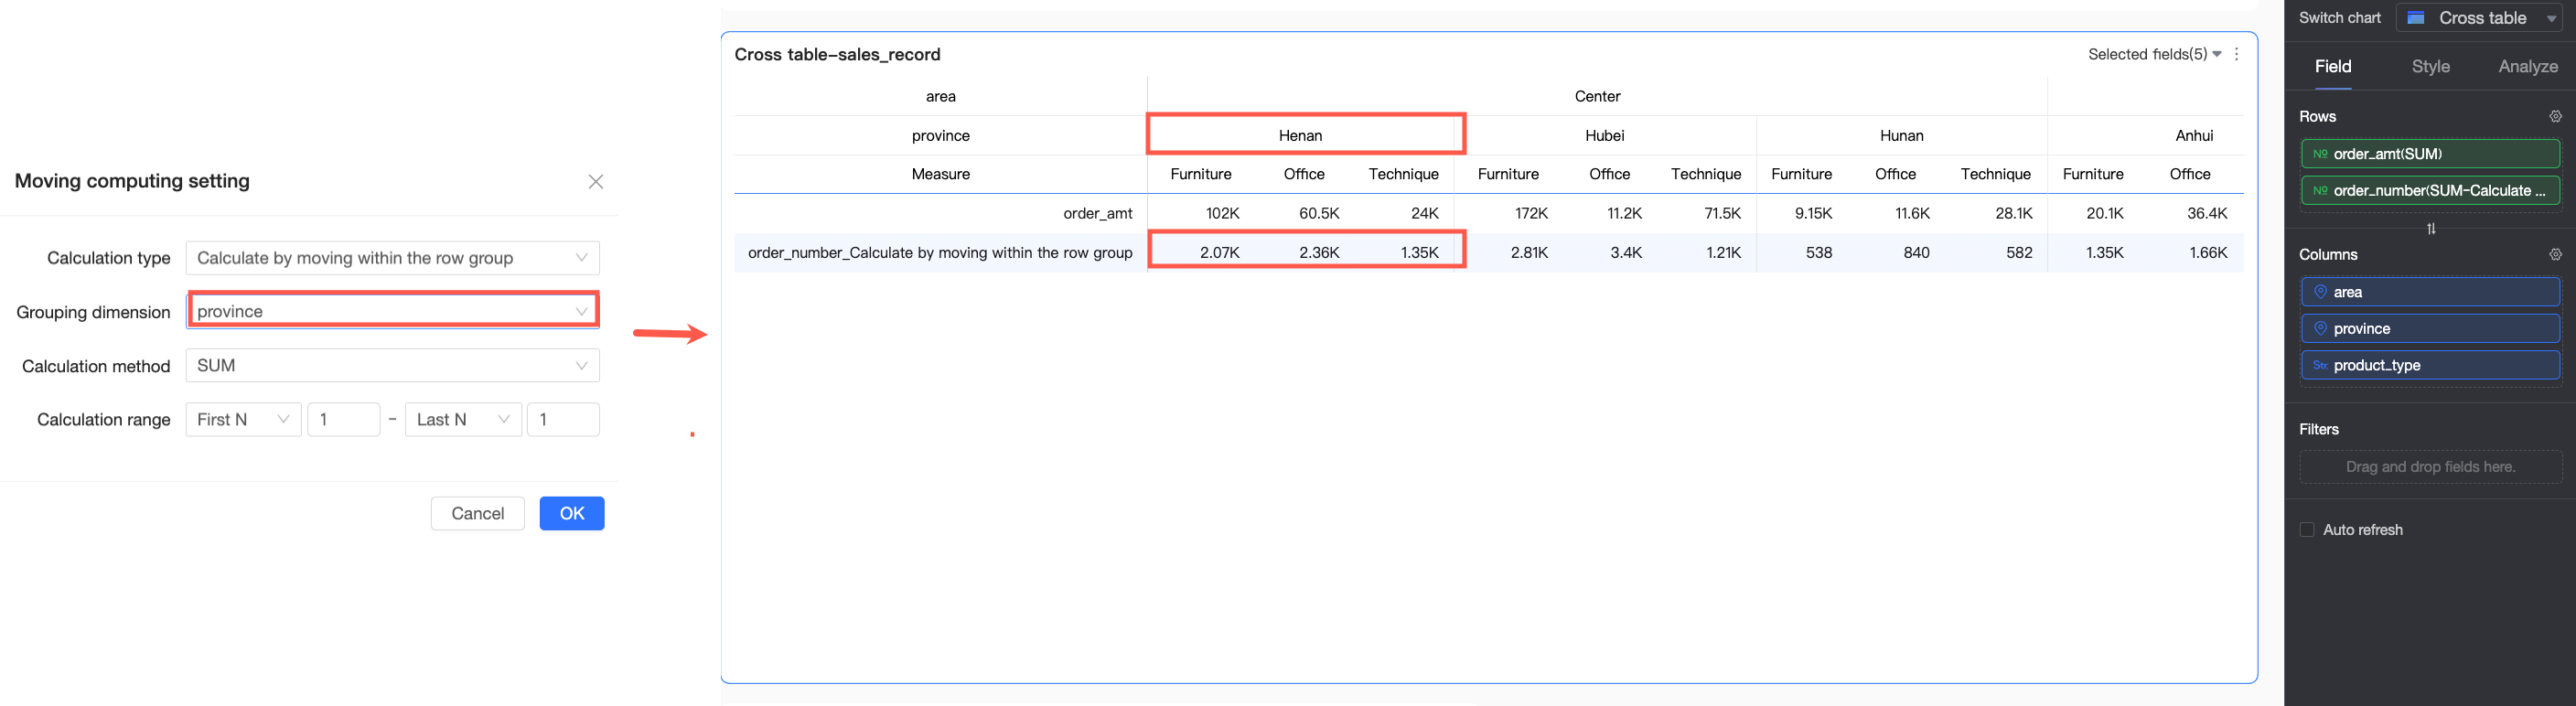
Mobile computing by row | The Column area has two or more dimension fields | Groups single row data according to the selected dimension and performs mobile computing within the group. The grouping logic is: starting from the first dimension in the column area, all dimensions up to the selected grouping dimension are treated as a whole for grouping operations. For example, in the figure below, the Region and Province fields will be used for grouping operations. | |
Other charts | Overall mobile computing | / | Performs mobile computing on the overall data. |
Application Examples
The following examples help you further understand mobile computing.
Application example 1: Metric card
Take the detail table's metric card as an example.
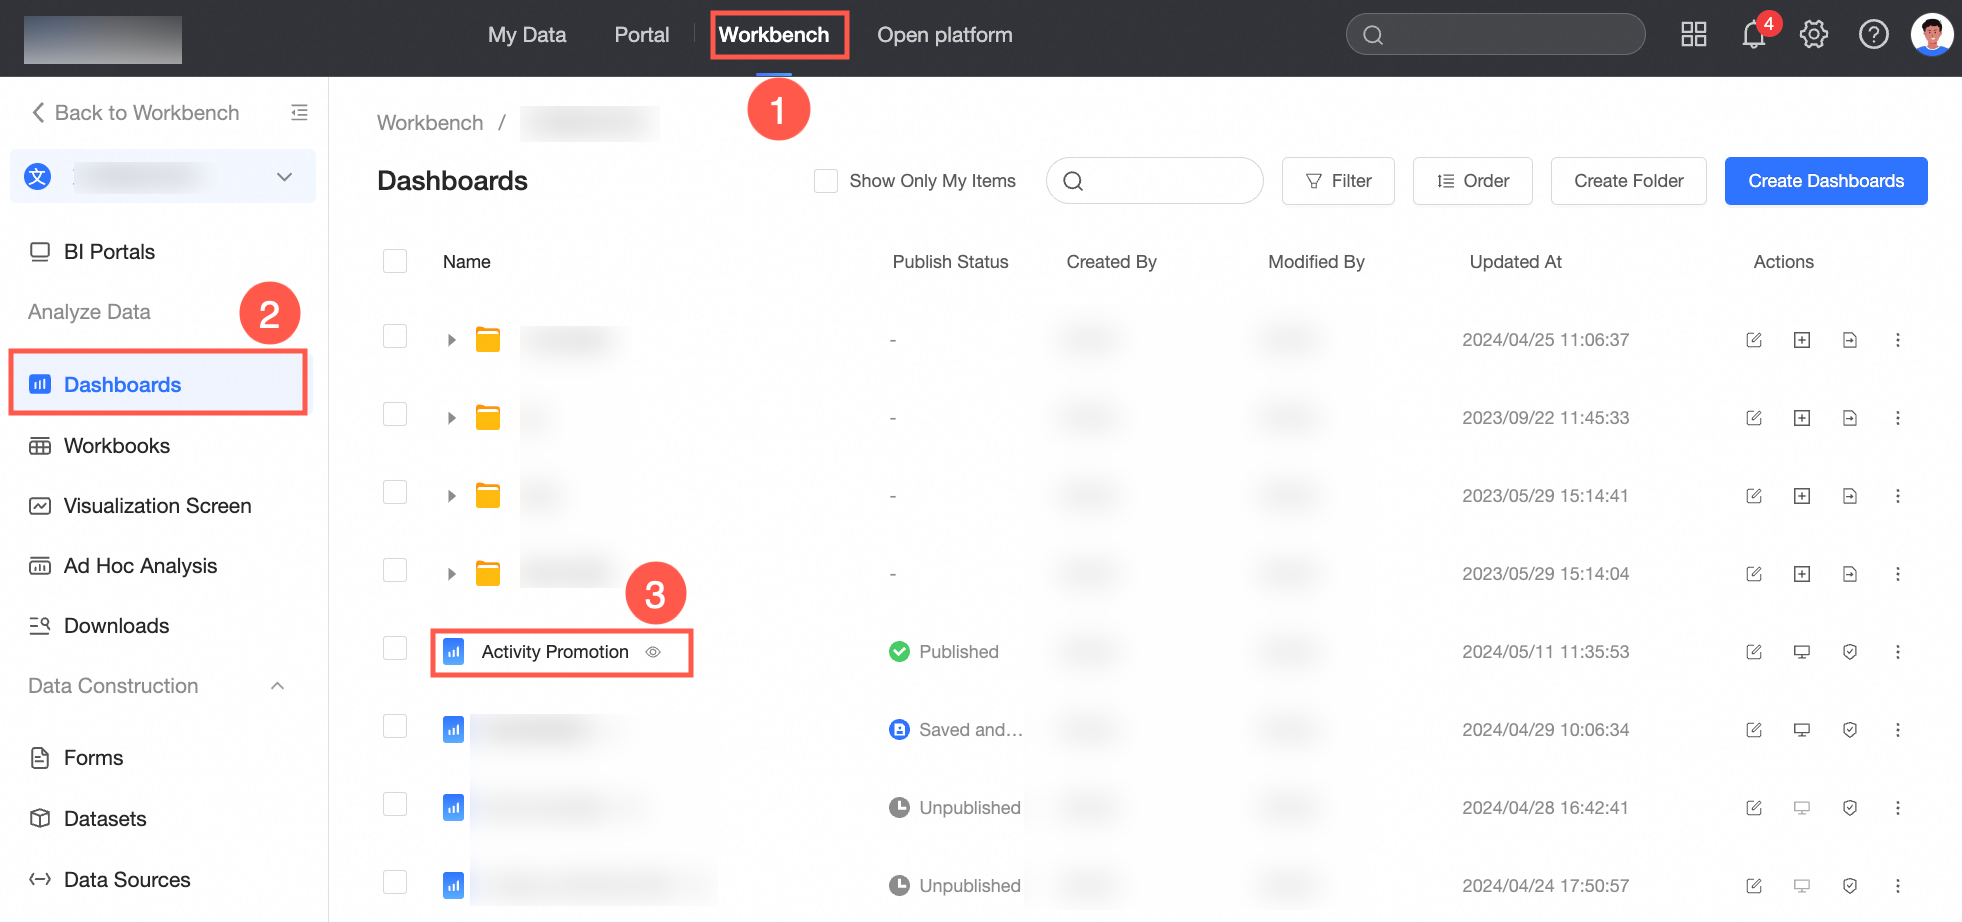
Log on to the Quick BI console.
Follow the steps in the figure below to enter the dashboard editing page.
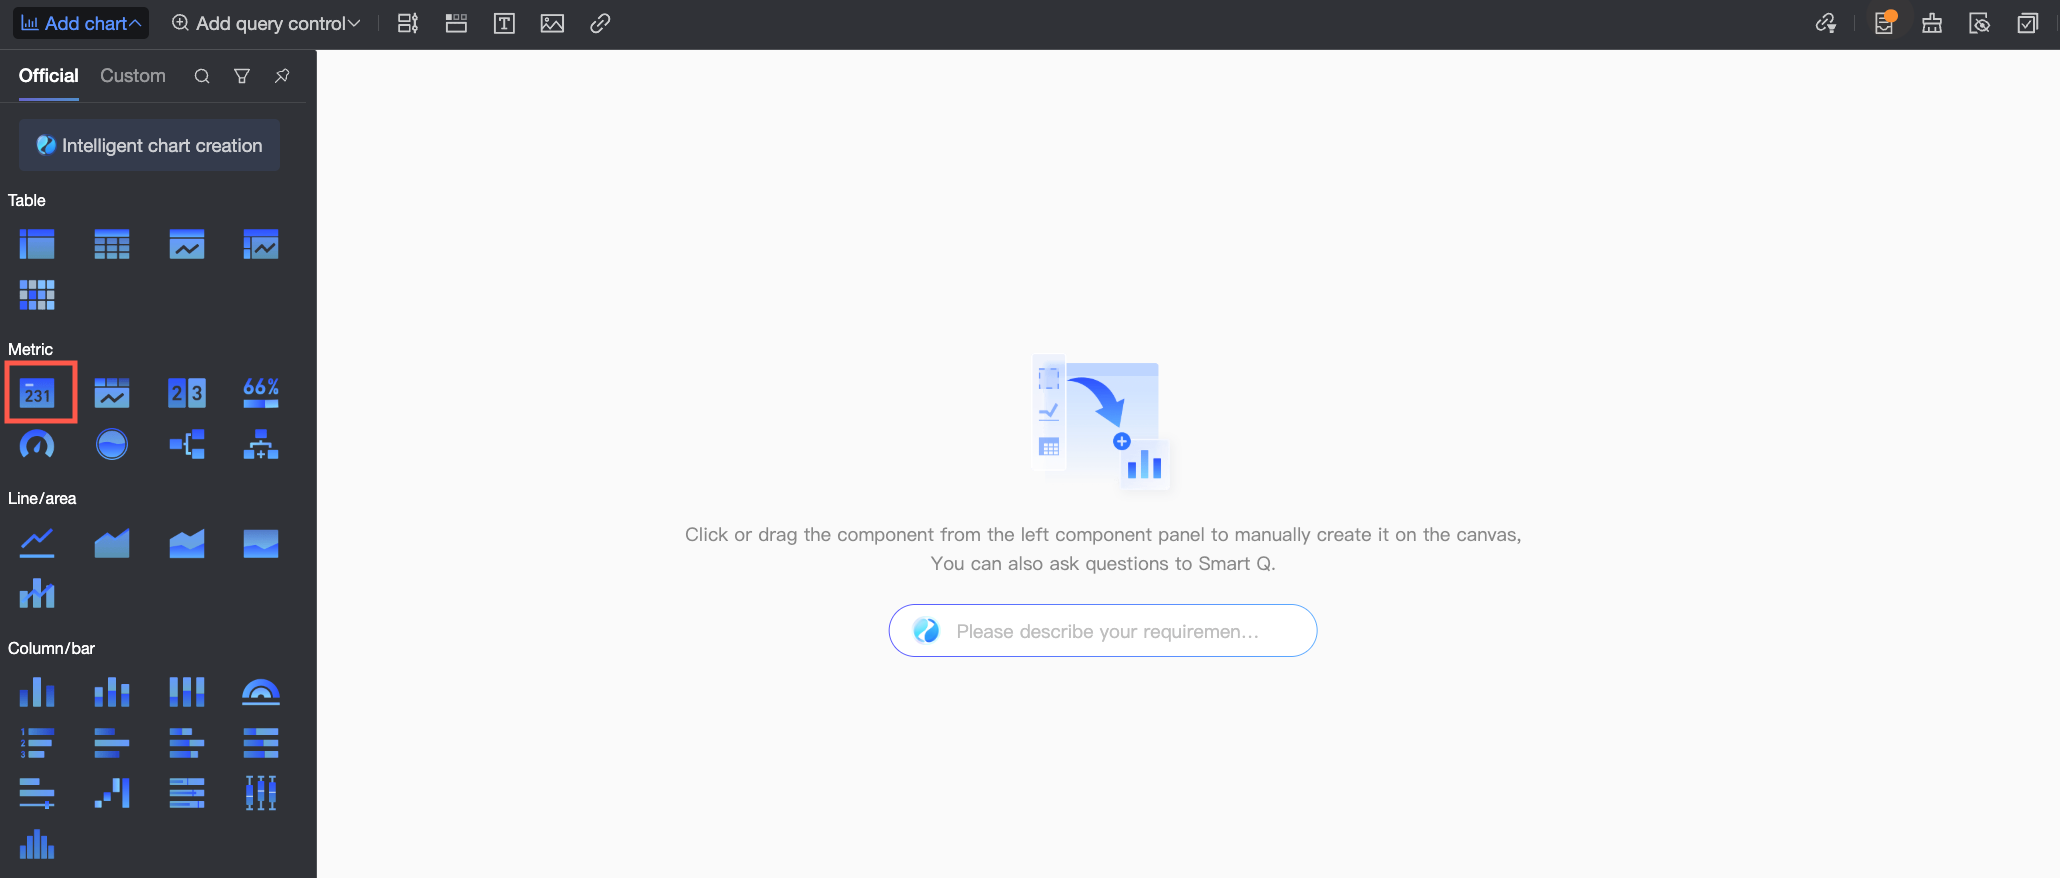
In the top menu bar, click Add Chart, find Metric Card, and click or drag the detail table to the dashboard area.
In the Data Panel's Fields tab, configure the metric card data.
Select the required dimension fields and measure fields, double-click or drag them to the target area.
In the Dimensions list, find Order Date (month), double-click or drag it to the Row area.
In the Measures list, find Order amount, double-click or drag it twice to the Column area.
NoteThe two Order amount fields in the Column area, one displays the raw data, and the other is set for mobile computing values.
When there are two duplicate fields placed on measures, a prompt "Duplicate items exist in measures" will appear. You don't need to update the data now. You can update after the configuration is complete.
Click the
 icon on the right side of the second Order amount field, select Advanced Calculation > Mobile Computing. In the Mobile Computing Settings dialog box, set the specific mobile computing method for the current chart as needed.
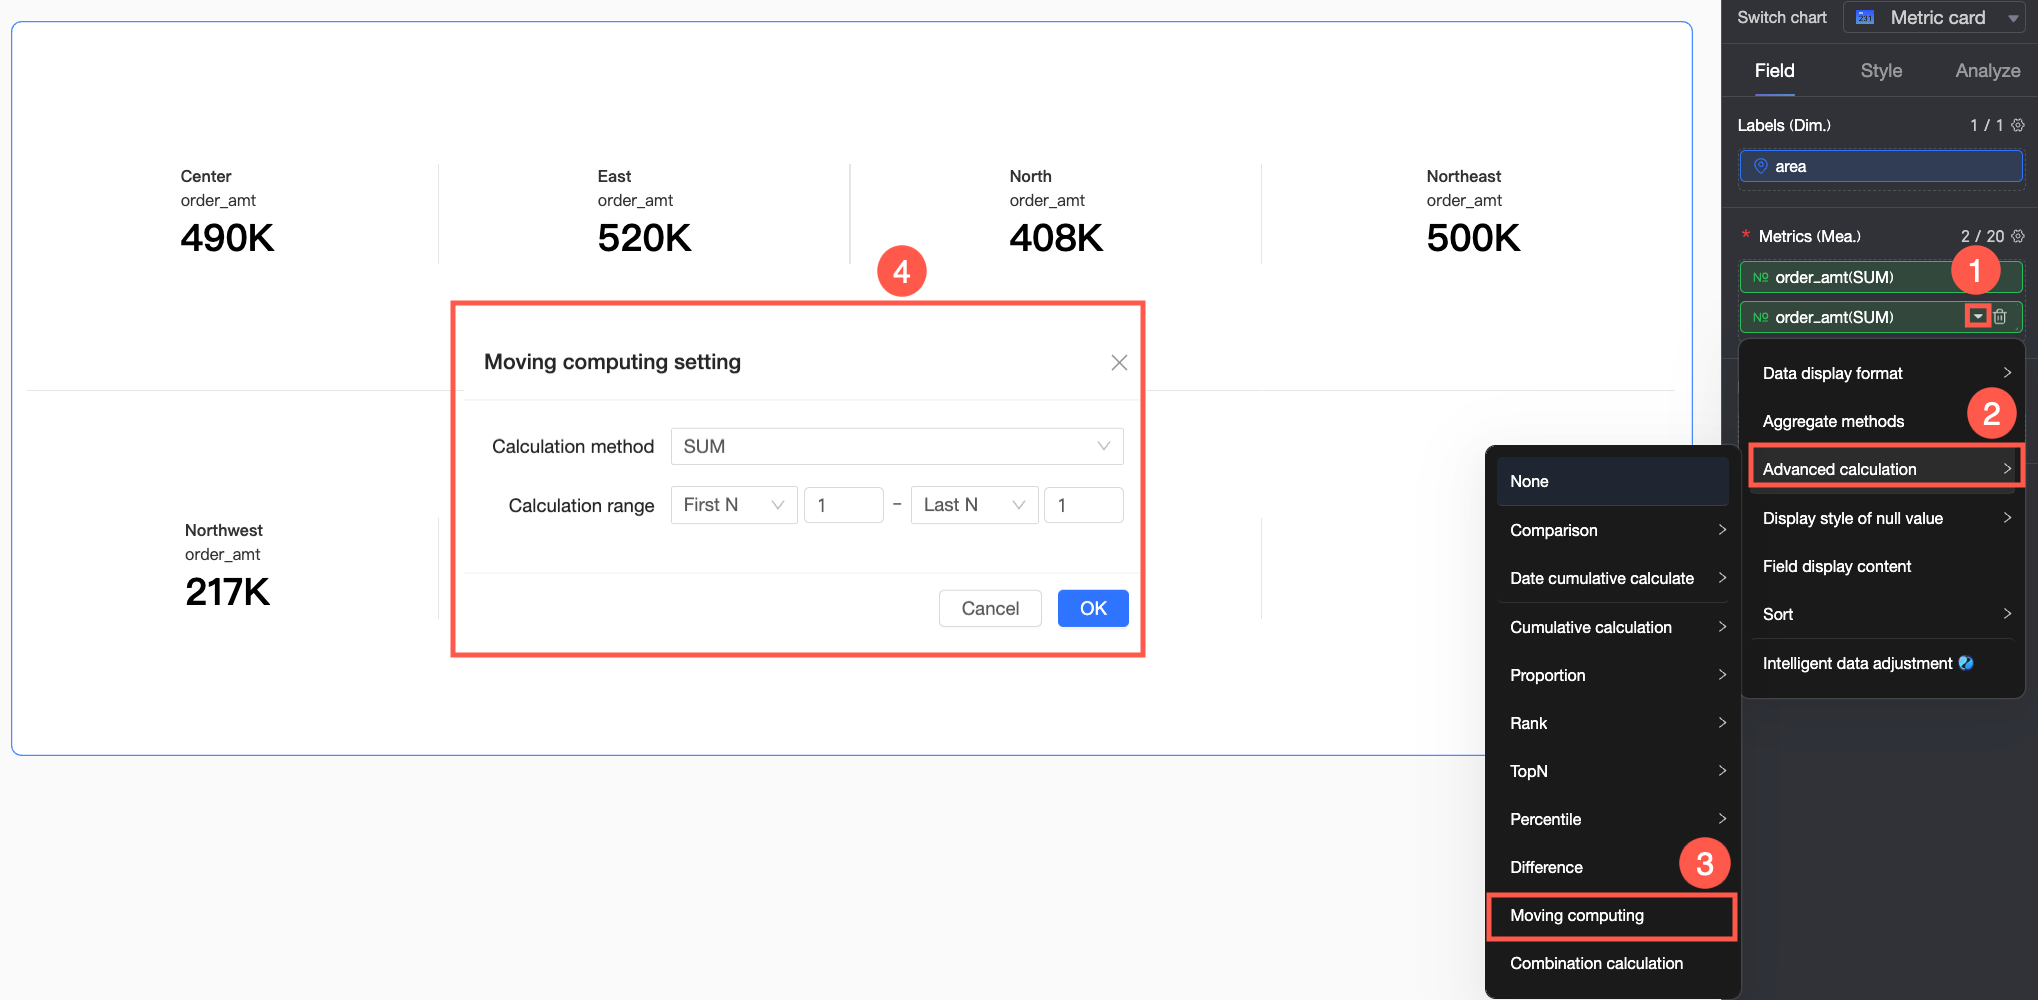
Calculation method: Set the calculation to be performed on the data points within the window range.
Calculation method
Description
Sum
Calculates the sum of all data points within the window.
Average
Calculates the average of all data points within the window.
Maximum
Calculates the maximum value among all data points within the window.
Minimum
Calculates the minimum value among all data points within the window.
Count
Calculates the number of data points covered within the window.
Calculation range: Set the window range size.
Calculation range
Description
Starting point
Previous N
Starts from the Nth data point before the current data point.
Nth
Starts from the Nth data point of the overall data.
Current row
Starts from the row where the current data point is located.
Next N
Starts from the Nth data point after the current data point.
Ending point
Next N
Ends at the Nth data point after the current data point.
Last Nth
Ends at the Nth data point from the end of the overall data.
Current row
Ends at the row where the current data point is located.
Previous N
Ends at the Nth data point before the current data point.
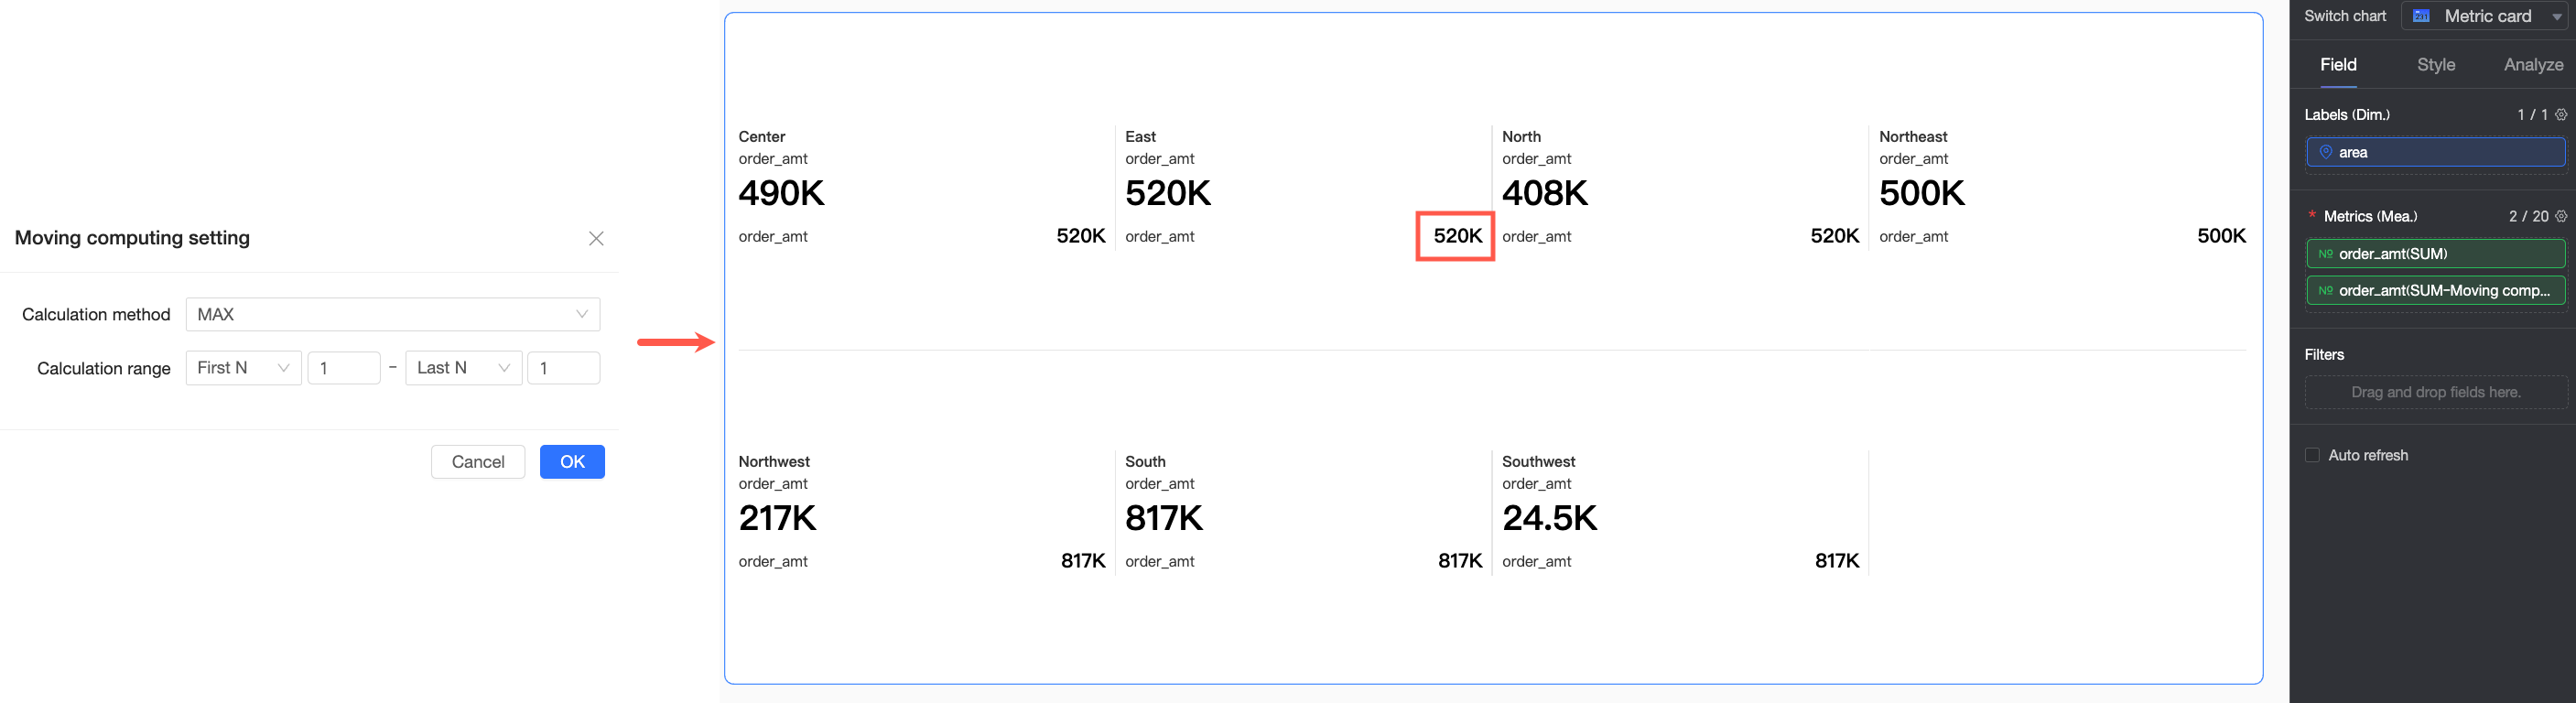
In this example, you need to calculate the maximum sales amount in every 3 months. Therefore, set the calculation method to Maximum, and the calculation range from Previous 1 data point to Next 1 data point of the current data point. The specific effect is shown in the following figure.
Application example 2: Cross table
Cross tables have different mobile computing types available compared to other charts. The following examples use the calculation method Maximum and the calculation range from Previous 1 data point to Next 1 data point of the current data point for explanation.
Mobile computing type | Configuration description | Effect example |
Mobile computing by column | This example performs mobile computing on the overall data by single column. |
|
Mobile computing within column group | In this example, the first dimension field in the row area is Region, and the grouping dimension is Province. Therefore, matching groups are formed according to the Region and Province fields, and in-group mobile computing is performed by the Province dimension. |
|
Mobile computing by row | This example performs mobile computing on the overall data by single column. |
|
Mobile computing within row group | In this example, both the first dimension field in the row area and the grouping dimension are Product Type. Therefore, matching groups are formed according to the Product Type field, and mobile computing is performed within the group. |
|