The offline node monitoring feature allows you to monitor the running status of offline nodes by configuring monitoring rules. When an offline node triggers the configured monitoring rule, the system sends alerts to the configured recipients to help you ensure the normal operation of nodes and data generation.
Function introduction
Offline node monitoring supports monitoring of recurring nodes, one-time nodes, logical table nodes (modeling nodes), and logical table fields in Basic projects or in the Prod environment of Dev/Prod projects. The monitoring scope is divided into field level, node level, and project level.
Field-level monitoring: Refers to adding monitoring for logical table fields. At the field level, you can configure the same monitoring alert rule for multiple logical table fields, or configure multiple different monitoring alert rules for a single logical table field. To configure field-level monitoring, see Configure node monitoring alert rules.
Node-level monitoring: At the node level, you can configure the same monitoring alert rule for multiple nodes, or configure multiple different monitoring alert rules for a single node. To configure node-level monitoring, see Configure node monitoring alert rules.
Project-level monitoring: At the project level, you can configure alert rules for all nodes in the current project or batch configure alert rules by node type (node type + schedule type). To configure project-level monitoring, see Configure project monitoring alert rules.
Background information
Dataphin supports batch configuration of monitoring alert rules, including batch selection of nodes or fields to configure the same monitoring alert rule, and batch configuration of multiple monitoring alert rules for a single node or field, which improves the efficiency of configuring monitoring alert rules.
Dataphin also supports configuring different recipients for a single monitoring alert rule and specifying different receiving methods for different recipients to ensure that all relevant personnel receive alert information. For example:
Configure phone alerts for on-duty personnel so they can receive alert information promptly and handle it immediately, minimizing the impact on downstream nodes.
Configure text message or email alerts for responsible persons so they can understand the overall operation of the nodes they are responsible for without needing to handle them immediately.
Configure DingTalk group robot alerts for project administrators so they can understand the overall operation of all nodes in the project through group messages, which is convenient for subsequent statistical analysis.
Monitoring alert rule priority description
Rule conflicts may occur when configuring monitoring alert rules. The rule priority and conflict scenarios are described as follows:
Field-level monitoring alert rules have higher priority than node-level ones, and node-level monitoring alert rules have higher priority than project-level ones. Field level > Node level > Project level.
If the current monitored object does not have node-level alert configuration, and two or more project-level monitoring alert rules have exactly the same (monitored object + alert reason + recipient + receiving method) but different alert frequency/sending times, a conflict occurs. When multiple project-level monitoring alert rules conflict, the rule priority is determined by the order in the project-level monitoring alert rule list from top to bottom, with the first hit rule's alert configuration taking effect.
ImportantNewly created project monitoring rules are placed at the top of the list by default (default priority takes effect), and monitoring is enabled by default.
Offline node monitoring entry
In the top menu bar of the Dataphin homepage, select Development > O&M Center.
In the left-side navigation pane, select Monitoring Management > Offline Node Monitoring.
Offline node monitoring page introduction
On the offline monitoring configuration page, you can click the Node Monitoring or Field Monitoring, Project Monitoring tabs to view the generated monitoring alert rules.
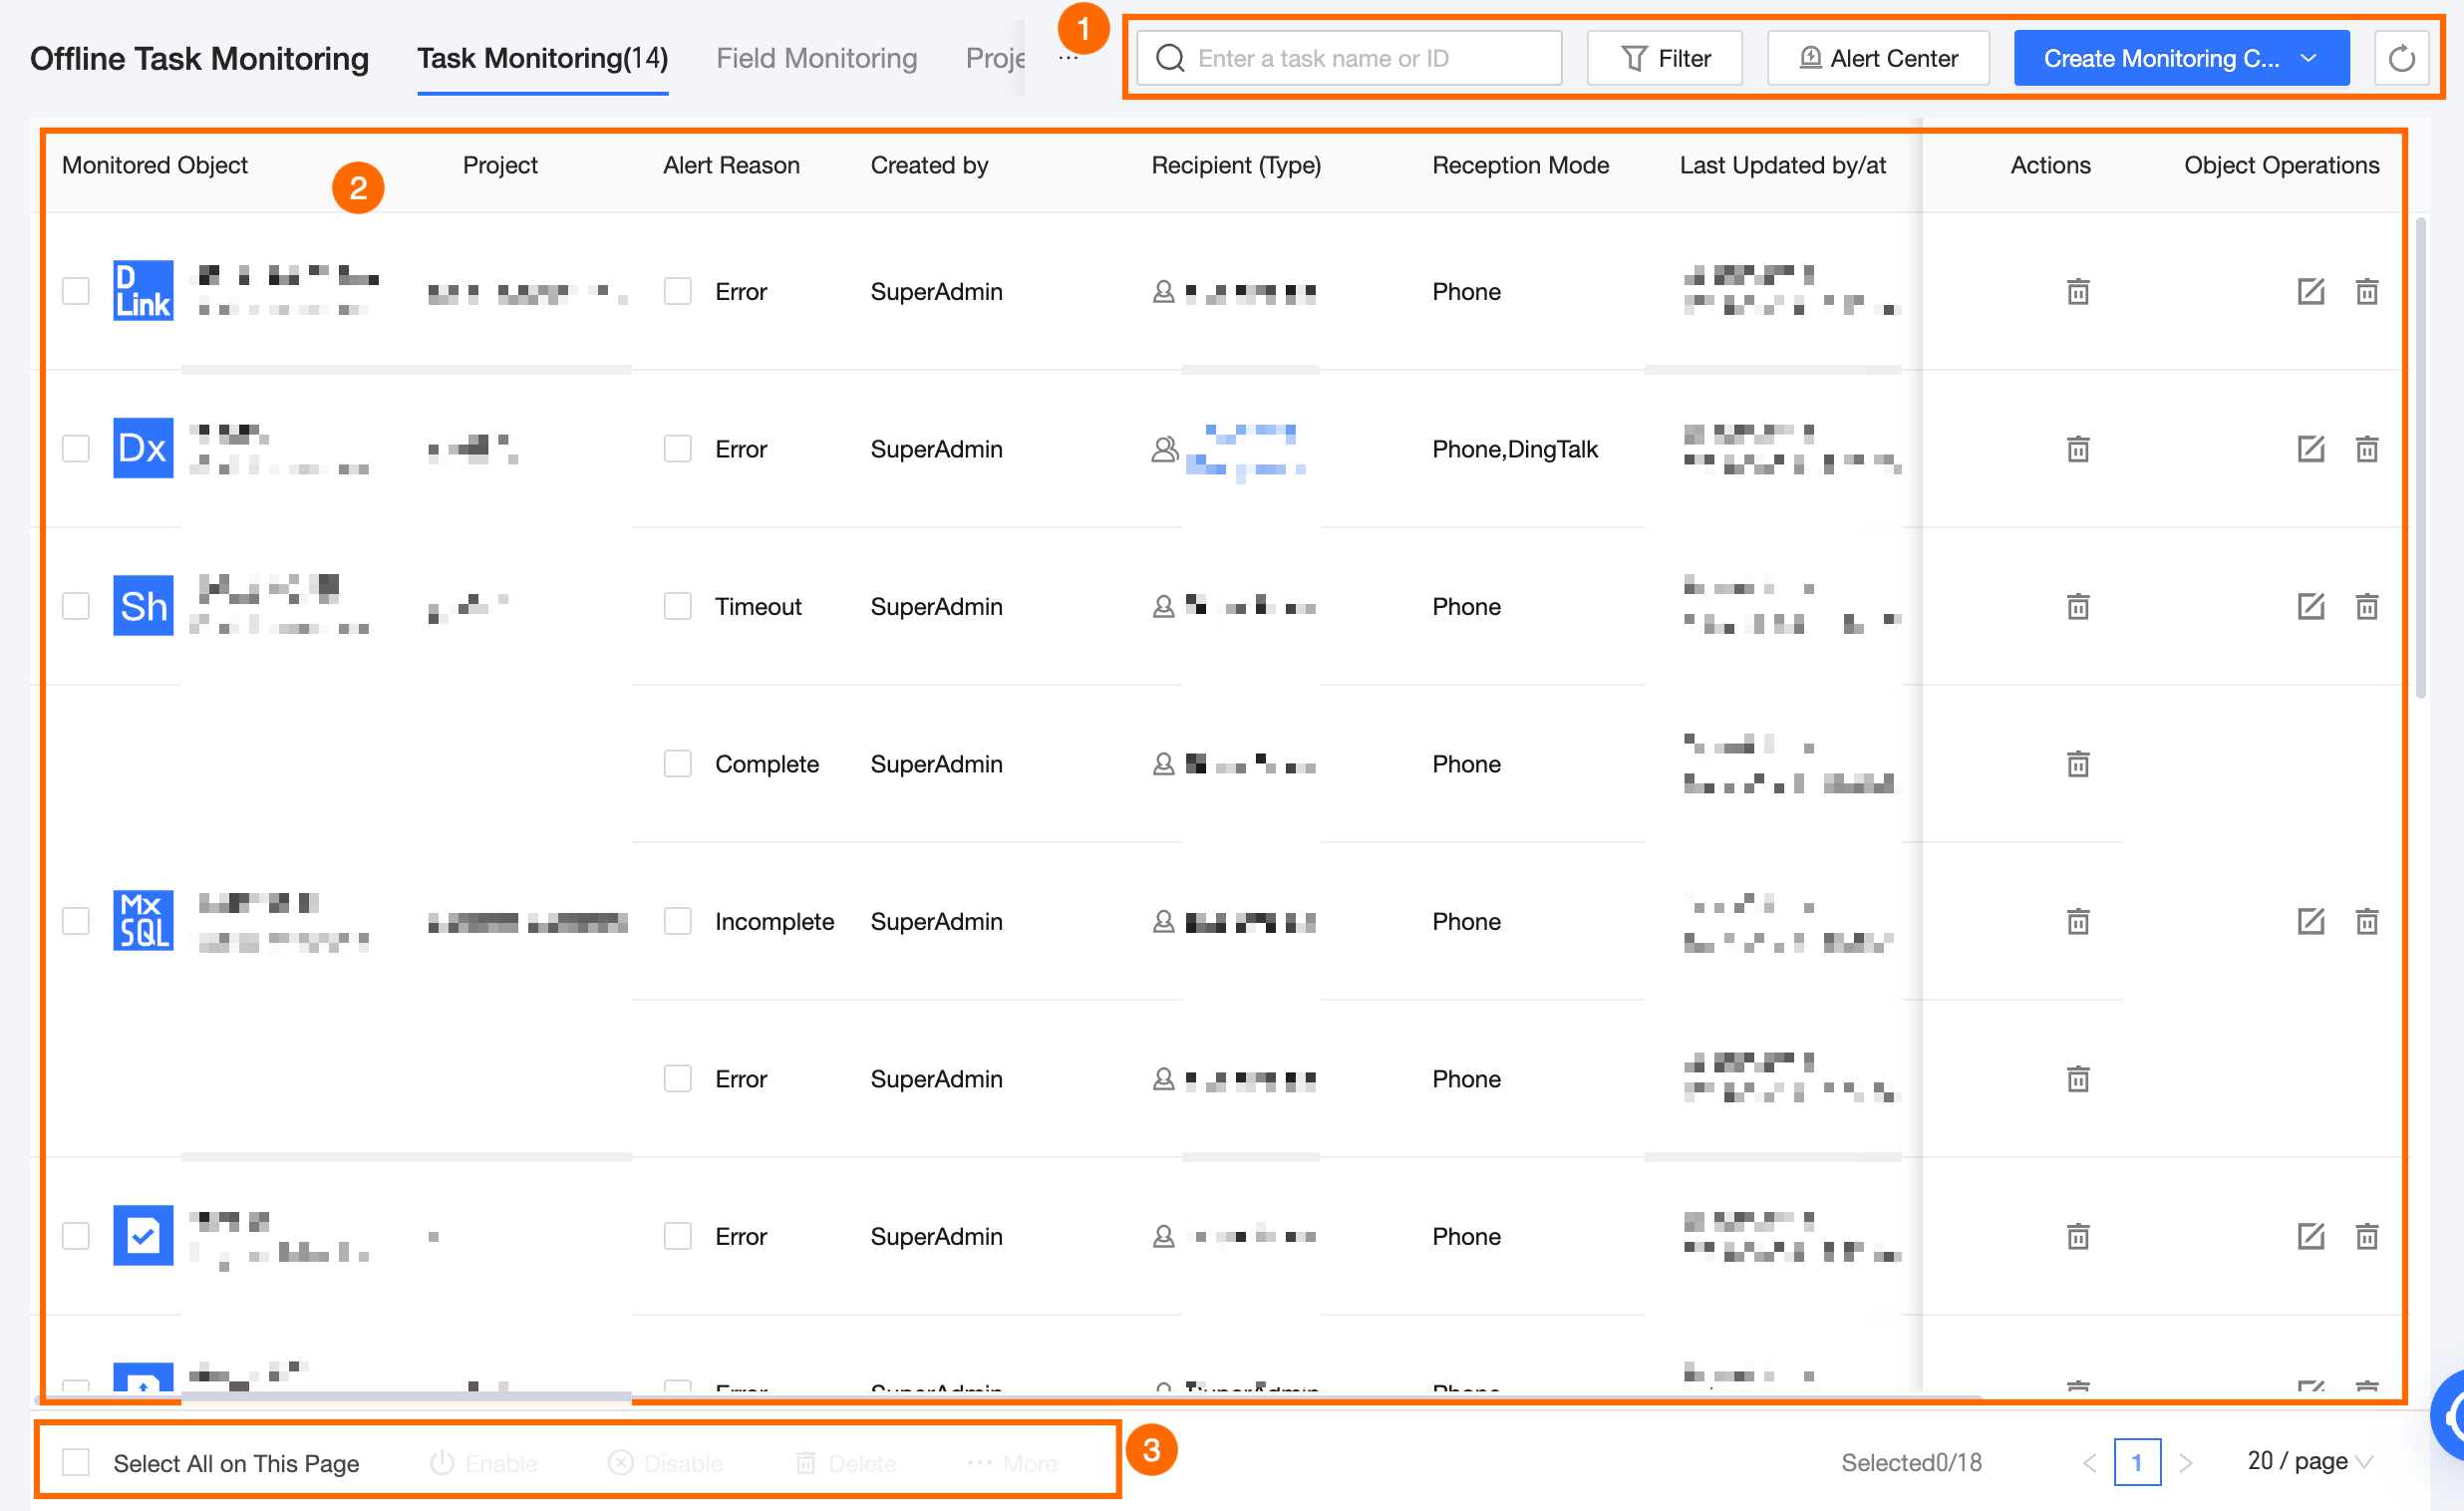
Node monitoring page
The node monitoring page displays the status information and supported operations of configured node monitoring, including monitored object, project, alert reason, creator, recipient (type), receiving method, last updater/time, monitoring interval, and monitoring switch status.
Block
Description
① Search and filter area
In the search and filter area, you can quickly and efficiently locate targets and view monitoring configuration details by Entering Node Name/node ID or using Alert Reason, Receiving Method, Created By, or Recipient as filter conditions.
Filter options include the following:
Alert Reason: Includes error, timeout, and incomplete.
Receiving Method: Includes phone, text message, DingTalk, and email.
Created By: The user who created the monitoring rule.
Recipient: The alert recipient configured in each monitoring rule.
Project: Filter by the project where the node is located. You can select multiple projects for which the current logged-in user has O&M - access folder permission.
If you need to filter again, click Reset to quickly clear all filter conditions and restore the system defaults.
② Node monitoring list
In the monitoring rule list area, you can edit, delete monitoring rules, and enable or disable the monitoring switch.
③ Batch operations area
Supports batch deletion of monitoring alert rules and enabling or disabling the monitoring switch. You can also click More to batch add, delete, and replace custom recipients and modify receiving configurations.
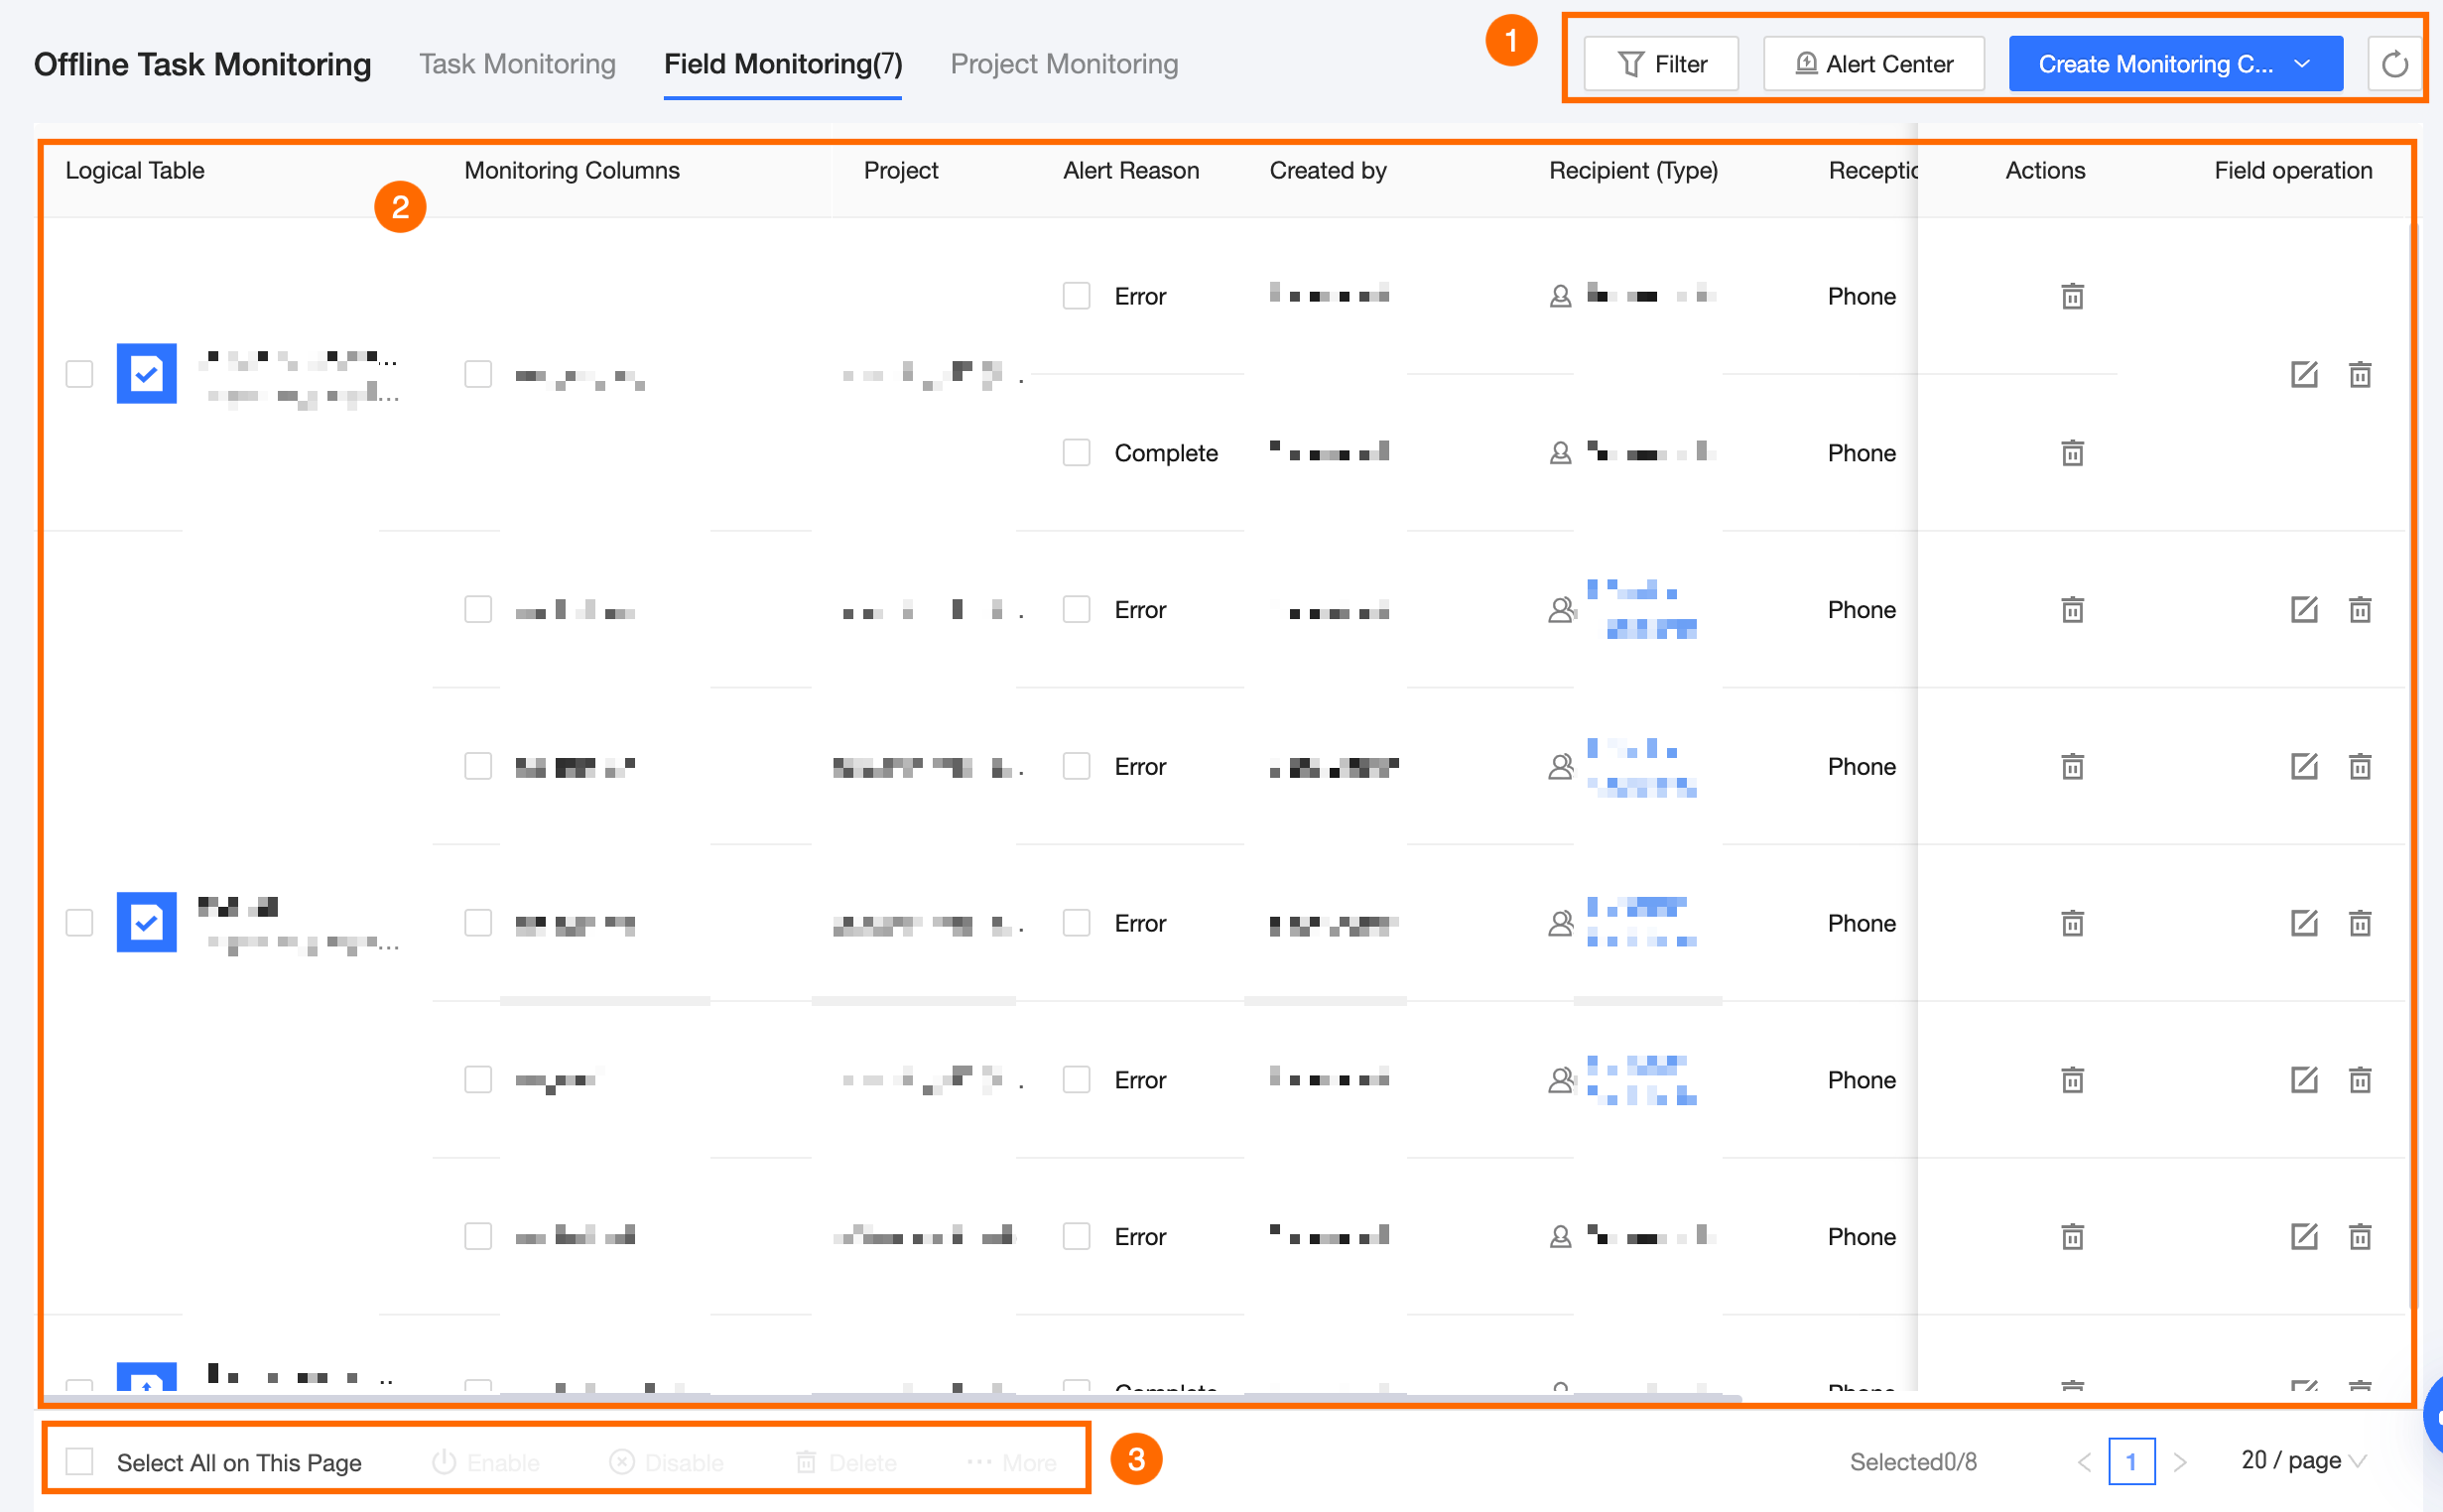
Field monitoring page
The field monitoring page displays the status information and supported operations of configured field monitoring, including logical table, monitored field, project, alert reason, creator, recipient (type), receiving method, last updater/time, monitoring interval, and monitoring switch status.
Block
Description
① Search and filter area
In the search and filter area, you can quickly and efficiently locate targets and view monitoring configuration details by Entering Node Name/node ID or using Alert Reason, Receiving Method, Created By, or Recipient as filter conditions.
Filter options include the following:
Logical Table: Filter by logical table name. You can enter logical table name keywords for searching.
Monitored Field: After selecting a logical table, you can select multiple fields of the selected logical table for filtering.
Receiving Method: Includes phone, text message, DingTalk, and email.
Created By: The user who created the monitoring rule.
Recipient: The alert recipient configured in each monitoring rule.
Project: Filter by the project where the node is located. You can select multiple projects for which the current logged-in user has O&M - access folder permission.
If you need to filter again, click Reset to quickly clear all filter conditions and restore the system defaults.
② Node monitoring list
In the monitoring rule list area, you can edit, delete monitoring rules, and enable or disable the monitoring switch.
③ Batch operations area
Supports batch deletion of monitoring alert rules and enabling or disabling the monitoring switch. You can also click More to batch add, delete, and replace custom recipients and modify receiving configurations.
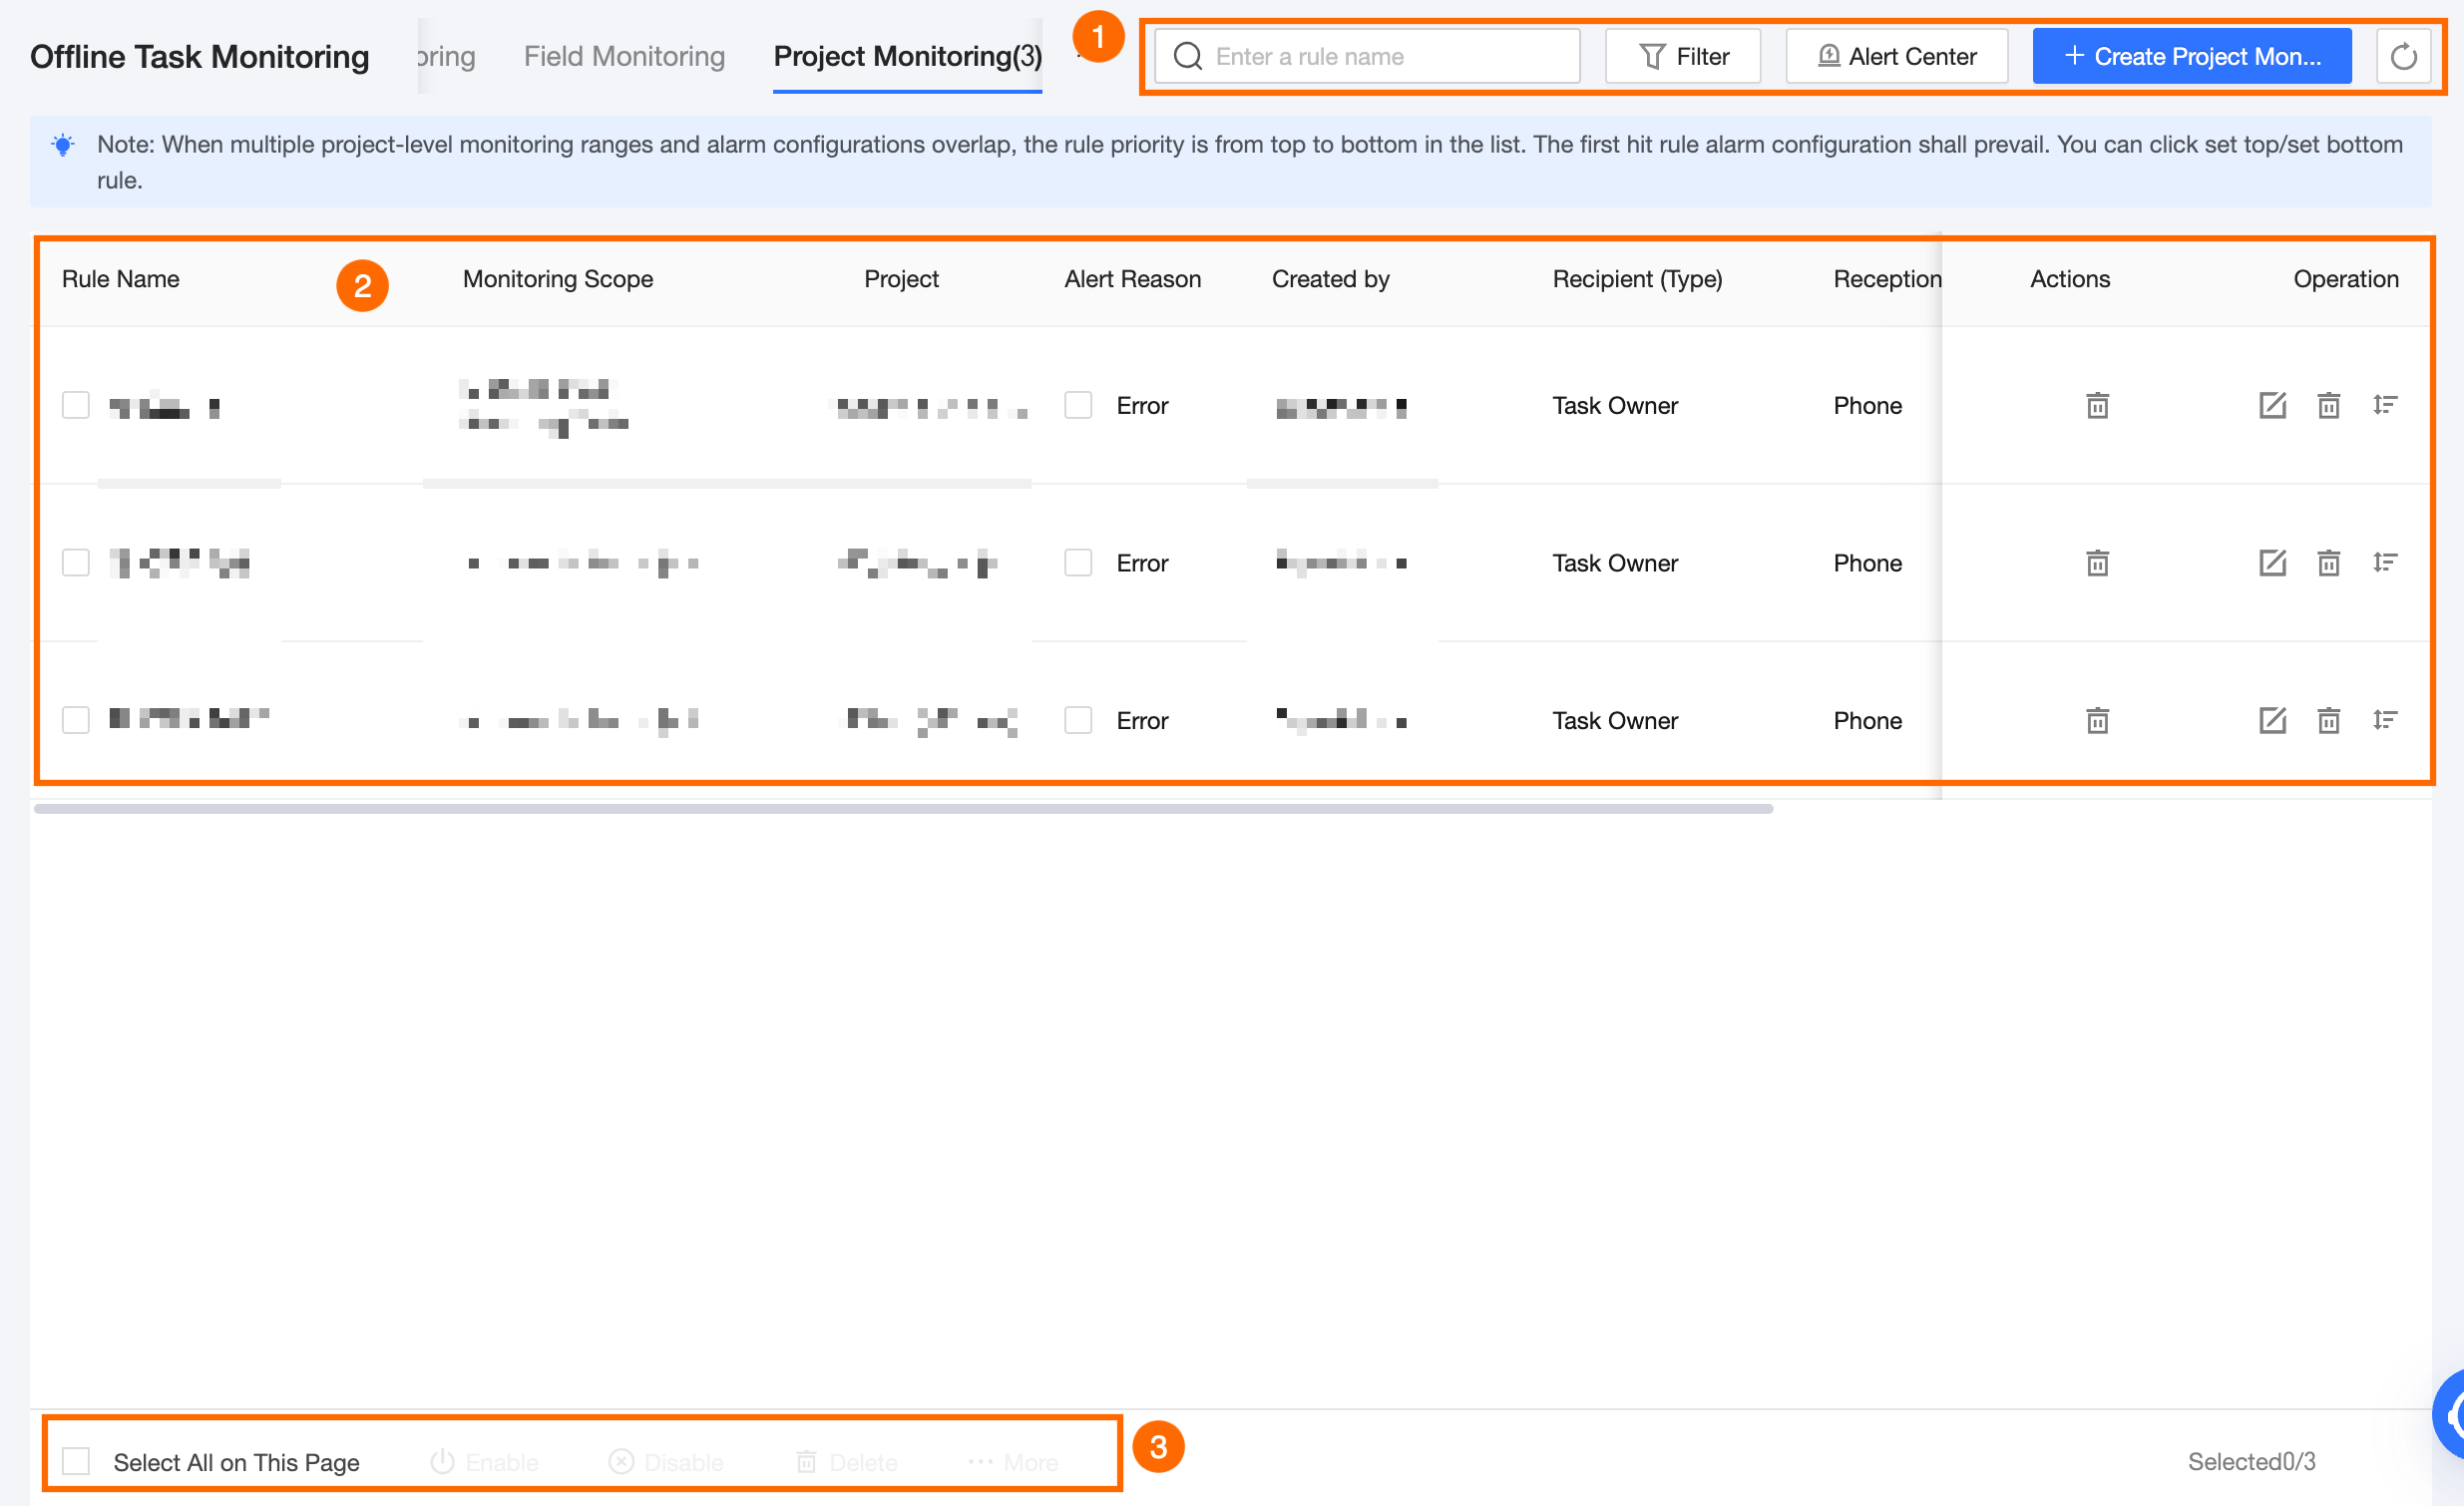
Project monitoring page
The project monitoring alert page displays the status information and supported operations of configured project monitoring alerts, including rule name, monitoring scope, project, alert reason, creator, recipient (type), receiving method, last updater/time, and monitoring switch status.
Block
Description
① Search and filter area
In the search and filter area, you can quickly and efficiently locate targets and view monitoring configuration details by Entering Node Name/node ID or using Alert Reason, Receiving Method, Created By, or Recipient as filter conditions.
Filter options include the following:
Alert Reason: Includes error, timeout, and incomplete.
Receiving Method: Includes phone, text message, DingTalk, and email.
Created By: The user who created the monitoring rule.
Recipient: The alert recipient configured in each monitoring rule.
Project: Filter by the project where the node is located. You can select multiple projects for which the current logged-in user has O&M - access folder permission.
If you need to filter again, click Reset to quickly clear all filter conditions and restore the system defaults.
② Monitoring rule list
In the monitoring rule list area, you can edit, delete, adjust the order (priority) of monitoring rules, and enable or disable the monitoring switch.
③ Batch operations area
Supports batch deletion of monitoring alert rules and enabling or disabling the monitoring switch.
NoteEnabling or disabling the monitoring switch will take effect immediately.
You can also click More to batch add, delete, and replace custom recipients and modify receiving configurations.