This document is an introduction to Quick Tracking and technical integration and is not used as a sales basis. For specific products and technical services purchased by an enterprise, the commercial purchase contract shall prevail.
Overview
A funnel is a series of behavioral transformations that users complete during product use. For example, the process of purchasing goods may include the following steps: "Browse goods"-"Add to shopping cart"-"Submit order"-"Complete purchase". The above steps can be regarded as a funnel. Funnel analysis can help enterprises understand the conversion or churn of users in behavioral steps, and then improve the conversion rate by optimizing products or carrying out operational activities to achieve business goals. After you query data by using funnel analysis, you can save it as a report and add it to a self-made dashboard for display and statistics.
The time range selected on the interface refers to the time range when the first step of the funnel occurs.
Step: consists of an event and one or more filtering conditions, representing a key step in a transformation process.
Conversion period: the event limit for the user to complete the funnel, that is, only within this time range, the user from the first step to the last step can be regarded as a successful conversion.
Time Range: the time range selected on the interface, which refers to the range of events that occur in the first step of the funnel.
Application Scenarios
funnel analysis can analyze the conversion rate of users in key processes of using products, such as looking at the total conversion rate from browsing products to completing purchase to locate which step of conversion users lose the most. for example, users have a low conversion rate from filling in data to completing registration. further analyze the reasons for loss according to some factors affecting this step, and the SMS verification code may not be sent successfully. Take the step from the registration page to registration completion as an example:
Select an analysis subject: Device ID
Select and set a funnel step event: Registration page-Registration succeeded
Set Conversion Cycle to 1 Day
Select a time range
Click "Start Analysis"
 22-10-23
Operation Description
Page Composition
The funnel analysis feature consists of the following components:
1. Other function operation area: users can save reports, click to view historical saved reports and export queried data. 2. Information configuration area: the user can perform operations such as event, indicator, attribute setting, grouping and time selection. 3. Interface composition analysis result area: users can view the visualization chart and detailed data after analysis results.
Operation Description
Select Analysis Subject
In the funnel analysis module, you can concatenate user behavior by device ID, user behavior by logon user ID, and user behavior by entity ID. The drop-down list includes device ID, account ID, and entity ID. By default, device ID is selected.
Device ID: the unique ID generated by QuickTracking for each device
Account ID: the unique ID of the user account that you specify by using the API.
Entity ID: the user ID that is generated by Quick Tracking. You can use ID-Mapping to associate the device ID with the account ID on a one-to-one basis. This way, you can connect the account before and after logon.
Add Funnel Step
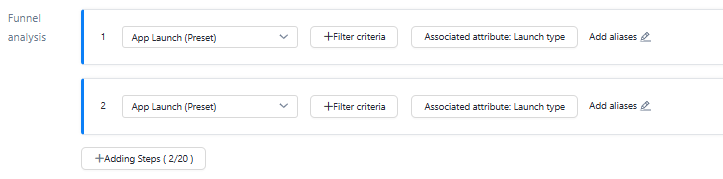
1. Click the drop-down list to select a specific event as a funnel step. You can add an alias to a funnel step. 2. Add filter conditions:
supports property filtering for events. See Appendix 2: Add Screening Conditions for classification description and details. Sex
Different filter symbols are supported for different types of properties. For more information about the specific filter symbols and symbol definitions, see Add Filter Condition. A
3. Set the conversion cycle:
Set the time range required for the entire conversion from the first step to the last step of the funnel. Only within this time range can the user progress from the first step to the last step to be considered a successful conversion.
The conversion cycle granularity can be selected from minute, hour, and day, where:
The event period is one day and is calculated by day partition. Funnel events cannot span days.
The event period is 24 hours and is calculated by hourly partition. Funnel events can span days.
4. Add associated properties:
When different funnel events need to take effect under the same attribute (for example, browse> order, you need to ensure that they occur under the same commodity ID), in this case, the associated attributes are guaranteed to be consistent;
The associated properties can also be different, but the property values need to be consistent.
Select an attribute group group
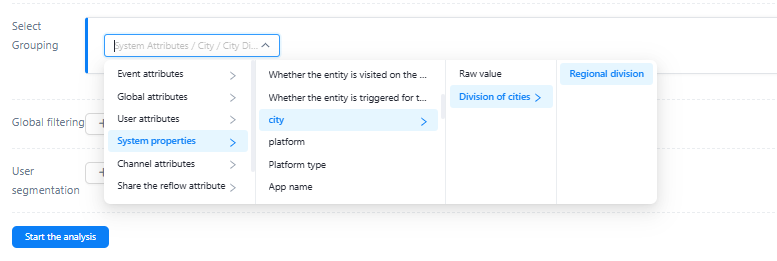
select attributes to group and display metrics. For example, if you want to see the conversion status of different channels, you can use the two attributes for cross analysis.
Only when the properties of all steps meet the properties of the group, it is considered as a complete funnel.
During funnel analysis and grouping, if a user meets multiple funnels, it will be classified into multiple groups.
The attributes in the group support attribute dimension dictionary grouping, such as city division: area division.
Add a global filter

If you select two or more step event metrics, global filtering supports common filtering based on the common attributes of different events. The specific filtering capability and the attribute filtering capability of the same single event are set.
Add a user group Group_20210422173239

When you need to look at the data of a specific group of people, you can use the "filtering user group" to achieve. For more information about how to create a user group, see Crowd insight.
Select a time range

You can select a time range and time granularity as required. You can select a time range in Relative Period or Fixed Period. In Relative Period, the default time is set to the last seven days. The time range is displayed by day.
"Relative period" is based on the date range pushed forward by an anchor point, which will change continuously with time, including the options of several dimensions such as the past X days /weeks /months and the launch to date. You can also customize the time filter conditions of the past X days /weeks /months. A day is a complete natural day. The range of a week is Monday to Sunday, and the month is the natural month (from the first day of each month to the last day of each month). When you select a relative time, you can also specify whether to include today. The detailed rules are as follows:
A. past n days: pushing forward the complete n days based on the current time;
B, the past n weeks: based on the current time to push forward n complete weeks, if the current time is the last day of the week, then the past n weeks include the current time in the week. Example: If the current time is 7.20 (Tuesday), then the last week is 7.12-7.18 (Monday-Sunday). If the current time is 7.18 (Sunday), then the last week is 7.12-7.18.
C. Past N Months: Push forward N complete months based on the current time. If the current time is the last day of the month, then the past N months include the month in which the current time is located. Example: If the current time is 7.20, then the past month is 6.1-6.30; if the current time is 6.30, then the past month is 6.01-6.30.
"Fixed period" You can directly select the start date in the calendar box, you can also directly enter the number of days, quickly select the time period, click the application will select the current time range, data analysis.
view analysis charts retail

After you set the query conditions and click Start Analysis, you can view the analysis results.
Click "Export Data" in the upper right corner to download the Excel file.
Save the commonly used metrics for subsequent re-query. You can use the "Save" setting button in the upper right corner to perform operations.
* Total conversion rate: the conversion rate of the users who are triggered after the first step is triggered. Within the time range and the conversion period after the first step is triggered, events are triggered in sequence by step (including event filtering conditions and global filtering conditions) and the conversion rate of the final step by grouping dimension.
* Conversion rate between steps: The percentage of users who have been converted after the first step is triggered, in the conversion period within the Time Range and after the first step is triggered. * Step n Devices /Logged-in Users:
A. If n=1: Within the time range, the event in Step 1 is triggered (within the filtering conditions, including the event filtering conditions and global filtering conditions), and the number of devices /logon users is deduplication by group.
B, if n>1: triggered after the first n-1 step of the user, in the "time range" and in the "time period" after the first step trigger time, triggered the nth step of the event (in the filter conditions, including the event filter conditions and global filter conditions), and by the group dimension of the device number /login user number.
view detailed data people

In the detailed data, there are detailed results for each step. Click the result data of the query to directly save the data to adult groups.
save data to reports number of users

Click Save in the upper-right corner. In the Save Report dialog box, select the following information:
1. Enter a report name 2. Select the time period for saving the report "Impact of different time periods on the report"
Select a relative time period. The report date can be queried according to the time selected on the kanban.
Select a fixed period, the report date will not change according to the kanban selection time
No period is selected, the report date follows the time selected on the kanban
3. Click OK to save the data to the report list. Add Report to Kanban For a saved report, click Add to Kanban. In the Add to Kanban dialog box, select the following information: 
1 Enter Report Name 2 Select the added kanban 3 Select the type of display you want the chart to display. 4 Select the display layout of the chart in the self-made kanban 5 Click "OK"
Funnel Analysis computational logic
1. specify the funnel for each step
The funnel consists of 2 or more steps, and the user needs to complete these steps in sequence.
Each step consists of an event and several filter conditions.
2. Set the funnel time range and conversion period
a complete funnel requires a clear time limit for the user to complete the funnel, and only within this cycle can the user progress from the first step to the last step to be considered a successful conversion. At the same time, we should also determine the time range, that is, the statistical interval, nearly 7 days or nearly 30 days.
Time Range: the statistical interval, such as the last 7 days or the last 30 days.
Conversion Cycle: supports minutes, hours, and days.
Partition Rule:
The time period is one day and is partitioned by day. Events cannot span days.
If the time period is 24 hours, events are partitioned by hour. Events can span days.
Example: Assume that the funnel step is "visit homepage-> select payment method-> successful payment" and the analysis range is 1-3. The user behavior is as follows:
1 at 11:00 | 1 23:00 | 2 at 11:00 | 2 at 23:00 | 3 at 11 o'clock | 3, 23:00 |
Visit the homepage | Select a payment method | Visit the homepage | Visit the homepage | Select a payment method | successful payment |
The conversion cycle is 1 day: The conversion is not included (not completed within 1 natural day).
The conversion cycle is 2 days: The conversion is included in the conversion (completed within 2 natural days).
The conversion period is 24 hours: included in the conversion (completed within 23: 00 on the 2nd to 23: 00 on the 3rd).
3. Set funnel conditions
You can use different filter conditions to limit funnels. The filter logic is as follows:
A. Event filtering conditions and global filtering conditions are supported
B. The global filter condition is applied to all steps. C. If event filtering conditions and global filtering conditions are configured, the filtering condition logic is: event filtering conditions&global filtering conditions. For example, assume that the steps of a funnel are defined as: accessing the homepage, selecting a payment method (filter condition: payment method=WeChat), and successful payment. The behavior of different users is as follows:
User 1: Visit the homepage-> Select a payment method (Alipay) -> Select a payment method (WeChat) -> Payment is successful
User 2: Visit Home Page-> Select Payment Method (Alipay) -> Visit Home Page-> Visit Home Page-> Payment Successful
User 1 is added to the final conversion funnel. User 2 is not added to the final conversion funnel.
4. Group and compare funnels
Funnel analysis includes the grouping feature. You can add grouping filters to query conditions to compare funnels in different groups.
A. You can group prefabricated properties and custom properties that are used in all steps.
B. Each group funnel is considered as a complete group funnel only if the attributes of all steps meet the group attributes.
C. If a user meets multiple grouping conditions within a time range, the user is classified into multiple groups.
Example:
Assume that a grouping attribute is selected as the custom attribute "product brand". This filtering indicates that the funnel is grouped based on the value of "product brand". The steps of setting up a funnel are defined as: browsing products, adding to shopping cart, and paying. Then, the behavior sequence of different users and the actual conversion steps are as follows:
Example 1: Browse products (Apple)-> Browse products (Nokia)-> Browse products (Samsung)-> Add to shopping cart (Samsung)-> Pay (Samsung)
Example 2: Browse products (Apple)-> Browse products (Samsung)-> Browse products (Apple)-> Add to shopping cart (Apple)-> Pay (Apple)
Example 3: Browse Products (Apple)-> Browse Products (Samsung)-> Add to Cart (Samsung)-> Browse Products (Apple)-> Add to Cart (Apple)-> Pay Products (Apple)-> Browse Products (Nokia)-> Add to Cart (Nokia)
Example 4: Browse products (Apple)-> Add to cart (Samsung)-> Pay (Samsung)
In the above example, the number of conversions:
Group (phone brand) \Event | Browse Products | Add to Cart | Payment | Number of final conversions |
Apple | 4 | 2 | 2 | 2 |
Samsung | 3 | 2 | 2 | 2 |
Nokia | 2 | 1 | 0 | 0 |
Overall | 4 | 4 | 4 | 4 |
5. Interpretation of funnel conversion metrics
Calculate the number of users at each stage, and then calculate the conversion rate
A. Step n: Number of devices /Number of logon users:
If n=1: Within the time range, the event in Step 1 is triggered (within the filtering conditions, including the event filtering conditions and global filtering conditions), and the number of devices /logon users is deduplication by group.
If n>1: Triggered the user after the n-1 step, in the "time range" and in the "time period" after the first step trigger time, the event of the nth step is triggered (in the filter conditions, including the event filter conditions and global filter conditions), and by the group dimension of the device number /login user number.
B. Total conversion rate=Number of deduplication devices in the last step (number of logon users) /Number of deduplication devices in the first step (number of logon users)
C, conversion rate between steps=number of deduplication devices in step n (number of login users) /number of deduplication devices in step n-1 (number of login users)