Telegraf is a commonly used agent developed by InfluxData to collect metrics. Telegraf supports multiple input and output plug-ins, such as MySQL, Redis, and Elasticsearch. This topic describes how Telegraf works, how to install Telegraf, and how to use Telegraf to collect metrics.
Implementation
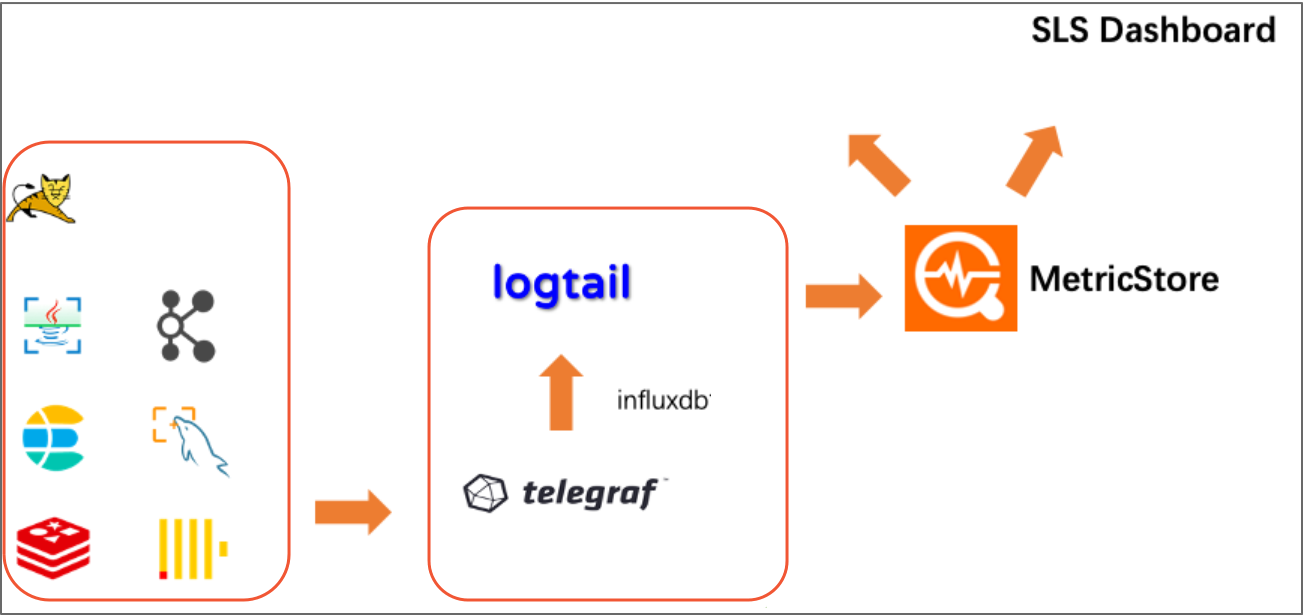
You can use Telegraf to collect metrics from MySQL, Redis, and Elasticsearch. After you collect metrics, you can use the InfluxDB line protocol to write the collected data to Logtail. Then, Logtail uploads the metrics to the MetricStore of Simple Log Service. Simple Log Service allows you to configure plug-ins and create dashboards in the console for the collected data. The following figure shows how Telegraf works.
Install Telegraf
If Logtail V0.16.50 or later is installed on a server, the server automatically installs Telegraf after the configuration file of Telegraf is detected for the first time.
If the Logtail version is in the range 0.16.48 ≤ Logtail version < 0.16.50, you must update Logtail to the latest version. Otherwise, you must manually install Telegraf by performing the following steps:
Select a network type based on the region of the server where you want to install Telegraf. For more information, see Select a network type.
Download the logtail.sh script to install Logtail. For more information, see Install Logtail on a Linux server.
The script does not require installation. If you cannot identify the region where the server resides, you can download Logtail over the Internet.
wget http://logtail-release-cn-hangzhou.oss-cn-hangzhou.aliyuncs.com/linux64/logtail.sh -O logtail.sh;
chmod 755 logtail.sh
Install Telegraf.
sudo ./logtail.sh install-agent ${region} telegrafReplace ${region} with the region where the server resides, for example, sudo ./logtail.sh install-agent cn-hangzhou telegraf.
Check whether Telegraf is installed.
Run the following command to view the telegraf directory. If files such as telegraf and telegrafd exist in the telegraf directory, the installation is successful.
ls /etc/ilogtail/telegraf
Collection methods
Telegraf provides the following two collection methods:
Local collection
You can use Telegraf to collect metrics from a local server by using the local collection method. The server specified in your machine group is the server from which you want to collect metrics. When you create a Logtail configuration file, you can set the IP address of the server to 127.0.0.1. We recommend that you use this collection method.
Remote collection
You can use Telegraf installed on a server to collect metrics from other servers by using the remote collection method. When you create a Logtail configuration file, you can set the IP address to the actual IP address or the actual endpoint of the server. If you use the remote collection method, you can configure only one server in the machine group. Otherwise, duplicate data is generated. You can use the remote collection method in the following scenarios:
You want to collect metrics of a cloud service where you cannot install Logtail and Telegraf.
You do not want to install a metric collection agent on a running server.