By default, Kubernetes scales pods based on CPU and memory. For GPU workloads — deep learning inference, model training, and other high-performance computing (HPC) tasks — those metrics don't reflect actual GPU resource pressure. This topic shows you how to configure Managed Service for Prometheus, the Prometheus Adapter, and Horizontal Pod Autoscaler (HPA) to scale pods based on GPU utilization and GPU memory.
How it works
Managed Service for Prometheus collects NVIDIA Data Center GPU Manager (DCGM) metrics from GPU nodes. The Prometheus Adapter translates those raw metrics into the Kubernetes Custom Metrics API format. HPA reads the custom metrics and adjusts pod replicas when utilization crosses your defined threshold.

Prerequisites
Before you begin, ensure that you have:
-
A GPU node added to your cluster, or a dedicated GPU cluster created. See Add a GPU node or Create a dedicated GPU cluster
Step 1: Deploy Managed Service for Prometheus and the metrics adapter
Enable Prometheus monitoring
Enable Prometheus monitoring for your cluster.
Skip this step if you selected to install Prometheus when you created the cluster.
Install ack-alibaba-cloud-metrics-adapter
Get the Grafana read address
-
Log on to the ACK consoleACK consoleACK consoleARMS console.
-
In the left navigation pane, choose Managed Service for Prometheus > Instances.
-
At the top of the page, select the region where your Container Service for Kubernetes (ACK) cluster is located, then click the name of the target instance.
-
On the Settings page, click the Settings tab. In the HTTP API URL (Grafana Read Address) section, copy the internal network address.
Configure the Prometheus URL
-
Log on to the ACK console. In the left navigation pane, click Marketplace > Marketplace.
-
On the App Marketplace page, click the App Catalog tab. Search for and click ack-alibaba-cloud-metrics-adapter.
-
On the ack-alibaba-cloud-metrics-adapter page, click Deploy.
-
In the Basic Information wizard, select a cluster and namespace, then click Next.
-
In the Parameters wizard, select a Chart Version. In the Parameters section, set the Prometheus
urlparameter to the HTTP API address you copied, then click OK.
Step 2: Configure adapter rules for GPU metrics
The Prometheus Adapter maps raw DCGM metric series to Kubernetes custom metric names using three key fields:
-
seriesQuery: selects which Prometheus metric series to expose -
resources.overrides: maps Prometheus label names to Kubernetes resource dimensions (pod, namespace, node) -
metricsQuery: the PromQL expression the adapter runs when HPA requests the metric value
Available GPU metrics
| Metric | Description | Unit |
|---|---|---|
DCGM_FI_DEV_GPU_UTIL |
GPU card utilization | % |
DCGM_FI_DEV_FB_USED |
GPU card memory usage | MiB |
DCGM_CUSTOM_PROCESS_SM_UTIL |
GPU utilization of the container | % |
DCGM_CUSTOM_PROCESS_MEM_USED |
GPU memory usage of the container | MiB |
DCGM_CUSTOM_PROCESS_GPU_MEM_USED_RATIO |
GPU memory utilization of the container | % |
DCGM_FI_DEV_GPU_UTIL and DCGM_FI_DEV_FB_USED are card-level metrics valid only for dedicated GPU scheduling. For shared GPU scheduling — where multiple pods share one GPU card — NVIDIA reports only card-level utilization. The value shown by nvidia-smi inside a pod is the utilization of the entire card, not the individual container.
DCGM_CUSTOM_PROCESS_GPU_MEM_USED_RATIO is calculated as:
GPU memory utilization = Actual GPU memory usage of the current pod container (Used) / GPU memory allocated to the current pod container (Allocated)For the full list of available metrics, see Monitoring metric descriptions.
Add adapter rules
-
Log on to the ACK console. In the left navigation pane, click Clusters.
-
On the Clusters page, click the name of your cluster. In the left navigation pane, click Applications > Helm.
-
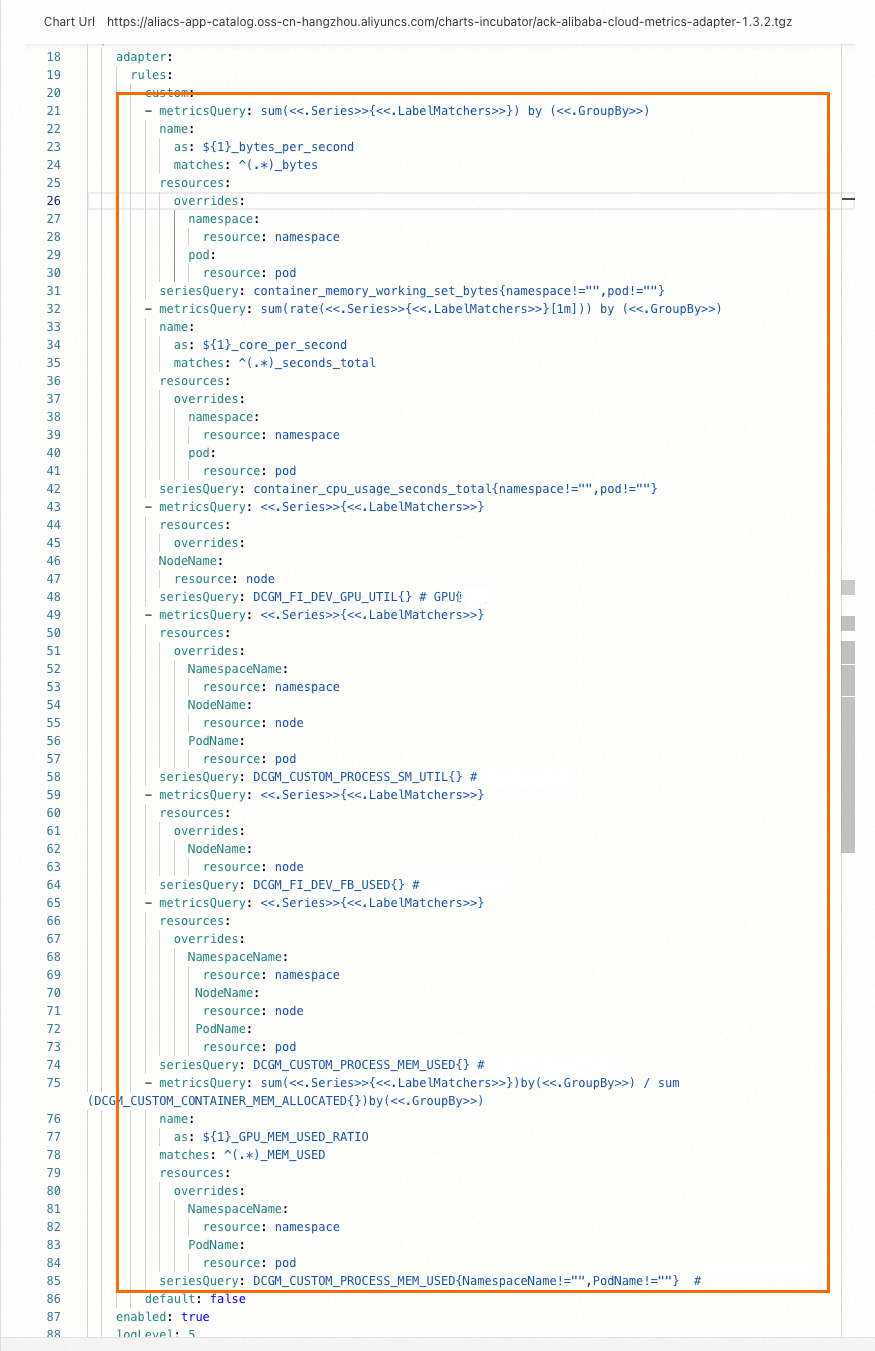
In the Actions column for the ack-alibaba-cloud-metrics-adapter Helm release, click Update. Add the following rules to the
customfield.- metricsQuery: avg(<<.Series>>{<<.LabelMatchers>>}) by (<<.GroupBy>>) resources: overrides: NodeName: resource: node seriesQuery: DCGM_FI_DEV_GPU_UTIL{} # GPU utilization - metricsQuery: avg(<<.Series>>{<<.LabelMatchers>>}) by (<<.GroupBy>>) resources: overrides: NamespaceName: resource: namespace NodeName: resource: node PodName: resource: pod seriesQuery: DCGM_CUSTOM_PROCESS_SM_UTIL{} # Container GPU utilization. - metricsQuery: sum(<<.Series>>{<<.LabelMatchers>>}) by (<<.GroupBy>>) resources: overrides: NodeName: resource: node seriesQuery: DCGM_FI_DEV_FB_USED{} # GPU memory usage. - metricsQuery: sum(<<.Series>>{<<.LabelMatchers>>}) by (<<.GroupBy>>) resources: overrides: NamespaceName: resource: namespace NodeName: resource: node PodName: resource: pod seriesQuery: DCGM_CUSTOM_PROCESS_MEM_USED{} # Container GPU memory usage. - metricsQuery: sum(<<.Series>>{<<.LabelMatchers>>}) by (<<.GroupBy>>) / sum(DCGM_CUSTOM_CONTAINER_MEM_ALLOCATED{}) by (<<.GroupBy>>) name: as: ${1}_GPU_MEM_USED_RATIO matches: ^(.*)_MEM_USED resources: overrides: NamespaceName: resource: namespace PodName: resource: pod seriesQuery: DCGM_CUSTOM_PROCESS_MEM_USED{NamespaceName!="",PodName!=""} # Container GPU memory utilization.After saving, the configuration looks like the following:
Verify that custom metrics are registered
Run the following command to confirm HPA can see the GPU metrics:
kubectl get --raw "/apis/custom.metrics.k8s.io/v1beta1"The output lists all registered custom metrics. A successful configuration includes entries for DCGM_FI_DEV_GPU_UTIL, DCGM_CUSTOM_PROCESS_SM_UTIL, DCGM_FI_DEV_FB_USED, and DCGM_CUSTOM_PROCESS_MEM_USED. The following shows an example for DCGM_CUSTOM_PROCESS_SM_UTIL:
{
  "kind": "APIResourceList",
  "apiVersion": "v1",
  "groupVersion": "custom.metrics.k8s.io/v1beta1",
  "resources": [
    {
      "name": "nodes/DCGM_CUSTOM_PROCESS_SM_UTIL",
      "singularName": "",
      "namespaced": false,
      "kind": "MetricValueList",
      "verbs": [
        "get"
      ]
    },
    {
      "name": "pods/DCGM_CUSTOM_PROCESS_SM_UTIL",
      "singularName": "",
      "namespaced": true,
      "kind": "MetricValueList",
      "verbs": [
        "get"
      ]
    },
    {
      "name": "namespaces/DCGM_CUSTOM_PROCESS_SM_UTIL",
      "singularName": "",
      "namespaced": false,
      "kind": "MetricValueList",
      "verbs": [
        "get"
      ]
    },
    {
      "name": "DCGM_CUSTOM_PROCESS_GPU_MEM_USED_RATIO",
      "singularName": "",
      "namespaced": false,
      "kind": "MetricValueList",
      "verbs": [
        "get"
      ]
    }
  ]
}
Step 3: Test GPU-based auto scaling
This example deploys a BERT intent detection inference service on a GPU node, then runs a stress test to trigger scale out and scale in based on DCGM_CUSTOM_PROCESS_SM_UTIL (container GPU utilization).
Configure HPA
HPA calculates the desired replica count using the following formula:
Desired Replicas = ceil[Current Replicas × (Current Metric / Desired Metric)]For example, with 1 current replica, a current utilization of 23, and a target of 20: ceil(1 x 23/20) = 2.
This example triggers scale out when container GPU utilization (DCGM_CUSTOM_PROCESS_SM_UTIL) exceeds 20%. Create the HPA resource. The API version depends on your Kubernetes version.
v1.23 or later
cat <<EOF | kubectl create -f -
apiVersion: autoscaling/v2  # Use the autoscaling/v2 version for HPA configuration.
kind: HorizontalPodAutoscaler
metadata:
  name: gpu-hpa
spec:
  scaleTargetRef:
    apiVersion: apps/v1
    kind: Deployment
    name: bert-intent-detection
  minReplicas: 1
  maxReplicas: 10
  metrics:
  - type: Pods
    pods:
      metric:
        name: DCGM_CUSTOM_PROCESS_SM_UTIL
      target:
        type: Utilization
        averageValue: 20 # A scale-out is triggered when the container's GPU utilization exceeds 20%.
EOF
Earlier than v1.23
cat <<EOF | kubectl create -f -
apiVersion: autoscaling/v2beta1  # Use the autoscaling/v2beta1 version for HPA configuration.
kind: HorizontalPodAutoscaler
metadata:
  name: gpu-hpa
spec:
  scaleTargetRef:
    apiVersion: apps/v1
    kind: Deployment
    name: bert-intent-detection
  minReplicas: 1
  maxReplicas: 10
  metrics:
  - type: Pods
    pods:
      metricName: DCGM_CUSTOM_PROCESS_SM_UTIL # GPU utilization of the pod.
      targetAverageValue: 20 # A scale-out is triggered when the container's GPU utilization exceeds 20%.
EOF
Confirm the HPA is active and reading the metric:
kubectl get hpaExpected output:
NAME      REFERENCE                          TARGETS   MINPODS   MAXPODS   REPLICAS   AGE
gpu-hpa   Deployment/bert-intent-detection   0/20      1         10        1          74s
TARGETS shows 0/20, meaning current GPU utilization is 0% against a 20% threshold.
Test scale out
Run a stress test against the inference service:
hey -n 10000 -c 200 "http://47.95.XX.XX/predict?query=music"While the test runs, watch the HPA status:
kubectl get hpa --watchExpected output when GPU utilization exceeds the threshold:
NAME      REFERENCE                          TARGETS   MINPODS   MAXPODS   REPLICAS   AGE
gpu-hpa   Deployment/bert-intent-detection   23/20     1         10        2          7m56s
TARGETS rising to 23/20 triggers HPA to scale the Deployment to 2 replicas (following the formula: ceil(1 x 23/20) = 2). Confirm the second pod started:
kubectl get podsExpected output:
NAME                                    READY   STATUS    RESTARTS   AGE
bert-intent-detection-7b486f6bf-f****   1/1     Running   0          44m
bert-intent-detection-7b486f6bf-m****   1/1     Running   0          14s
Test scale in
When the stress test stops, GPU utilization drops back to 0. HPA applies a default 5-minute scale-in cooldown before terminating the extra pod. Use --watch to observe the transition in real time rather than polling manually:
kubectl get hpa --watchExpected output after the cooldown:
NAME      REFERENCE                          TARGETS   MINPODS   MAXPODS   REPLICAS   AGE
gpu-hpa   Deployment/bert-intent-detection   0/20      1         10        1          15m
Confirm only one pod remains:
kubectl get podsExpected output:
NAME                                    READY   STATUS    RESTARTS   AGE
bert-intent-detection-7b486f6bf-f****   1/1     Running   0          52m
FAQ
How can I tell if a GPU card is being used?
Check the GPU Monitoring tab in the ACK console. A GPU card under load shows increasing utilization; an idle card stays flat.
-
Log on to the ACK console. In the left navigation pane, click Clusters.
-
On the Clusters page, click the name of your cluster. In the left navigation pane, click Operations > Prometheus Monitoring.
-
On the Prometheus Monitoring page, click the GPU Monitoring tab. Observe the GPU card utilization graph.