Cloud Enterprise Network (CEN) monitors multiple metrics for various resources by default. You can use the monitoring data to learn about the traffic rate and bandwidth usage of your resources. Alibaba Cloud Monitor automatically collects the monitoring data of CEN resources. You can also use Cloud Monitor to create threshold-based alert rules for these metrics. If a metric value exceeds the specified threshold, the system sends you an alert notification. This helps you promptly address issues and ensure that your services run as expected.
Supported resources
You can view monitoring metrics for VPC, ECR, VPN, and VBR connections only on the Enterprise Edition transit routers to which these connections are attached.
Resource | Supported monitoring granularity |
Enterprise Edition transit router |
|
VPC connection |
|
ECR connection |
|
VPN connection |
|
VBR connection |
|
Inter-region connection |
|
Express Connect circuit | View monitoring metrics for an Express Connect circuit associated with a VBR instance. The system monitors only the traffic rate and bandwidth usage of the VBR instance on the Express Connect circuit. |
Bandwidth plan | View monitoring metrics for a bandwidth plan instance. |
Zone-level monitoring
When an Enterprise Edition transit router connects to a VPC-connected instance, ECR instance, VBR instance, or IPsec-VPN connection, the system deploys resources in the zones supported by the Enterprise Edition transit router to establish the network connection.
When you create a VPC connection, you can specify the zones where resources are deployed. When you create an ECR connection, VBR connection, or VPN connection, you cannot specify the zones. The system automatically selects zones and deploys the required resources.
For zone-level monitoring, CEN automatically monitors all zones that are supported by the Enterprise Edition transit router and have connected resources. If a zone is not monitored, it indicates that the Enterprise Edition transit router has not connected to any resources in that zone, and no traffic has been transmitted through it.
Description of monitoring metrics
Each data point of a metric is the average value of data collected within a 1-minute period.
For metrics related to the peak bandwidth rate, the system collects a bandwidth rate data point every 10 seconds within a 1-minute period. A total of six data points are collected. The maximum of the six data points is used as the peak bandwidth rate for that minute. You can use the peak bandwidth rate to observe micro-burst traffic at the per-second level.
For metrics related to the average bandwidth rate, the system calculates the average of the bandwidth rates within a 1-minute period and uses it as the average rate for that minute.
Transit router metrics
Intra-region connection metrics
Inter-region connection metrics
Express Connect circuit metrics
Bandwidth plan metrics
View monitoring data
View monitoring data of all resources on the Monitoring Chart page
If you configure a QoS policy for an inter-region connection, you can view monitoring metrics for a QoS queue on the Monitoring tab for that connection. For more information, see View monitoring metrics for an inter-region connection.
On the Monitoring Chart page, you can view monitoring metrics only for the bandwidth plan instances that are bound to the current CEN instance. To view monitoring metrics for any bandwidth plan instance, see View monitoring metrics for a bandwidth plan.
Log on to the CEN console.
On the Instances page, click the ID of the CEN instance that you want to manage.
On the instance details page, click the Charts tab. The tab displays the monitoring metrics for the corresponding resources.
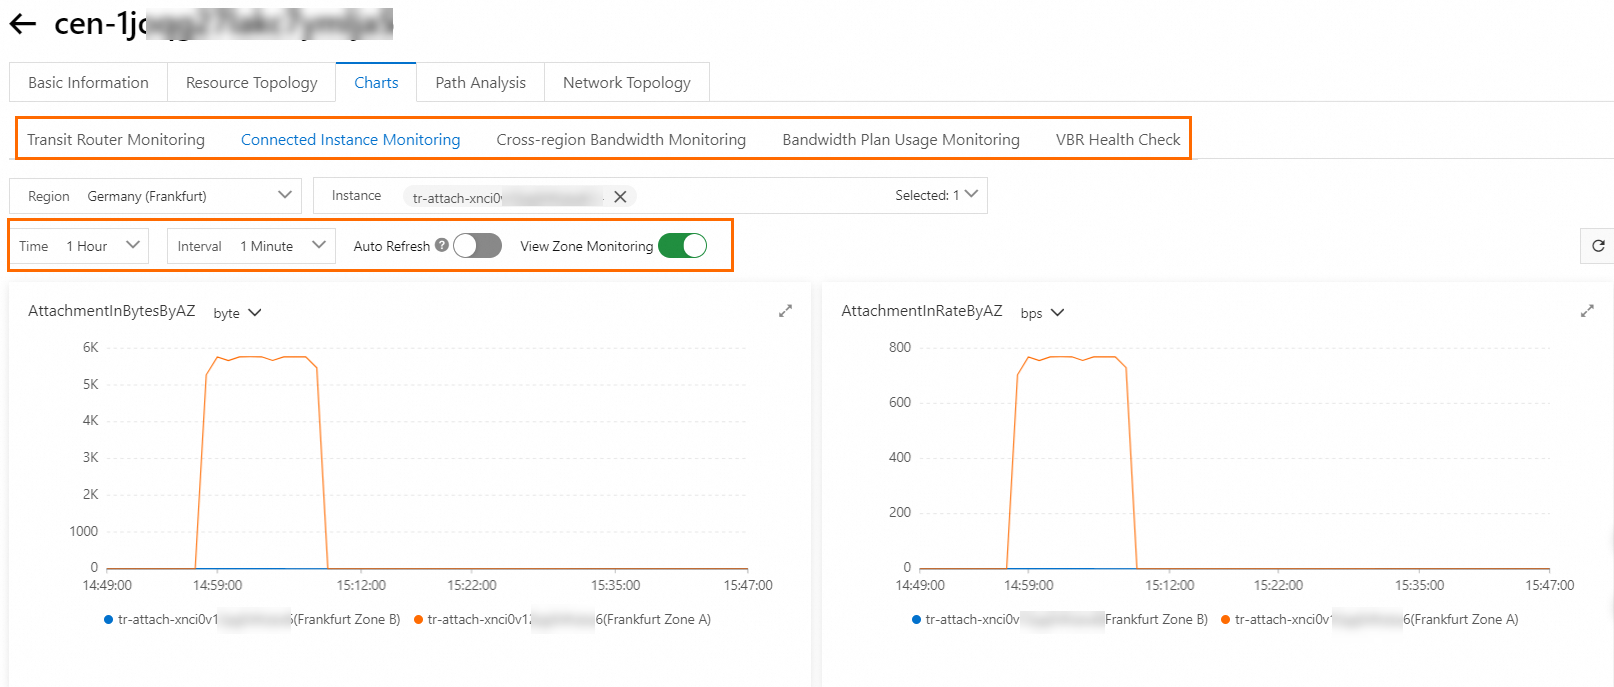
By default, the Charts tab displays monitoring data for resources from the last hour. The default time interval is 1 minute.
Above the line chart for a metric, you can view monitoring data from the last 3 hours, 6 hours, 12 hours, 1 day, 7 days, or 30 days, or from a custom time range. You can also change the Time Interval.
You can automatically refresh monitoring data.
Above the line chart for a metric, you can enable Auto Refresh to automatically refresh the chart with the latest monitoring data every minute.
For transit routers and network instance connections (such as VPC, ECR, VPN, and VBR connections), you can view monitoring data at the zone level.
Above the line chart for a metric, you can enable Zone-level Results to display monitoring metrics by zone. In this view, each line represents a different zone.
View monitoring data on the monitoring tab of each resource
View monitoring metrics for a transit router
Log on to the CEN console.
On the Instances page, click the ID of the CEN instance that you want to manage.
On the tab, find the transit router and click the
 icon in the Monitoring column.
In the Monitoring panel, you can view the monitoring metrics for the transit router.
View monitoring metrics for a network instance connection
Log on to the CEN console.
On the Instances page, click the ID of the CEN instance that you want to manage.
On the tab, find the transit router with the attached network instance connection and click its instance ID.
On the Intra-region Connections tag, find the target network instance connection and click the
icon in the Monitoring column. In the Monitoring panel, view the monitoring data for the connection.
View monitoring metrics for an inter-region connection
Log on to the CEN console.
On the Instances page, click the ID of the CEN instance that you want to manage.
On the tab, find the transit router to which the inter-region connection is attached and click the instance ID.
On the details page for the transit router, click the Inter-region Connections tab.
On the Cross-region Connections tab, find the inter-region connection that you want to manage, and in the Monitoring column, click the
icon.In the upper-left corner of the Monitoring panel, select All Queues to view the monitoring metrics for the inter-region connection.
In the upper-left corner of the Monitoring panel, select Default Queue or a specific queue to view monitoring metrics for a QoS queue.
View monitoring metrics for an Express Connect circuit
Log on to the CEN console.
In the left-side navigation pane, click VBR Health Check.
On the VBR Health Check page, select the region where you deployed the VBR instance.
To view the monitoring metrics of the Express Connect circuit, find the target health check configuration and click the
icon in the Monitoring column.
View monitoring metrics for a bandwidth plan
View monitoring metrics for a bandwidth plan bound to a CEN instance
Log on to the CEN console.
On the Instances page, find the CEN instance that is bound to the target bandwidth plan and click the instance ID.
On the instance details page, find the target bandwidth plan on the tab.
In the Monitoring column, click the
icon to view monitoring data for the bandwidth plan.
View monitoring metrics for any bandwidth plan
Log on to the CEN console.
In the navigation pane on the left, click Bandwidth Plans. On the Bandwidth Plans page, find the target bandwidth plan instance.
In the Monitoring column, click the
icon to view the metrics for the bandwidth plan instance.
Create a threshold-based alert rule for a metric
You can use Cloud Monitor to create threshold-based alert rules for metrics. If a metric value exceeds the specified threshold, the system automatically sends you an alert notification. This helps you promptly address issues and prevent service interruptions.
Log on to the CEN console.
On the Instances page, click the ID of the CEN instance that you want to manage.
On the tab, find an Enterprise Edition transit router and click Set Alert in the Monitoring column.
In the Configure Rule Description panel, click Cancel.
In the Create Alert Rule panel, configure the parameters and click Confirm.
This topic describes only the parameters that are most relevant to this task. For information about the other parameters, see Create an alert rule.
Product: The resource type to monitor.
CEN - Area: Used to monitor bandwidth plan instances.
CEN - Region: monitors inter-region connections and QoS queues.
CEN - VBR: monitors Express Connect circuits.
CEN - TR: monitors transit routers and connections to network instances.
Associated Resources: The scope of resources to monitor.
Rule Description: Click Add Rule. Select a metric type from the drop-down list and set the rule conditions in the Configure Rule Description panel.
NoteYou cannot create alert rules based on the Latency metric for inter-region connections.
References
After you create an alert rule, you can view the alert history and manage alert rules in the Cloud Monitor console. For more information, see Alert Service.
If you want to compare the monitoring metrics of different resources for more detailed monitoring, you can create a custom monitoring dashboard in the Cloud Monitor console. For more information, see Visualization overview.
To query the monitoring data of CEN resources by calling API operations, you can use the API operations of Cloud Monitor.
For more information about the API operations provided by Cloud Monitor, see Cloud service monitoring.
For more information about the Namespace, MetricName, Dimensions, and Period parameters for an API call, see Appendix 1: Cloud service monitoring metrics.
If you want to monitor specific traffic information, you can configure flow logs for your resources. Flow logs can record traffic information transmitted through Enterprise Edition transit routers, VPC connections, ECR connections, VPN connections, VBR connections, and inter-region connections. For more information, see Configure flow logs.