This topic describes how to use Alibaba Cloud Auditbeat to collect data from the Linux audit framework, monitor system file changes, and generate visual charts.
Background information
Auditbeat is a lightweight shipper service that can be used to collect audit logs from the Linux audit framework and monitor file changes. For example, you can use Auditbeat to collect audit events from the Linux audit framework and audit the events in a centralized manner. You can also use Auditbeat to detect changes to critical files, such as binary files and configuration files, and identify potential security policy violations. Then, Auditbeat can generate standard structured data for analytics. Auditbeat can also be seamlessly integrated with Logstash, Elasticsearch, and Kibana.
Auditbeat supports the following modules:
Auditd
The auditd module receives audit events from the Linux audit framework. The framework is a part of the Linux kernel. This module establishes a subscription to the kernel to receive events when they occur. For more information, see open source Auditbeat documentation.
ImportantIf you run Auditbeat when the auditd module is enabled, other monitoring tools may affect Auditbeat. For example, if the auditd process is also registered to receive data from the Linux audit framework, Auditbeat may encounter an error. In this case, you can run the
service auditd stopcommand to stop the process.File integrity
The file integrity module monitors the changes to files in a specific directory in real time. To use this module in Linux, make sure that your Linux kernel supports inotify, which is installed for a Linux kernel of 2.6.13 or later. For more information, see open source Auditbeat documentation.
NoteOpen source Auditbeat also contains an experimental module named system. The system module may be deleted or changed in a later Auditbeat version. Therefore, we recommend that you do not use this module. For more information, see Modules.
Prerequisites
The following operations are performed:
Create an Alibaba Cloud Elasticsearch cluster.
For more information, see Create an Alibaba Cloud Elasticsearch cluster.
Enable the Auto Indexing feature for the Elasticsearch cluster.
For security purposes, Alibaba Cloud Elasticsearch disables the Auto Indexing feature by default. However, Beats depends on this feature. If you select Elasticsearch for Output when you create a shipper, you must enable the Auto Indexing feature. For more information, see Access and configure an Elasticsearch cluster.
Create an Alibaba Cloud Elastic Compute Service (ECS) instance in the virtual private cloud (VPC) where the Elasticsearch cluster resides.
For more information, see Create an instance on the Custom Launch tab.
ImportantBeats supports only Alibaba Cloud Linux (Alinux), Red Hat Enterprise Linux (RHEL), and CentOS.
Install Cloud Assistant and Docker on the ECS instance.
For more information, see Install Cloud Assistant Agent and Deploy and use Docker on Alibaba Cloud Linux 2 instances.
Procedure
Log on to the Alibaba Cloud Elasticsearch console.
In the left-side navigation pane, click Beats Data Shippers.
In the Create Shipper section of the page that appears, click Auditbeat.
Install and configure a shipper.
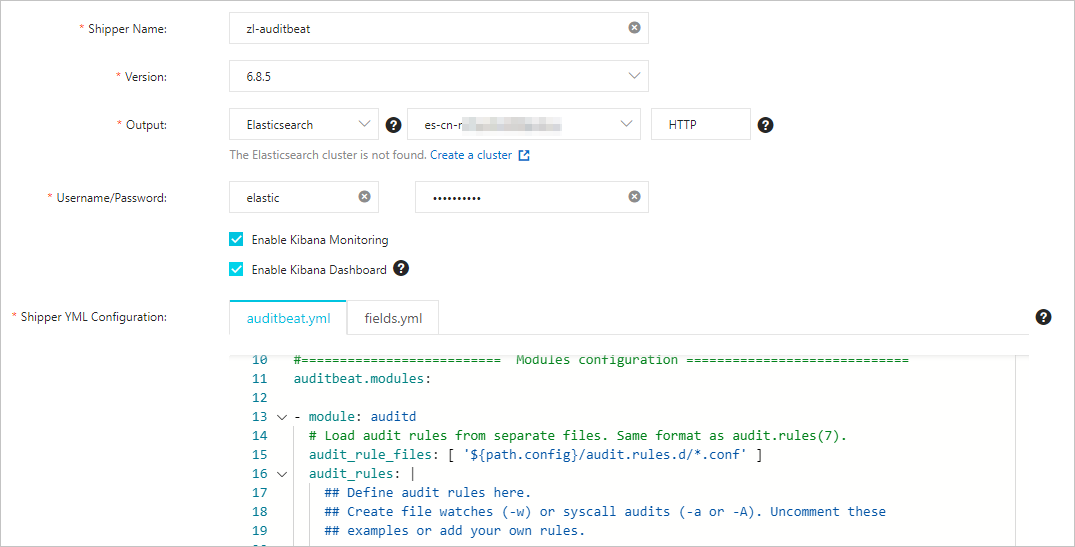
For more information, see Collect the logs of an ECS instance and Prepare a YML configuration file for a shipper. The following figure shows the configurations that are used in this example.
 Note
NoteIf you select Enable Kibana Monitoring, the system enables Auditbeat service monitoring in the Kibana console.
If you select Enable Kibana Dashboard, the system generates charts in the Kibana console. You do not need to configure the YML file. Alibaba Cloud Kibana is deployed in a VPC. You must enable the Private Network Access feature for Kibana on the Kibana Configuration page. For more information, see Configure a public or private IP address whitelist for Kibana.
In this example, default configurations in the auditbeat.yml file are used. The following configurations are used for related modules:
Auditd
- module: auditd # Load audit rules from separate files. Same format as audit.rules(7). audit_rule_files: [ '${path.config}/audit.rules.d/*.conf' ] audit_rules: |audit_rule_files: specifies the files from which audit rules are loaded. Wildcards are supported. By default, files for 32-bit and 64-bit operating systems are provided. You can select suitable files based on your operating system.audit_rules: specifies audit rules. You can connect to your ECS instance and run the./auditbeat show auditd-rulescommand to view default audit rules.-a never,exit -S all -F pid=26253 -a always,exit -F arch=b32 -S all -F key=32bit-abi -a always,exit -F arch=b64 -S execve,execveat -F key=exec -a always,exit -F arch=b64 -S connect,accept,bind -F key=external-access -w /etc/group -p wa -k identity -w /etc/passwd -p wa -k identity -w /etc/gshadow -p wa -k identity -a always,exit -F arch=b64 -S open,truncate,ftruncate,create,openat,open_by_handle_at -F exit=-EACCES -F key=access -a always,exit -F arch=b64 -S open,truncate,ftruncate,create,openat,open_by_handle_at -F exit=-EPERM -F key=accessNoteIn most cases, the default audit rules can meet your requirements. If you want to use custom audit rules, modify the audit rule files in the audit.rules.d directory.
File integrity
- module: file_integrity paths: - /bin - /usr/bin - /sbin - /usr/sbin - /etcpaths: specifies the paths that store the files you want to monitor. Default paths include/bin,/usr/bin,/sbin,/usr/sbin, and/etc.
Select the ECS instance on which you want to install the shipper.
Start the shipper and check whether the shipper is installed.
Click Start.
Then, the Start Shipper message appears.
Click Back to Beats Shippers. In the Manage Shippers section of the Beats Data Shippers page, view the installed shipper.
After the state of the shipper changes to Enabled 1/1, click View Instances in the Actions column.
In the View Instances panel, check whether the shipper is installed on the ECS instance. If the value of Installed Shippers is Normal Heartbeat, the shipper is installed.
View the result
Log on to the Kibana console of the Elasticsearch cluster.
For more information, see Log on to the Kibana console.
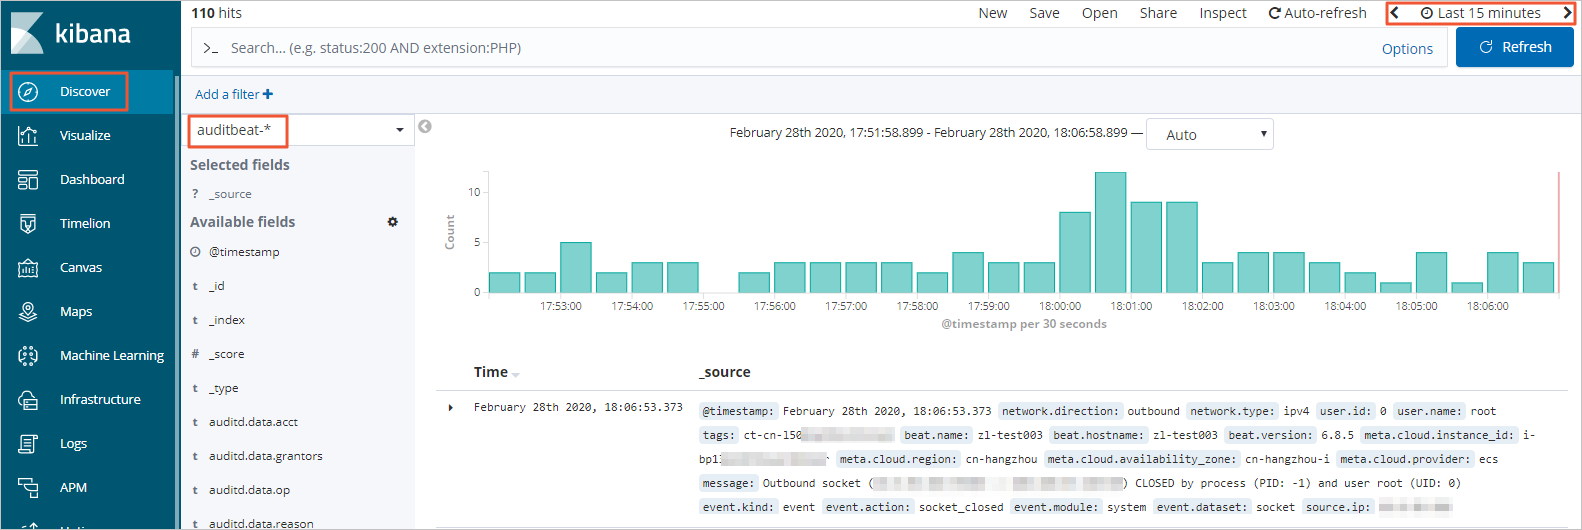
In the left-side navigation pane, click Discover. On the page that appears, select auditbeat-* from the drop-down list in the upper-left corner and specify a period in the upper-right corner. Then, view the data collected by Auditbeat within the specified period.
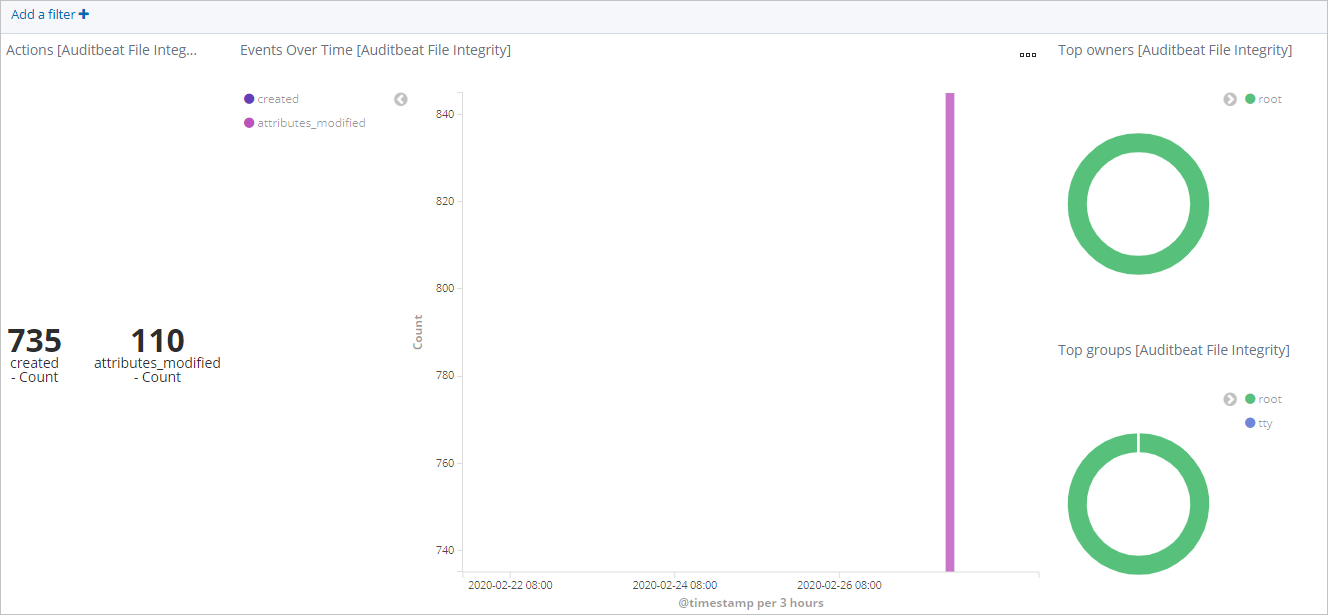
In the left-side navigation pane, click Dashboard.
In the Dashboards section of the page that appears, click [Auditbeat File Integrity] Overview. On the page that appears, select a period. Then, view the changes to monitored files within the specified period.