Kubernetes (K8s) events record cluster state changes, such as Pod creation, running, and deletion, and component exceptions. K8s Event Center collects all events from your Kubernetes clusters in real time, providing storage, querying, analysis, visualization, and alerting capabilities. This topic describes how to create and use a K8s Event Center.
Background
The Kubernetes architecture is based on a state machine. Transitions between states generate corresponding events. Transitions between normal states generate Normal-level events, and transitions between normal and abnormal states generate Warning-level events.
Container Service for Kubernetes (ACK) provides an out-of-the-box event monitoring solution for container scenarios. It uses the ACK-maintained NPD and the included kube-eventer to provide container event monitoring.

Node Problem Detector (NPD) is a diagnostic tool for Kubernetes nodes. It converts node anomalies, such as Docker Engine hangs, Linux kernel hangs, network egress issues, or file descriptor anomalies, into node events. When combined with kube-eventer, NPD enables a closed-loop system for node event alerting. For more information, see NPD.
kube-eventer is an open source tool maintained by ACK for the offline processing of Kubernetes events. It pushes cluster events to external systems, such as DingTalk, SLS, and EventBridge. It also provides filter conditions for different event levels to enable real-time collection, targeted alerting, and asynchronous archiving. For more information, see kube-eventer.
Prerequisites
A Kubernetes cluster, such as an ACK cluster or an ACK Serverless cluster, is created.
Billing
K8s Event Center is free of charge if the following conditions are met:
-
The data retention period for the Logstore associated with the K8s Event Center is 90 days (the default value).
-
The volume of data written to the K8s Event Center is less than 256 MB per day (approximately 250,000 events).
Examples:
-
If you use the default 90-day retention period and your K8s cluster generates 1,000 events per day, your use of K8s Event Center is free.
-
If you change the retention period to 105 days and your K8s cluster generates 1,000 events per day, you will incur Logstore storage fees after the initial 90-day period. The billable item is Storage Space - Log Storage. For more information about this billable item, see Billable items of the pay-by-feature billing model.
Step 1: Deploy kube-eventer and node-problem-detector
Alibaba Cloud Kubernetes
For an ACK cluster, the ack-node-problem-detector component already integrates the functionalities of eventer and node-problem-detector. You only need to deploy this component. For more information, see Event monitoring. For an ACK Serverless cluster, you must deploy the kube-eventer component.
NPD detects node problems or faults based on configurations and third-party plug-ins and then generates corresponding cluster events. The Kubernetes cluster also generates various events due to state transitions, such as pod evictions and image pull failures. The Kubernetes Event Center of Simple Log Service (SLS) aggregates all Kubernetes events in real time and provides storage, query, analysis, visualization, and alerting capabilities. The following steps describe how to send cluster events to the Kubernetes Event Center of SLS:
If you selected Install node-problem-detector and Create Event Center when you created the cluster, proceed to Step 2 to view the Kubernetes Event Center. For more information about how to install the NPD component during cluster creation, see Create an ACK managed cluster.
If you did not select Install node-problem-detector and Create Event Center when you created the cluster, you can install it manually.
Log on to the ACK console. In the left navigation pane, click Clusters.
On the Clusters page, click the name of the target cluster. In the left navigation pane, choose .
On the Log and Monitoring tab, find and install ack-node-problem-detector.
Other Kubernetes
-
Deploy kube-eventer.
-
Install the kubectl tool. For more information, see Obtain a kubeconfig file and connect to a cluster by using kubectl.
-
Create a file named eventer.yaml with the following content:
apiVersion: apps/v1 kind: Deployment metadata: labels: name: kube-eventer name: kube-eventer namespace: kube-system spec: replicas: 1 selector: matchLabels: app: kube-eventer template: metadata: labels: app: kube-eventer annotations: scheduler.alpha.kubernetes.io/critical-pod: '' spec: dnsPolicy: ClusterFirstWithHostNet serviceAccount: kube-eventer containers: - image: registry.cn-hangzhou.aliyuncs.com/acs/kube-eventer:v1.2.5-cc7ec54-aliyun name: kube-eventer command: - "/kube-eventer" - "--source=kubernetes:https://kubernetes.default" ## .send to sls ## --sink=sls:https://{endpoint}?project={project}&logStore=k8s-event®ionId={region-id}&internal=false&accessKeyId={accessKeyId}&accessKeySecret={accessKeySecret} - --sink=sls:https://cn-beijing.log.aliyuncs.com?project=k8s-xxxx&logStore=k8s-event®ionId=cn-beijing&internal=false&accessKeyId=xxx&accessKeySecret=xxx env: # If TZ is assigned, set the TZ value as the time zone - name: TZ value: "Asia/Shanghai" volumeMounts: - name: localtime mountPath: /etc/localtime readOnly: true - name: zoneinfo mountPath: /usr/share/zoneinfo readOnly: true resources: requests: cpu: 10m memory: 50Mi limits: cpu: 500m memory: 250Mi volumes: - name: localtime hostPath: path: /etc/localtime - name: zoneinfo hostPath: path: /usr/share/zoneinfo --- apiVersion: rbac.authorization.k8s.io/v1 kind: ClusterRole metadata: name: kube-eventer rules: - apiGroups: - "" resources: - events verbs: - get - list - watch --- apiVersion: rbac.authorization.k8s.io/v1 kind: ClusterRoleBinding metadata: name: kube-eventer roleRef: apiGroup: rbac.authorization.k8s.io kind: ClusterRole name: kube-eventer subjects: - kind: ServiceAccount name: kube-eventer namespace: kube-system --- apiVersion: v1 kind: ServiceAccount metadata: name: kube-eventer namespace: kube-systemParameter
Type
Required
Description
endpoint
string
Yes
The endpoint of Simple Log Service. For more information, see Endpoints.
project
string
Yes
The project in Simple Log Service.
logStore
string
Yes
The Logstore in Simple Log Service. Note that the parameter is named
logStorein the YAML file.internal
string
Required for self-managed Kubernetes.
Specifies whether to use an internal endpoint. Set this parameter to false for self-managed Kubernetes clusters.
regionId
string
Required for self-managed Kubernetes.
The ID of the region where the Simple Log Service project resides. For more information, see Endpoints.
accessKeyId
string
Required for self-managed Kubernetes.
The AccessKey ID. We recommend that you use the AccessKey pair of a RAM user. For more information, see AccessKey pair.
accessKeySecret
string
Required for self-managed Kubernetes.
The AccessKey secret. We recommend that you use the AccessKey pair of a RAM user. For more information, see AccessKey pair.
-
Run the following command to apply the configuration in eventer.yaml to the cluster:
kubectl apply -f eventer.yamlExpected output:
deployment.apps/kube-eventer created
clusterrole.rbac.authorization.k8s.io/kube-eventer created
clusterrolebinding.rbac.authorization.k8s.io/kube-eventer created
serviceaccount/kube-eventer created
-
-
Deploy node-problem-detector.
For more information, see node-problem-detector on GitHub.
Step 2: Create a K8s Event Center instance
After you create a K8s Event Center, Simple Log Service automatically creates a Logstore named k8s-event in the target project, along with associated dashboards.
-
Log on to the Simple Log Service console.
-
In the Log Application section, on the Intelligent O&M tab, click K8s Event Center.
-
On the Event Center Management page, click Add in the upper-right corner.
-
In the Create Event Center panel, configure the parameters and then click Next.
-
If you select Select Existing Project, select an existing project from the Project drop-down list to manage K8s Event Center resources, such as the Logstore and dashboards.
-
If you select Select Kubernetes Cluster from Container Service for Kubernetes, select an existing K8s cluster from the K8s Cluster drop-down list. With this method, Simple Log Service creates a project named
k8s-log-{cluster-id}by default to manage K8s Event Center resources.
-
Step 3: Use the K8s Event Center instance
After you create a K8s Event Center and deploy the eventer and NPD components, you can view event statistics, query event details, view Pod lifecycles, view node events, view core component events, configure alerts, run custom queries, and update versions in the K8s Event Center.
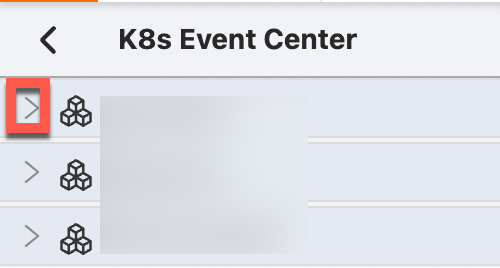
On the K8s Event Center page, find the target K8s Event Center instance and click the  icon to perform the following operations.
|
Actions |
Description |
|
View event overview |
The Event Overview page displays summary statistics for core events, such as the total event count, a comparison of today's error events with yesterday's, alert statistics, error event trends, and Pod OOM details. Note
Currently, Pod OOM information cannot be pinpointed to a specific Pod. It can only identify the node, process name, and process ID where the event occurred. You can use a custom query to find Pod restart events around the time of the OOM event to locate the specific Pod. |
|
Query event details |
The Event Details page displays detailed information for events filtered by various dimensions, such as event type, event object, host, Namespace, and name. |
|
View the Pod lifecycle |
The Pod Lifecycle page graphically displays event information throughout a Pod's entire lifecycle. You can also filter for important Pod events by event level. |
|
View node events |
The Node Event page displays details of node events, such as the node lifecycle and event list. |
|
View core component events |
The Core Component Events page displays details of core component events, such as ECS restart failures or URL mode not implemented. |
|
Configure alerts |
The Alert Configuration page allows you to set up alerts for your K8s Event Center. For more information, see Configure alerts. |
|
Custom Query |
The Custom Query page allows you to write and execute your own query and analysis statements. All events in a K8s Event Center are stored in a Logstore. You can use all features of the Logstore, such as custom queries, event consumption, custom reports, and custom alerts. For more information, see Quick start for search and analysis. To access the project that contains the K8s Event Center, you can find the project name in one of the following ways:
|
|
Update version |
The Version Update page allows you to upgrade the version of your K8s Event Center. |
Delete a K8s Event Center instance
On the page, find the instance you want to delete and click the  icon in the Actions column.
Log sample
The following is a sample of a collected log:
hostname:  cn-hangzhou.i-***********"
level:  Normal
pod_id:  2a360760-****
pod_name:  logtail-ds-blkkr
event_id:  {
   "metadata":{
      "name":"logtail-ds-blkkr.157b7cc90de7e192",
      "namespace":"kube-system",
      "selfLink":"/api/v1/namespaces/kube-system/events/logtail-ds-blkkr.157b7cc90de7e192",
      "uid":"2aaf75ab-****",
      "resourceVersion":"6129169",
      "creationTimestamp":"2019-01-20T07:08:19Z"
   },
   "involvedObject":{
      "kind":"Pod",
      "namespace":"kube-system",
      "name":"logtail-ds-blkkr",
      "uid":"2a360760-****",
      "apiVersion":"v1",
      "resourceVersion":"6129161",
      "fieldPath":"spec.containers{logtail}"
   },
   "reason":"Started",
   "message":"Started container",
   "source":{
      "component":"kubelet",
      "host":"cn-hangzhou.i-***********"
   },
   "firstTimestamp":"2019-01-20T07:08:19Z",
   "lastTimestamp":"2019-01-20T07:08:19Z",
   "count":1,
   "type":"Normal",
   "eventTime":null,
   "reportingComponent":"",
   "reportingInstance":""
}|
Field |
Type |
Description |
|
hostname |
string |
The hostname where the event occurred. |
|
level |
string |
The event level. Valid values: Normal and Warning. |
|
pod_id |
string |
The unique ID of the Pod. This field exists only when the event is related to a Pod. |
|
pod_name |
string |
The name of the Pod. This field exists only when the event is related to a Pod. |
|
event_id |
json |
The detailed content of the event. The value of this field is a JSON string. |
FAQ
No data in K8s Event Center
After you deploy a K8s Event Center, newly generated events are automatically collected. You can search for them on the Custom Query page. We recommend setting the time range in the upper-right corner to 1 Day. If no data appears, check for the following possible reasons:
-
No new events have been generated in the K8s cluster since you deployed the K8s Event Center.
You can run the
kubectl get events --all-namespacescommand to check for new events in the cluster. -
The parameters were configured incorrectly when you deployed the eventer and node-problem-detector components.
-
If you are using an ACK cluster, follow these steps:
-
Log on to the ACK console.
-
On the Clusters page, click the target cluster.
-
In the left-side navigation pane, choose .
-
On the Helm page, find ack-node-problem-detector and click Update.
-
Check and modify the parameter configuration. For more information, see Step 1: Deploy kube-eventer and node-problem-detector.
-
-
If you are using a self-managed Kubernetes cluster, see Collect Kubernetes events for parameter configuration.
-
View event container logs
-
If you are using an ACK cluster, follow these steps:
-
Log on to the ACK console.
-
On the Clusters page, click the target cluster.
-
In the left-side navigation pane, choose .
-
Set Namespace to kube-system.
-
In the Pods list, find the target Pod and click Logs.
-
-
If you are using a self-managed Kubernetes cluster, view the logs of the Pod prefixed with
eventer-slsin the kube-system Namespace.