By Daole, a Wireless Development Expert, and Xinlv, a Test and Development Engineer at Alibaba Digital Media & Entertainment Group
Released by AliENT
Video apps are the main consumers of mobile network traffic. Compared with the user experience of other apps, video apps depend more on network environments. The core video experience indicators, such as the success rate, stalling rate, and the HD proportion of video playback, are related to product performance in network environments.
We can find some practices of network analysis and environmental profiling on the market. For example, the popular mobile game "King of Glory" supports the measurement of network quality. This game gives users visual measurement results using the latency of the current router, community, and public network to describe the current network status. For example, a 500 kbps network speed limit is used to simulate the bus model, and a packet loss rate of 20% is used to simulate the subway model. The importance of network profiling can be summarized as personalization and differentiated decision-making. Network environments vary greatly with video viewers. This difference can be summarized in two aspects:
To evaluate the network during playback, a common method is to estimate the download speed of video fragments or the rate at which the player buffer drops. To be sure, the download speed and the buffer drop rate can reflect the end-to-end performance of the playback process. In engineering practices, we expect to grasp information on more dimensions to adopt different playback policies. For example, we can switch the playback link to the standby Content Delivery Network (CDN) if a fault at the CDN side leads to a sudden decrease in the download speed of video fragments. If a user's Local Area Network (LAN) bandwidth is congested, we can play the video stream with a lower bitrate by switching the smart gear. After we perceive the network changes during video playback and analyze the causes of download speed changes, we can take appropriate measures to improve the playback experience.
The network for video playback on the user terminal is shown in Figure 1. From the perspective of network topologies, the main factors that influence the playback and download speeds of videos are user devices, LANs, public networks, and CDNs. Signal strength is the main parameter to determine how much user devices influence network quality. The network quality in a LAN reflects the data distribution capabilities of gateways. Quantitative indicators in this regard include the data latency, packet loss rate, and network channel congestion between devices and gateways. Public network quality indicates the quality of random network requests initiated by devices. Indicators in this regard include the latency and packet loss rate of network requests related to random addresses. The CDN factor here is about whether the quality and scheduling policy of CDNs are normal. Quantitative indicators include the download speed, Transmission Control Protocol (TCP) latency, and packet loss rate of playback fragments to be downloaded.
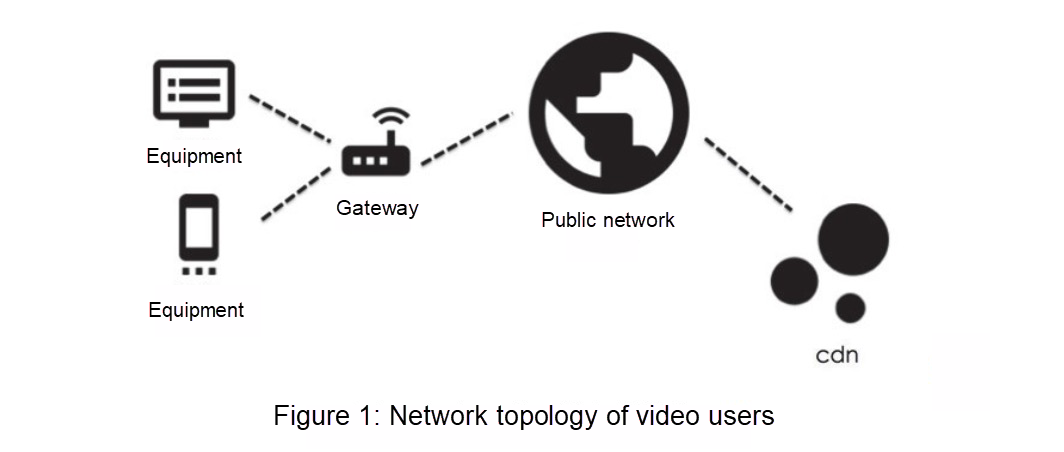
Indicators related to user devices, LANs, public networks, and CDNs come from different sources and have different data dimensions. Therefore, we need to cleanse the indicator data and find its ability to characterize the network speed through statistical feature analysis. Figure 2 shows the method of extracting statistical features from the original time series data:
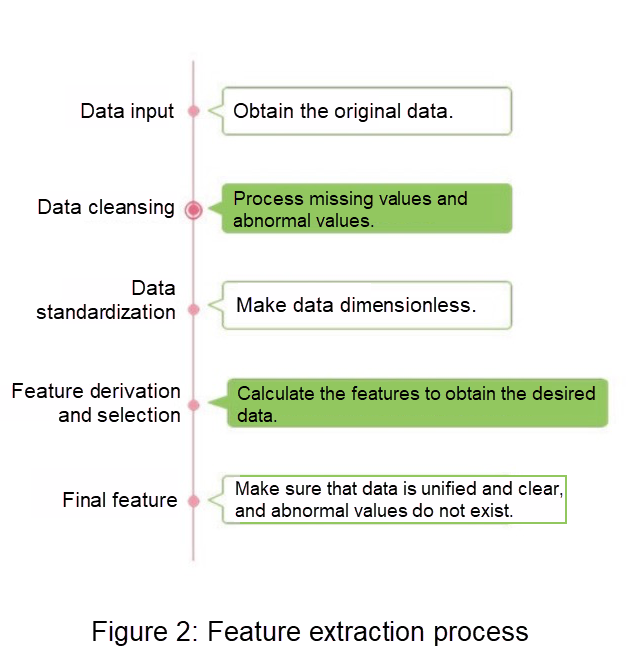
To select features with a higher correlation with the check result, we can verify correlation. For example, we use the Pearson correlation coefficient to verify the correlation between variables. For the features obtained through data cleansing, standardization, and selection, their differentiation needs to be proved by corresponding clustering algorithms. We can observe related data through the scatter and density charts below:
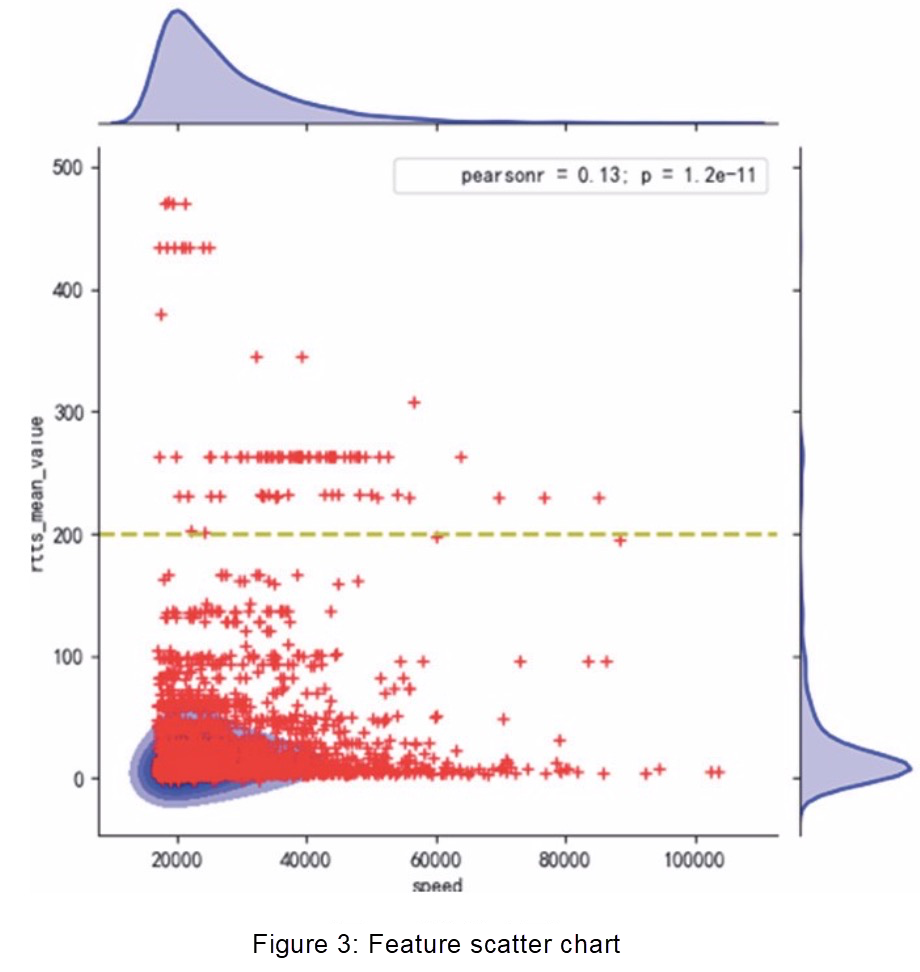
Figure 3 is a scatter chart of the gateway latency and average network speed of some users. In the figure, the horizontal axis indicates the average network speed in kbps. The vertical axis indicates the average gateway latency (unit: ms) collected each time, and each red dot represents a piece of data. Unlike the traditional scatter chart, Figure 3 involves the calculation of the scatter density distribution. The blue area denotes a density area. The darker color represents greater density. The figure also contains the boundary distribution maps of data distribution on the right vertical axis and the top horizontal axis. This figure shows the distribution of some data by converting the data into visual images. The figure gives the following information:
Network quality analysis provides multi-dimensional results, which accurately explain the causes of network faults. For different types of problems, the application of corresponding strategies can achieve the desired results. Table 1 lists the policies for different types of weak networks.
Table 1: A list of policies for weak networks
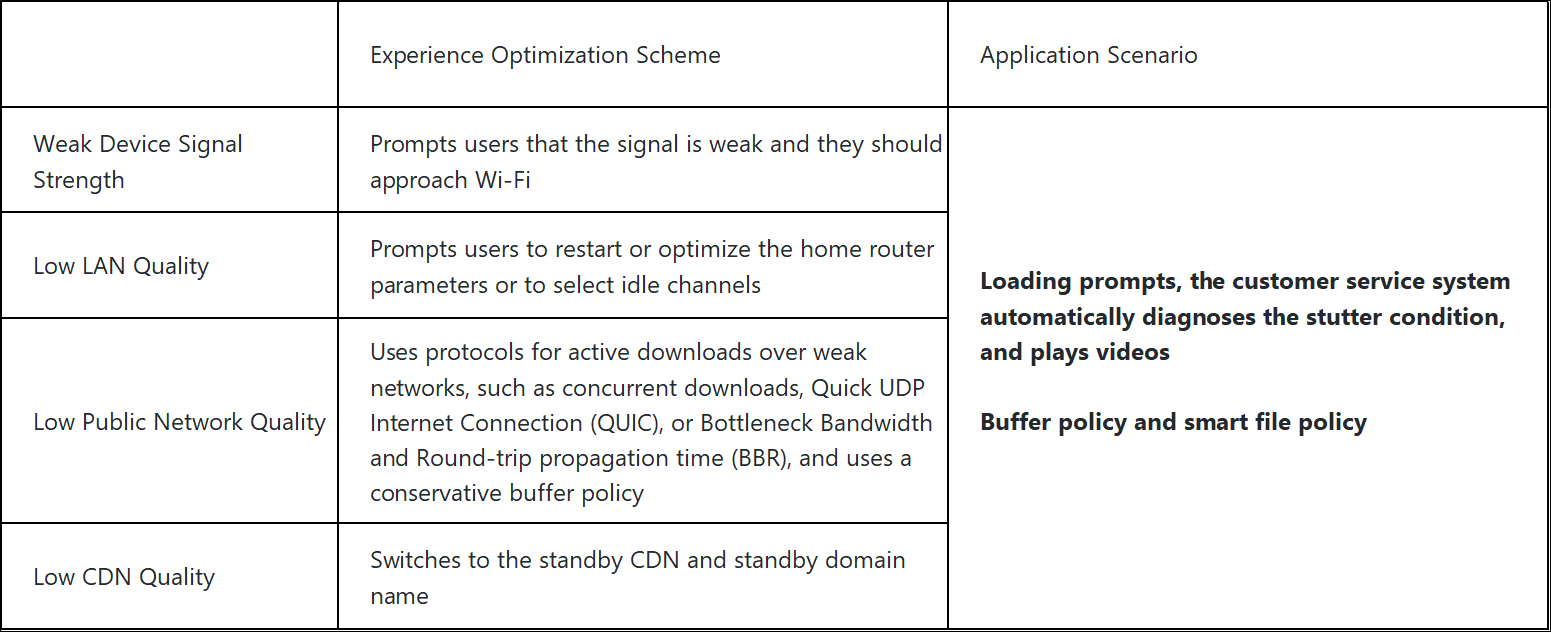
In the case of a weak network buffer, if the signal latency or LAN latency is high, as shown in Figure 4, users will be reminded on the buffer page to guide themselves to perform related optimization. The stutter measurement result of the customer service system also gives corresponding prompts.

If the quality of the public network is good, but the quality of the CDN is poor, according to the network measurement result, scheduling problems may occur. In that case, we can check the download link for correctness. For example, we can check whether CDN scheduling involves cross-province or cross-carrier aspects, whether the URL is hijacked, and whether CDN resources are sufficient and whether we need to enable a standby line.
If the network measurement result shows that the quality of both the public network and the CDN is poor, users are in poor network environments. In this situation, we will enable active download methods, such as concurrent downloads, QUIC, and BBR, to mitigate high latency and high packet loss rates. In addition, we will show users how to view videos in smart mode or at a lower bitrate.
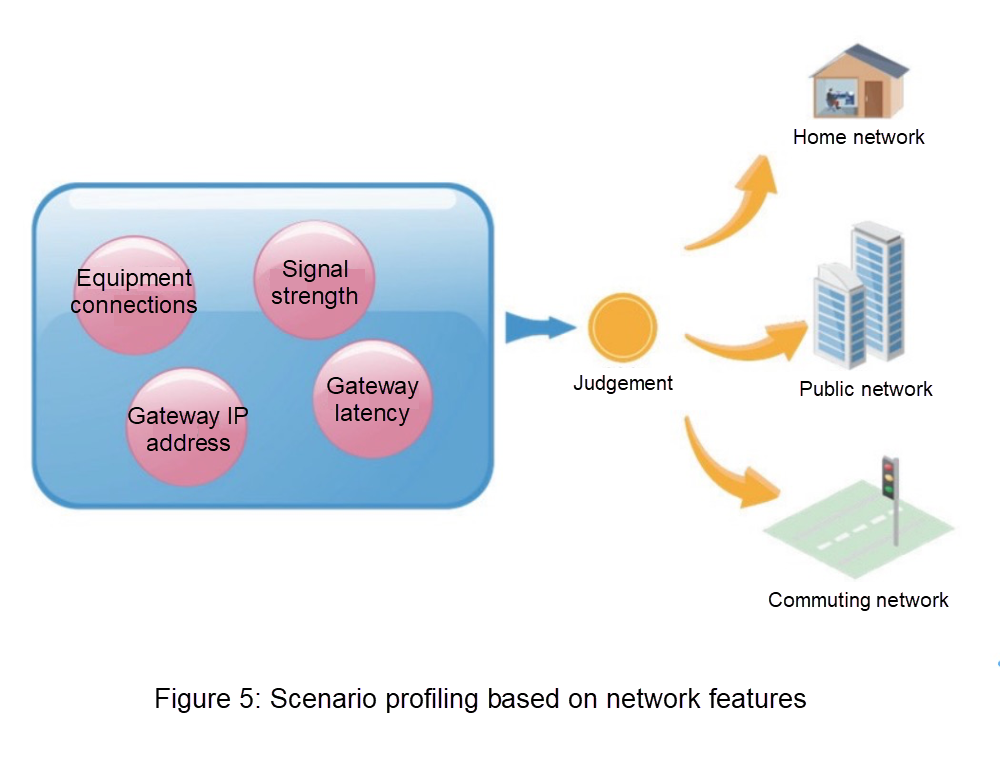
Data, such as gateway latency, gateway IP address, and signal strength, perform differently in different scenarios. For example, when home networks are stable along with lower gateway latency and fixed LAN connection devices, their gateway IP addresses have something in common. We comprehensively use the previous network indicators for analysis, feature extraction, and classification. This method can be applied to the identification of final user scenarios, as shown in Figure 5.
Alibaba Cloud RAM – Part 1: An Overview of Resource and Access Management

2,593 posts | 794 followers
FollowAlibaba Clouder - October 15, 2020
OpenAnolis - April 7, 2023
Alibaba Cloud Native Community - May 9, 2023
AlibabaCloud_Network - September 11, 2018
Alibaba Cloud Native Community - January 20, 2026
ApsaraDB - December 17, 2024

2,593 posts | 794 followers
Follow Quick BI
A new generation of business Intelligence services on the cloud
Learn More Accelerated Global Networking Solution for Distance Learning
Alibaba Cloud offers an accelerated global networking solution that makes distance learning just the same as in-class teaching.
Learn More Networking Overview
Connect your business globally with our stable network anytime anywhere.
Learn More CDN(Alibaba Cloud CDN)
A scalable and high-performance content delivery service for accelerated distribution of content to users across the globe
Learn MoreMore Posts by Alibaba Clouder