By Lv Biao, Senior Technical Expert at Alibaba Cloud

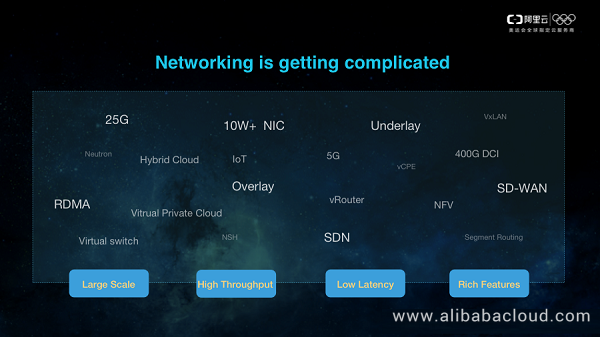
With its rapid development, Alibaba Cloud has expanded its business to 18 regions around the world and served more than 1 million customers. In addition, Alibaba Cloud also supports activities like the Singles' Day (Double 11) Shopping Festival. These activities pose great challenges to Alibaba Cloud's flexibility, dispatching capability, and stability. Behind the network service development is an increasingly complex network technology system, such as SDN. Now the entire Alibaba Cloud network has fully adopted SDN. All cloud network devices are managed and configured through services to northbound and southbound APIs, and the network itself is divided into Overlay and Underlay. Underlay mainly includes physical switches and routers, and Overlay provides users with elastic and flexible virtual network functions. We also have NFV, RDMA, SD- WAN, and so on. The entire network is getting more and more complex.
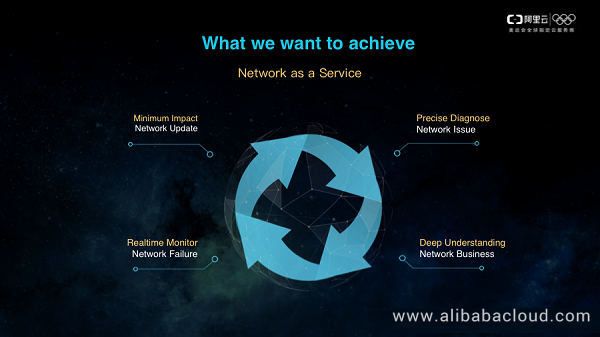
Although we have such a complex technical system and such a huge challenge, we still hope that our network can be more stable, simpler and easier to use. We hope that each network upgrade is not perceived by users, and that we can find problems earlier than users do when they occur on devices, and pinpoint the causes of these problems. Finally, we hope that we have a rich and multi-dimensional understanding of the network, which is very helpful for both ourselves and our users in the O&M of the network. For Network as a Service, we hope our network is like a simple and flexible service, which can be used anytime as needed.
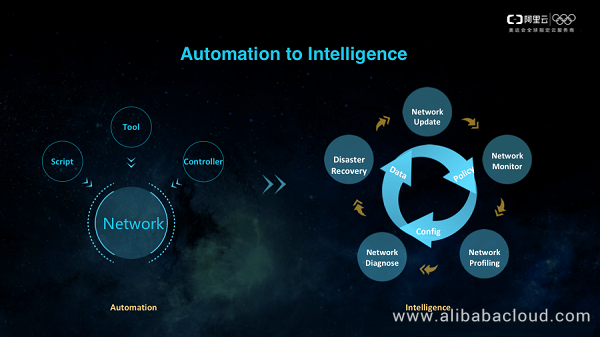
How can we keep the network simple and efficient despite the continuous growth? Automation is definitely necessary, but on the basis of automation, we hope that the system can take on more things, make decisions in a closed loop, and reduce human intervention throughout the network lifecycle, leaving another system instead of users and network operations personnel to interact with the controller. How do our users and network operations personnel make decisions? They rely on data. Decisions are made based on the data and their judgments, so the data is the last part of this closed loop. The figure on the right is our current vision. The system automatically generates policies based on the data generated during various network operations. These policies are submitted to the controller for the configuration and management of the network, and new data will be generated during network operations. In this system, we complete the closed loop of multiple scenarios such as network updates, network monitoring, network profiling, network diagnosis, and disaster recovery.
Based on this idea, we have designed and implemented a network analytics platform, and give this platform a metaphorical name, QiTian, hoping to see our entire network from the perspective of the sky.
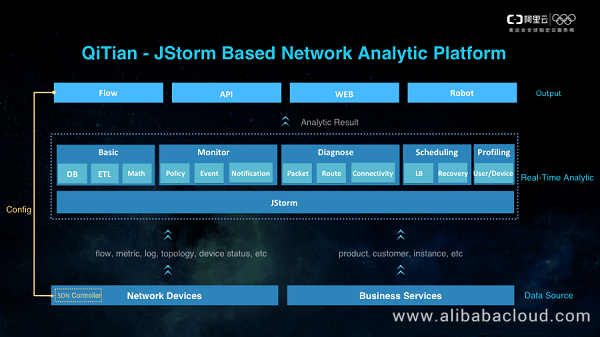
The entire platform can be divided into three layers. The bottom layer is the Data Source layer, which includes various data collected from network devices and business services. In the middle is the Real-Time Analytics layer. From left to right, the first is our basic data analytics module, including DB data cleansing, ETL, and general mathematical calculations. Basic data analytics is the premise of all data analytics functions on the right. It converts original data to standard-format data. The second is our network monitoring and analysis module, which is used to detect suspicious exceptions on the network. It is divided into three parts, namely, monitoring policies, network events, and exception notifications. These parts respectively consume basic data, primary network exceptions, and fusion network events, and finally generate suspicious event records and alerts. The third is our network diagnosis module, which is used to locate the cause of a specific problem if any. It can be used to process and analyze each data message, compute the traffic path of the message, and locate the network device where a problem occurs in the path and the specific cause of the problem. The fourth is our network scheduling module. The most important part of network scheduling is to use the traffic scheduling policy for troubleshooting. The last is our network profiling module, which is used for the planning and scheduling of our network resources, as well as for the accounting of product costs and revenue. The entire Real-Time Analytics layer is based on the JStorm engine. It is not a stand-alone application, but a collection of multiple JStorm tasks.
At the top is our Output layer, which is responsible for streaming data output, and supports API data extraction. These two functions are mainly for connecting to other systems. For example, our SDN controller consumes the policy data generated by QiTian to manage and configure network devices, but what our R&D and after-sales personnel need is visualized data. The last thing is a DingTalk robot that we have developed. You can ask the robot about the alarm status of a recent cluster, or the operation of a user instance. This robot also has a nice name, DaSheng, and it becomes QiTianDaSheng (Great Sage Equal of Heaven) by concatenating the name of our platform. Next, we will go deep into the whole platform from bottom to top, from data source to analysis performance, real-time monitoring, network diagnosis, intelligent scheduling, and multi-dimensional network profiling.
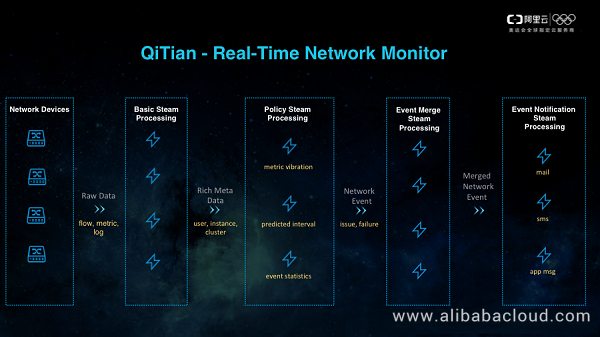
QiTian's entire monitoring system is based on JStorm's stream computing engine. Let's see how the entire system works from the perspective of data flow. On the far left is the network device. The raw data that it collects is transformed into multi-dimensional information and network traffic flow data through some basic ETL and aggregate operations. This data will be consumed by a monitoring policy task called JStorm Topology. The monitoring policy task contains a variety of monitoring policies, each of which will identify exceptions from a different dimension. Currently, three policies are supported: indicator volatility, range prediction, and event statistics. What follows policies is a JStorm task called event merging. The role of this task is to merge various events generated by the policy task based on users and dimensions of the network topology. The last part of real-time monitoring is the notification center. It sends notifications in different manners based on the type and the severity of network events. Currently, it supports email, SMS, application messages, and so on. Each notification will clearly describe the time and scope of the problem, so as to help R&D personnel to make judgments.
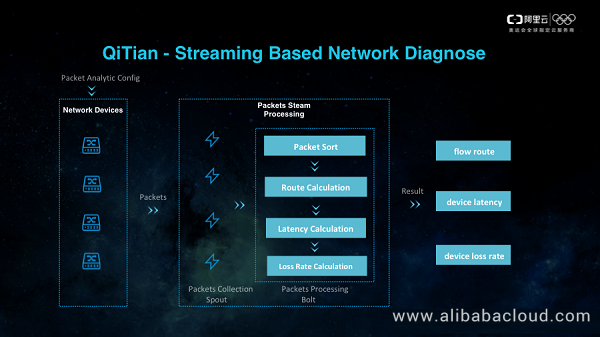
Next, we will see how QiTian diagnoses the network based on stream computing. When a user's traffic is abnormal, we used to locate the exception by means of packet capture or traceroute, but such methods are inefficient and difficult to work on the overlay network. Therefore, our network devices use the message dyeing method to collect the dyed messages into the SLS log, then use the JStorm task to analyze the messages, and finally locate the cause of the problem.
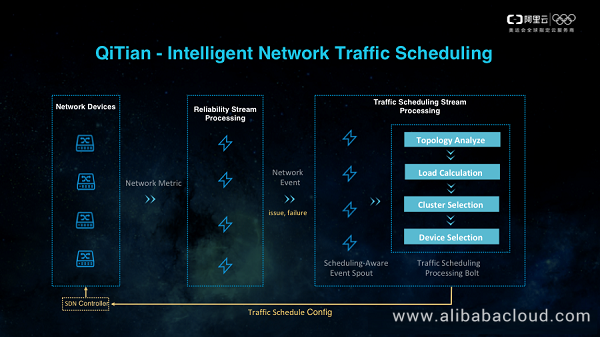
How to recover a problematic network is what our next system needs to do. The current network problems are mainly caused by exceptions in virtual machines on the server and our distributed virtual gateway. When an exception occurs in the former, we need to quickly locate the target server to which it can be migrated, and then quickly migrate the virtual machine. When an exception occurs in the latter, we need to quickly locate a new virtual gateway group to which traffic can be directed. The migration of virtual machines is a comprehensive evaluation system. For a network, we will provide optional switches and servers to the virtual machine scheduling system for decision making. The traffic migration of the virtual gateway is the logic of the internal closed loop of the network.
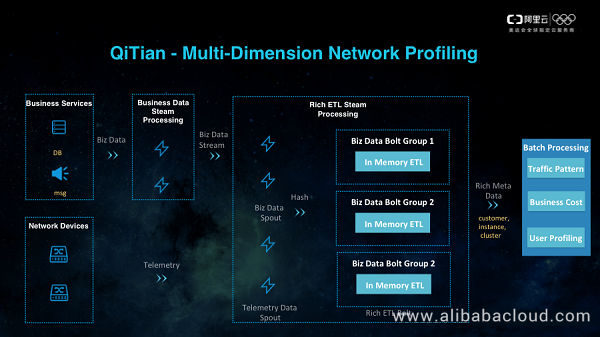
The last part is multi-dimensional network profiling. It actually has two portions, one is real-time computation, which is done on JStorm, and the other is offline computing. We carry out multi-dimensional network profiling based on some offline analysis tasks developed with MaxCompute. Network profiling is an important means for our network product operations. In this platform, we combine product sales, resource consumption, actual cost, and user profiling to help us make operational decisions for each product. For example, we can analyze a user's resource deployment, and understand our and operators' direct network cost usage.
Services currently provided by the QiTian platform are described above. We will evolve our intelligent analysis, make us understand the situation more quickly, locate the cause more accurately, and schedule traffic more intelligently. This will make Alibaba Cloud's network smarter and more efficient and help us achieve our mission of making network simpler.
The LinuxCon + ContainerCon + CloudOpen China 2018 (LC3) open source summit hosted by the Linux Foundation, a world-renowned open source community, opened in Beijing on June 25, 2018. This year, Alibaba Cloud attended this conference as a platinum partner. Three technical experts from the Alibaba Cloud network team shared their experience in their field of expertise including the optimization of open-source platforms and the application of network big data.

19 posts | 11 followers
FollowAlibaba Clouder - December 2, 2020
Alibaba Cloud MaxCompute - April 25, 2019
Alibaba Cloud Community - October 19, 2021
OpenAnolis - September 21, 2022
Alibaba Clouder - June 22, 2020
Alibaba Cloud MaxCompute - January 21, 2022

19 posts | 11 followers
Follow Accelerated Global Networking Solution for Distance Learning
Alibaba Cloud offers an accelerated global networking solution that makes distance learning just the same as in-class teaching.
Learn More Networking Overview
Connect your business globally with our stable network anytime anywhere.
Learn More Managed Service for Prometheus
Multi-source metrics are aggregated to monitor the status of your business and services in real time.
Learn More Edge Network Acceleration
Establish high-speed dedicated networks for enterprises quickly
Learn MoreMore Posts by AlibabaCloud_Network