11.11 The Biggest Deals of the Year. 40% OFF on selected cloud servers with a free 100 GB data transfer! Click here to learn more.
A database monitoring system plays a critical role in assisting DBAs, O&M personnel, and service development personnel to diagnose, troubleshoot, and analyze problems with a database. The quality of a monitoring system also dramatically influences the system's ability to accurately locate faults, the system's ability to solve the problem correctly, and the system's ability to avoid subsequent faults. Monitoring granularity, indicator integrity, and real-time performance are three essential factors for accurately evaluating a monitoring system. Many database services such as Alibaba Cloud's ApsaraDB for MongoDB provides users with a monitoring system for the aforementioned purposes.
Regarding monitoring granularity, many existing systems can only perform minute-level monitoring or half-minute-level monitoring. In the current high-speed software environment, such a level of granularity's performance is increasingly unsatisfactory. These systems are helpless for some exceptions that can erupt at the moment. Due to the increase in monitoring granularity, the ever-increasing amount of data and significantly reduced acquisition frequency will be an excellent challenge for resource consumption.
Regarding monitoring indicators integrity, most existing systems use the predefined indicators for acquisition. There is a huge drawback with this method: if a particular indicator gets ignored because its importance does not get realized at the beginning, and this indicator turns out to be a given failure's key indicator, then that failure is very likely to become untraceable. Concerning the real-time performance monitoring - "no one cares whether it is good or bad in the past, they only care about the present."
A system with just one of the above three capabilities being good can be regarded as a good monitor system. Alibaba Cloud's ApsaraDB for MongoDB second-level monitor system inspector has been able to achieve an exact second-level granularity of 1 point per second, enabling full indicator acquisition without missing data. It even allows automatic acquisition and real-time data display for those indicators that have not previously appeared. The monitoring granularity of 1 point per second makes any jitter in the database traceable; full indicator acquisition provides DBA comprehensive and complete information; and real-time data display allow users to know the occurrence of failure from the first time, and the recovery of the failure from the first time.
Today, we will talk about using the second-level monitor system inspector to troubleshoot when encountering database access timeout on ApsaraDB for MongoDB:
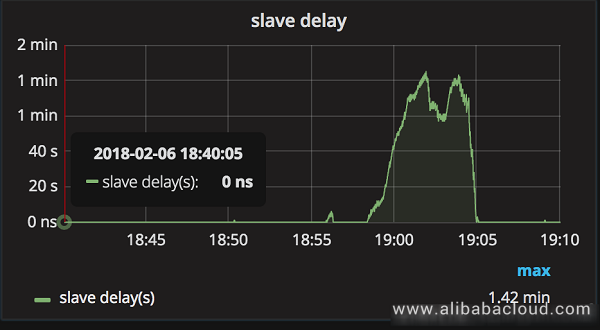
Previously there was an online service using the MongoDB replica set with the read/write splitting getting performed on the service end. Suddenly one day, the service experienced a large number of online read traffic timeouts. Through Inspector, we can see that the delay in the slave database was abnormally high at the time.

The high delay in the slave database indicated that the slave database operation log's replay thread speed could not catch up with the master database's write speed. With the consistent master-slave configuration, if the response speed of the slave database is slower than that of the master database, it indicates that—in addition to the regular service operations—the slave database is performing some high-consumption operations.
After troubleshooting, we found that the cache usage in the database was high:

From the monitoring system, we can see that the cache usage quickly rose from about 80% to the evict trigger line of 95%, and at the same time, the dirty cache also climbed up to reach the evict trigger line for the dirty cache.
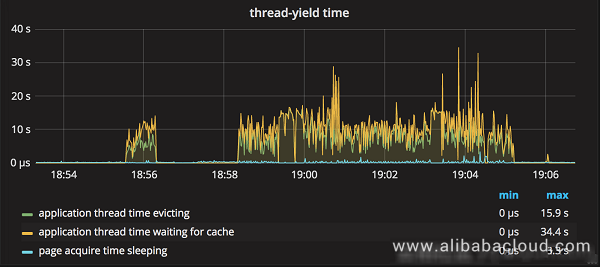
For the wiredTiger engine, when the cache usage reaches the trigger line, wiredTiger considers that the evict thread is unable to evict the page. It will then make the user thread join the evict operation, after which it will cause a large number of timeouts. This idea can also get confirmed by the application evict time indicator:

From the above figure, we derive that the user thread spent a lot of time to evict, and then caused a large number of timeouts for regular access requests.
After troubleshooting on the service end, there were a large number of data migration jobs that caused the cache to be full. Therefore, after restricting the migration job and increasing the cache, the overall database operations began to be stabilized.
One day, an online service using sharding cluster suddenly experienced a wave of access timeout errors, and, after a short time, quickly recovered. Judging by experience, it is very likely that there were some lock operations ongoing at that time and these were what led to the access timeouts.
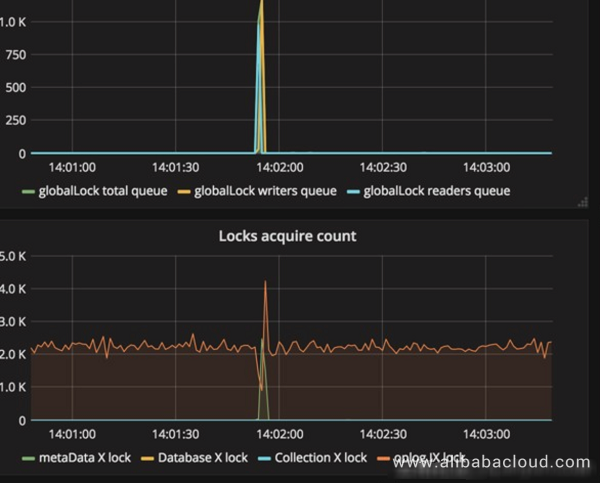
Through Inspector, at the time of failure, we found that the lock queue on a shard is very high:

It confirmed our previous conjecture that the lock was what was causing access timeouts. Precisely what operations caused the lock queue to soar?
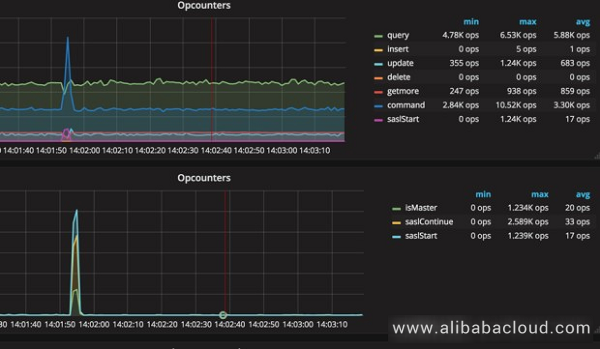
Soon enough, through the troubleshooting the commands at the time, we found that the authentication commands on the shard had suddenly soared:

Through viewing the code, we found that although Mongos and MongoDB use the key file for authentication, it gets authenticated by the scram protocol sasl command and that there is a global lock when authenticating; instantaneously receiving a significant amount of authentication leads will lead to global lock queue soars which then causes access timeouts.

As a result, we decreased the number of connections for small clients to reduce this sudden rise in authentication that creates global locks and causes timeouts.
From the two cases mentioned above, we can see that the fine enough monitoring granularity and comprehensive adequately monitoring indicators are essential for troubleshooting, and the real-time performance is instrumental in the scenario of monitoring well.
Second-level monitoring has been enabled in the Alibaba Cloud MongoDB console. Users can enable monitoring by themselves to get the high-definition experience brought about by second-level monitoring.
To learn more about ApsaraDB for MongoDB, visit www.alibabacloud.com/product/apsaradb-for-mongodb
Improving Automotive Simulation Efficiency with Alibaba Cloud E-HPC

2,593 posts | 793 followers
FollowAlibaba Cloud Community - May 6, 2024
ApsaraDB - June 29, 2021
ApsaraDB - November 17, 2023
Alibaba Cloud Native - September 11, 2023
Data Geek - August 6, 2024
Alibaba Clouder - November 25, 2019

2,593 posts | 793 followers
Follow ApsaraDB for MongoDB
A secure, reliable, and elastically scalable cloud database service for automatic monitoring, backup, and recovery by time point
Learn More Tablestore
A fully managed NoSQL cloud database service that enables storage of massive amount of structured and semi-structured data
Learn More Data Transmission Service
Supports data migration and data synchronization between data engines, such as relational database, NoSQL and OLAP
Learn MoreMore Posts by Alibaba Clouder