By Taosu

SpringCloud is an ordered collection of frameworks. It uses the development convenience of Spring Boot to skillfully simplify the development of distributed system infrastructure, such as service discovery and registration, configuration center, message bus, load balancing, circuit breaker, and data monitoring, which can be started and deployed with one click in the development style of Spring Boot.
| SpringCloud (Microservice Solution) | Dubbo (Distributed Service Governance Framework) |
|---|---|
| Rest API (lightweight, flexible, swagger) | RPC remote calls (efficient, coupled) |
| Eureka and Nacos | Zookeeper |
| Ease of use | Good performance |
| SpringCloud 2.0 is coming soon | Restart in 2017 after a 5-year break |
Spring Boot is a Maven-based solution launched by Spring to solve the redundancy of traditional framework configuration files and complicated assembly components. It is designed to quickly build a single microservice. SpringCloud is dependent on Spring Boot, but Spring Boot is independent of SpringCloud. It can even be integrated with Dubbo for excellent development.
The microservices proposed by MartinFlower communicate with each other through RestFulApi. Implementations:
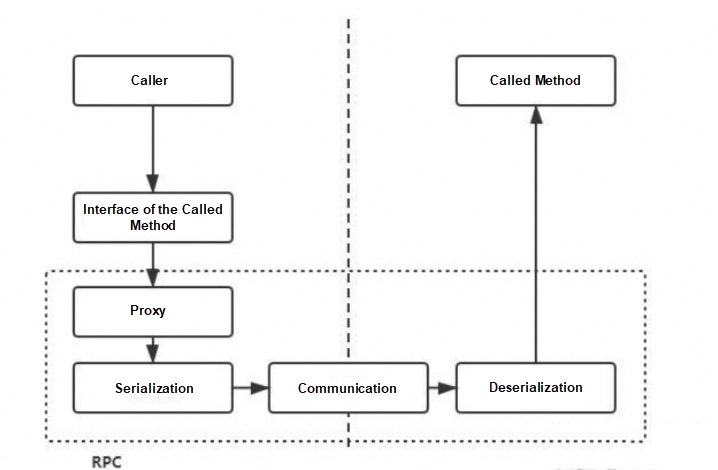
You can create a Spring application by performing simple steps on Spring Boot. Spring Boot provides the out-of-the-box feature for Spring to integrate third-party frameworks. The core idea of Spring Boot is convention over configuration.
Automatic assembly: Spring Boot initializes all configured beans based on certain rules. It reduces a lot of repeated work.
For example, when using MongoDB, you only need to add the Starter package of MongoDB, configure the connection information, and then you can directly use MongoTemplate automatic assembly to operate the database. It decreases the dependency on Maven Jar packages and reduces the probability of cumbersome configuration errors.
Embedded container: Spring Boot applications do not need to be deployed to external containers, such as Tomcat.
Applications can be directly compiled into an executable Jar package through the Maven command, and the package can be started through the java-jar command, which is very convenient.
Application monitoring: In Spring Boot, with the monitoring feature Actuator, you can monitor the internal operation of the program.
For example, bean loading, environment variables, log information, and thread information. Of course, you can also customize business-related monitoring and expose it through the endpoint information of the Actuator.
spring-boot-starter-web // It is used to quickly build Web projects based on Spring MVC. spring-boot-starter-data-redis // It is used to quickly integrate and operate Redis. spring-boot-starter-data-mongodb // It is used to integrate with MongoDB. spring-boot-starter-data-jpa // It is used to operate MySQL. Visualizing the data provided by the Actuator
The goal of GateWay is to replace Netflix Zuul. GateWay is developed based on technologies such as Spring 5.0, Spring Boot 2.0, and Web Flux. It provides centralized routing (reverse proxy) and basic gateway functions such as authentication, flow control, fusing, path rewriting, and log monitoring based on Filter (defining filters to filter requests and complete some functions).
pre-filters: Used for parameter verification, permission verification, traffic monitoring, log output, and protocol conversion.
post-filters: Used for response content, response header modification, log output, and traffic monitoring.
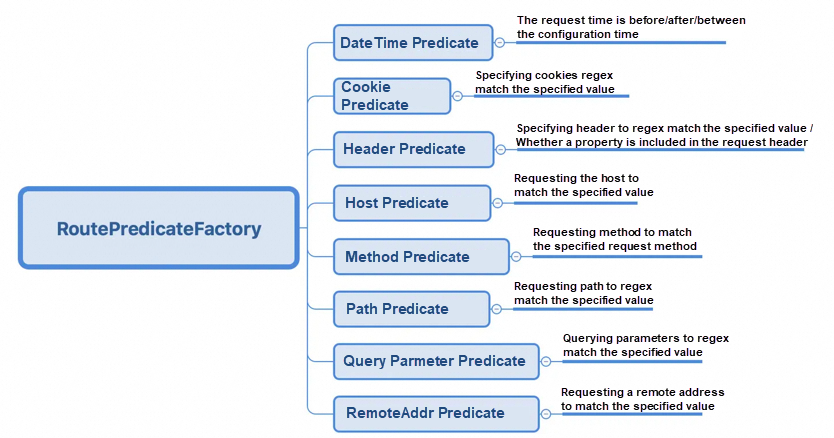
The GateWayFilter is used for a single route and the GlobalFilter is used for all routes.
The service registry is essentially to decouple service providers and service consumers. The number and distribution of microservice providers often change dynamically to support elastic scaling features.
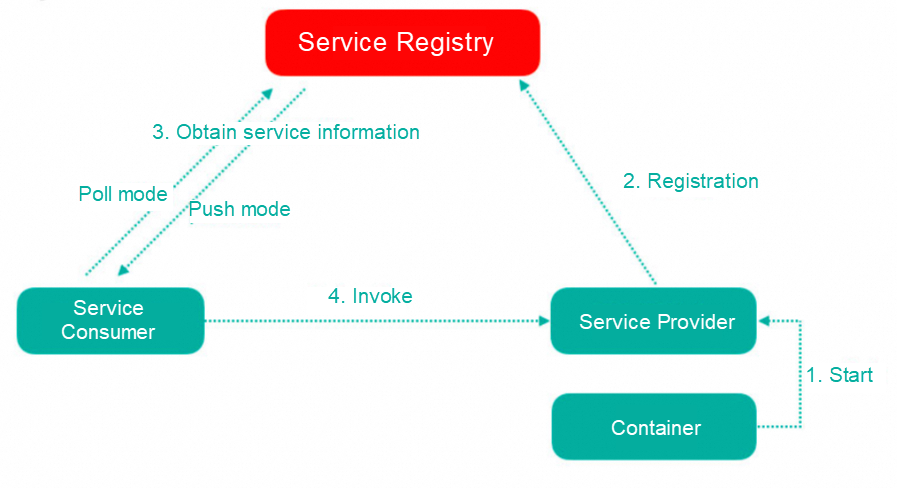
| Difference | Zookeeper | Eureka | Nacos |
|---|---|---|---|
| CAP | CP | AP | CP/AP switchover |
| Availability | Not available during the election | With a self-protection mechanism and data is not up-to-date | |
| Elements | Leader and followers | Node equality | |
| Advantages | Distributed coordination | Registration and discovery | Registry and configuration center |
| Underlying | Process | Service | JAR package |
Eureka uses mechanisms such as heartbeat detection, health check, and client caching to improve flexibility, scalability, and availability.
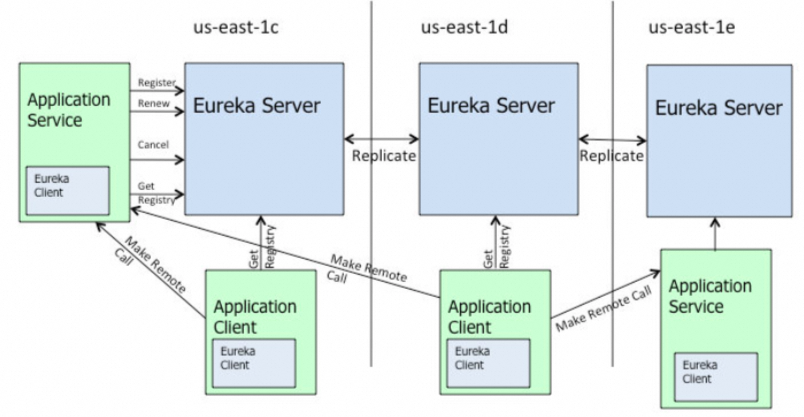
After a new service is launched, service consumers cannot immediately access the newly launched service. It takes some time before they can access it; or, after the service is offline, the service will still be called, and the service will be completely stopped after a period, which will lead to frequent errors in the early stage of the access.
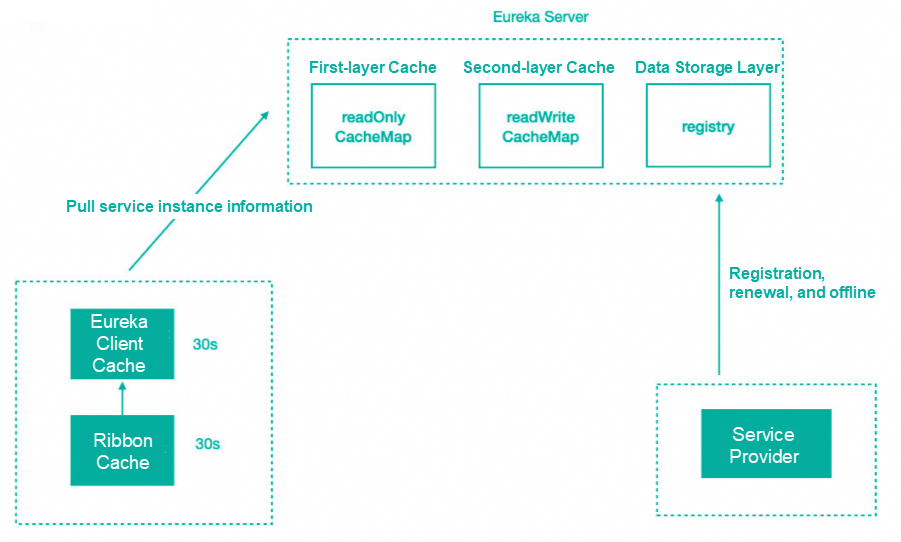
After the service is registered in the registry, the service instance information is stored in the registry table, that is, in the memory. However, Eureka has made internal optimization to improve the response speed, adding a two-layer cache structure to directly cache the instance information required by the client. When obtaining the information, you can take the data directly from the cache and respond to the client.
Eureka uses the two-level cache mechanism to improve the response speed of Eureka Server. The disadvantage is that the cache causes the client to fail to obtain the latest service instance information, and then causes the new service and the offline service not to be quickly discovered.
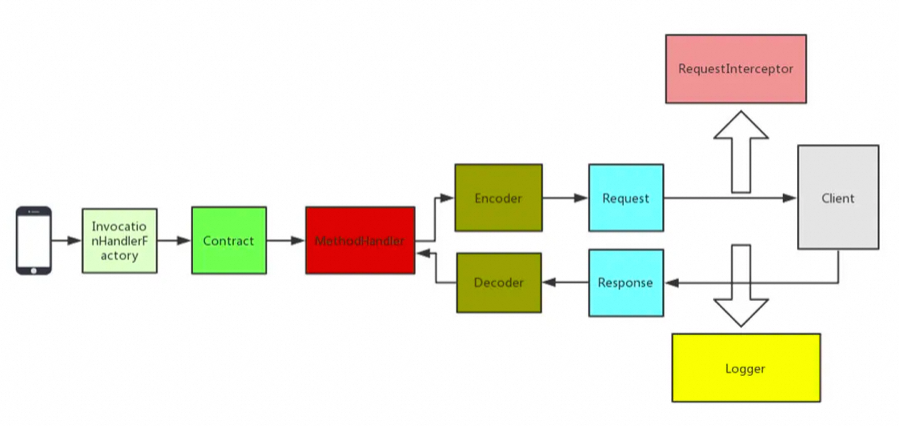
It uses the JDK dynamic proxy to generate proxy objects. When we call this interface, we are going to call the remote HTTP API.
For example, what is the request type? GET or POST? What is the URI of the request?
Through these components, we can encode and decode the requested information using the specified coding method and then transmit it.
It is responsible for recording logs in Feign. It specifies the Logger level and customizes the output of logs.
The component is responsible for HTTP request execution. The default Client in Feign initiates the request through the JDK HttpURLConnection. Every time a request is sent, a new HttpURLConnection link will be created. Therefore, the performance of Feign will be poor. You can extend this interface and use high-performance HTTP clients based on connection pools such as Apache HttpClient.
The component is responsible for retry. Feign has a built-in retry device. When an I/O exception occurs in an HTTP request, Feign limits the maximum number of retries.
You can add multiple interceptors to Feign to set some extended parameter information before the request is executed.
Best Use Tips for Feign
For example, you can add specified request header information, which can be used to pass certain information between services.
FULL outputs all complete request information.
The exception decoder can obtain the exception information instead of a simple code, and then convert it into the corresponding exception object to return.
In HystrixFeign.builder, you can see that the Builder inherits the Feign and adds the SetterFactory of Hystrix. In the build method, the invocationHandlerFactory is rewritten. A HystrixInvocationHandler is returned when you create, and the request is packaged as a HystrixCommand to execute when you invoke. Hystrix is naturally integrated here.
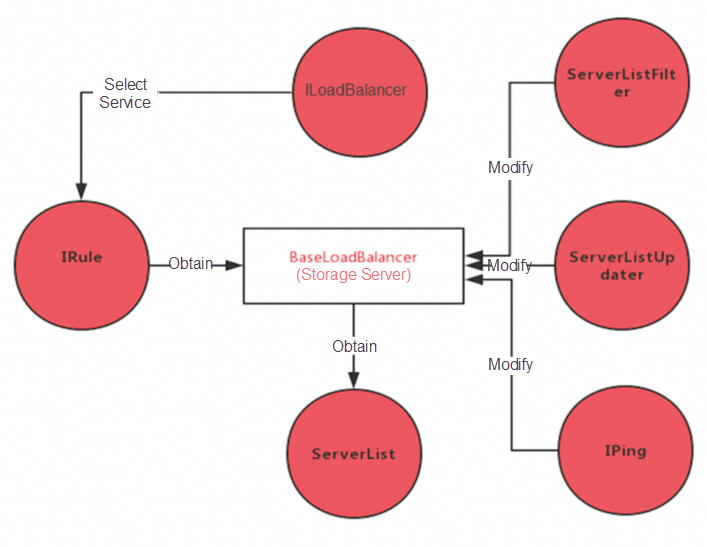
| Component | Description |
|---|---|
| LoadBalancer | It defines a series of operation interfaces such as selecting a service instance. |
| IRule | It is an algorithm policy. Many algorithm policies are built in to provide services for the selection of service instances. |
| ServerList | It is responsible for obtaining the service instance information which can be obtained from the configuration file or the registry center. |
| ServerListFilter | It filters out some unwanted service instance information. |
| ServerListUpdater | It is responsible for updating the service instance information of the local cache. |
| IPing | It checks the availability of existing service instances to ensure that the selected services are available. |
Canary release is a release method that realizes a smooth transition. During the release process, some applications are released first, allowing specified users to use the newly released applications. After the test is completed without problems, all other applications are released. If there is a problem with the newly released applications, only this part needs to be restored instead of all applications.
Multi-version isolation is similar to canary release. For compatibility or transition, some applications have multiple versions. At this time, we need to consider how to ensure that the client of the 1.0 version will not call the services of the 1.1 version.
When an online instance fails, in order not to affect users, we usually retain evidence, such as thread information and JVM information, and then restart or directly stop the instance. Then we will analyze the cause of the failure offline according to some information. If the failure can be isolated, we can directly isolate the faulty instance to prevent normal users from requesting access to the faulty instance. Only the specified users are allowed to access it. In this way, the specific user can test and analyze the faulty instance alone.
You are both a service consumer and a provider. As a result of synchronous call waiting, resources are exhausted.
Service provider: Capacity expansion, throttling, code troubleshooting, and hardware monitoring.
Consumer: Resource isolation, fuse degradation, and fast failure by using Hystrix.
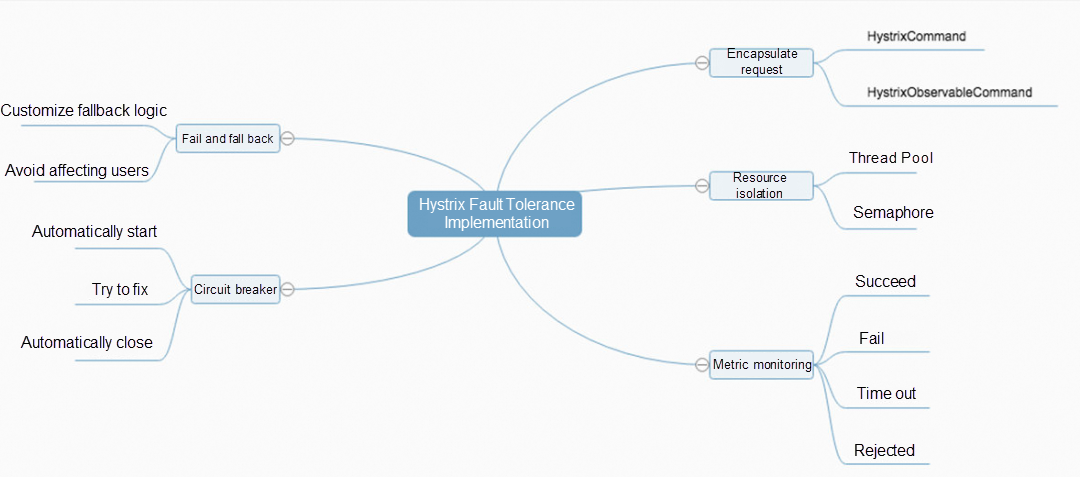
Resource isolation and throttling: It performs isolation from the corresponding resources based on specified types, such as thread pools and semaphores.
Hystrix has a lot of configuration items. If it is not connected to the configuration center, all the configurations can only be modified in the code. It is difficult to deal with emergencies when the configuration is deployed in the cluster. Our project only sets up one CommandKey, and the others are specified in the configuration center. In case of emergencies, if some requests need to be isolated, it only needs to force the update after the modification in the configuration center.
When a request fails or times out, rollback logic will be executed. If a large number of rollbacks occur, it proves that some services go wrong. At this time, we can perform embedded operations in the rollback logic, report data to the monitoring system, or output rollback logs for centralized processing by the log collection program. All these methods can expose the problems and then alert through real-time data analysis.
When we use the thread pool isolation mode, the isolated method will be packaged as a Command and thrown into a separate thread pool for execution. At this time, when thread A is switched to thread B, the data of ThreadLocal will be lost.
The gateway is the entry for all requests, and the number of services routed will be large, possibly ranging from dozens to hundreds. If thread pool isolation is used, hundreds of independent thread pools need to be created with huge overhead. However, the overhead of semaphore isolation is much smaller, which can also play a role in throttling.
Note: The timeout period of Hystrix is greater than that of Ribbon because Hystrix packages the request. It is especially important that if Ribbon turns on the retry mechanism, for example, if it retries 3 times, and the timeout period of Ribbon is 1 second, the timeout period of Hystrix should be greater than 3 seconds. Otherwise, Ribbon is still retrying, while Hystrix has timed out.
Sentinel is a traffic control, fusing, and degradation component of the cloud-native microservice. It can replace Hystrix to address issues such as service avalanche, service degradation, service fusing, and service throttling.
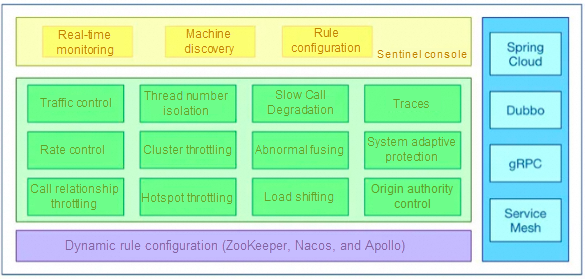
Rich use scenarios: Sentinel has taken over the core traffic scenarios of Alibaba Double 11 Shopping Festival for nearly 10 years, such as the flash sale, message peak-load shifting, cluster traffic control, and real-time fuse for downstream unavailable applications.
Complete real-time monitoring: You can view the summary of clusters with a size of less than 500 and the second-level data of a single machine.
Extensive open-source ecology: It integrates with SpringCloud and Dubbo. You only need to introduce the corresponding dependencies and make a simple configuration to quickly connect to Sentinel.
Differences:
| # | Sentinel | Hystrix |
|---|---|---|
| Isolation Policy | Semaphore isolation | Thread pool isolation /semaphore isolation |
| Fuse and Degradation Policy | Based on response time or failure ratio | Based on the failure ratio |
| Real-time Metric Implementation | Sliding window | Sliding window (based on RxJava) |
| Scalability | Multiple extension points | In the form of plug-in |
| Throttling | Based on QPS and throttling based on call relationships supported | Not supported |
| Traffic Shaping | Slow start and homogenizer mode supported | Not supported |
| System Load Protection | Supported | Not supported |
| Console | Out-of-the-box, rules configuration, second-level monitoring view, and machine discovery supported | Not fully supported |
| Adaptation of Common Frameworks | Servlet, SpringCloud, Dubbo, and gRPC | Servlet and SpringCloud Netflix |
Nacos is an open-source platform by Alibaba. It provides service discovery, configuration management, and service management for microservice architecture. Nacos is the combination of registry and configuration center (Nacos = Eureka + Config + Bus).
Features of Nacos:
When the number of healthy instances of service A / the total number of instances is less than the protection threshold, it proves that there are not so many healthy instances. At this time, the protection threshold will be triggered (status true), and Nacos will provide all the instance information (healthy and unhealthy) of the service for the consumer. The consumer may access the unhealthy instances and the request will fail, but this will be better than an avalanche. At the expense of some requests, the entire system is available.
Data model (domain model) of Nacos
You can update the configuration automatically by using the original SpringCloud annotation @RefreshScope.
SpringCloud Stream message-driven components help us build message-driven microservices more quickly and easily. The essential is that it shields the differences between different underlying MQ message middlewares, centralizes the MQ programming model, and reduces the cost of learning, developing, and maintaining MQ. Two types of messages are supported: Rabbit and Kafka.
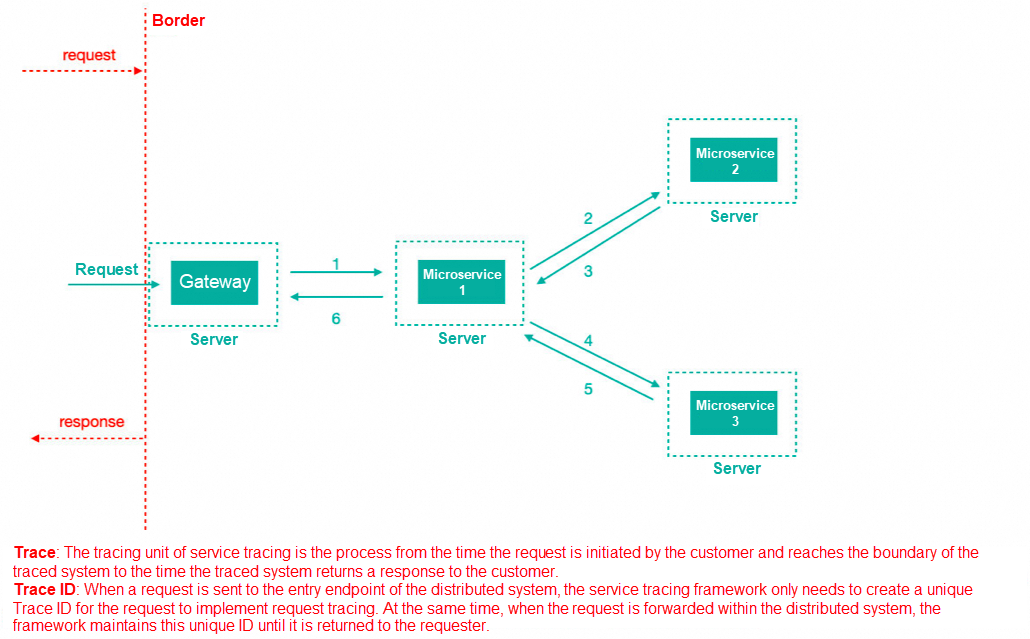
Trace ID: when a request is sent to the entry of the distributed system, Sleuth creates a unique Trace ID. When the request is forwarded within the distributed system, the framework maintains the unique Trace ID until it is returned to the request.
Span ID: when the request reaches each service component, the unique Span ID is used to mark the beginning, specific process and ending of the request to count the time latency of each processing unit.
As a tracing service framework, SpringCloud Sleuth can track the call between services. Sleuth can record which services the service request goes through and how long it takes to process the service. According to these records, we can sort out the call relationship between microservices and perform problem tracing analysis.
Time consumption analysis: You can use Sleuth to know the time consumption of sampling requests and analyze service performance problems such as which service calls are more time-consuming.
Link optimization: you can find the service with frequent calls to perform targeted optimization.
Aggregation display: data information is sent to Zipkin for aggregation. Zipkin is used to store and display data.
It is one of the most commonly used methods of authentication and is also the simplest method. You can use NGINX sticky cookies and Redis centralized session storage to resolve the session loss problem.
The server verifies the header base64 encrypted Authorization, the username, and the password.
A session is just a key. Session information is stored in the backend. The token stores user information and then uses an encryption algorithm to encrypt the information. Only the server can decrypt the information. After obtaining the token, the server decrypts the information to obtain the user information.
The JSON Web Token (JWT) user provides the user name and password to the authentication server, and the server verifies the legitimacy of the information submitted by the user. If the verification is successful, a Token will be generated and returned. The user can use this Token to access protected resources on the server.
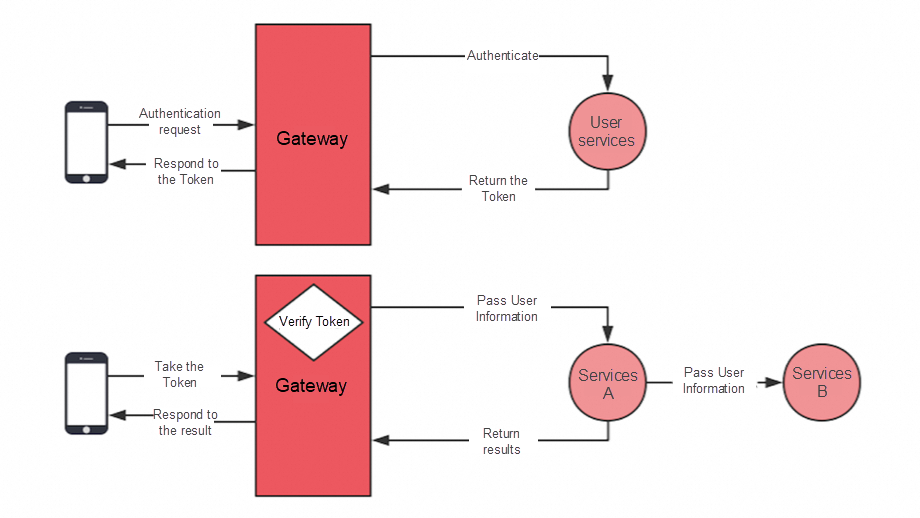
Although Token information cannot be modified, it can be processed by filtering at the authentication level.
The most common method is to monitor the use frequency to prevent the data from being crawled by others because the access frequency of the crawler program is traceable.
For example, the cash withdrawal requires that the verification code be verified again at the time of withdrawal to prevent the withdrawal from being operated by others.
Bank APPs have high requirements for the environment. If the network is disconnected during use, the APP will automatically log out and log in again, because the network environment is different from the previous one, and there are also some identification for browser information, which can be used to ensure the security of the backend API.
If the encryption key of the Token is leaked, it means that others can forge your Token and store the key in the configuration center to support dynamic modification and refresh. It should be noted that it is recommended to do the replacement operation when the traffic is at a low peak, otherwise the Token will all become invalid. All online requests will reapply for the Token, and the concurrency will be relatively large.
Through canary release, some users can experience the new service first, or the test can only be tested by the tester. Then, release all the services after the functions go well, which can reduce the impact of release failure.
If you find that there is a problem with this node after the canary release, you only need to roll back the node. Of course, it does not matter if you do not roll back the node. Through the canary release isolation, normal users will not be affected.
You can use the load balancing policy of Ribbon for canary release, and you can use more reliable discovery.
It is an enterprise-level open-source microservice solution based on components such as service registration and discovery, Ribbon load balancing, Feign, and RestTemplate calls. It includes features such as canary release, canary routing, and service isolation.
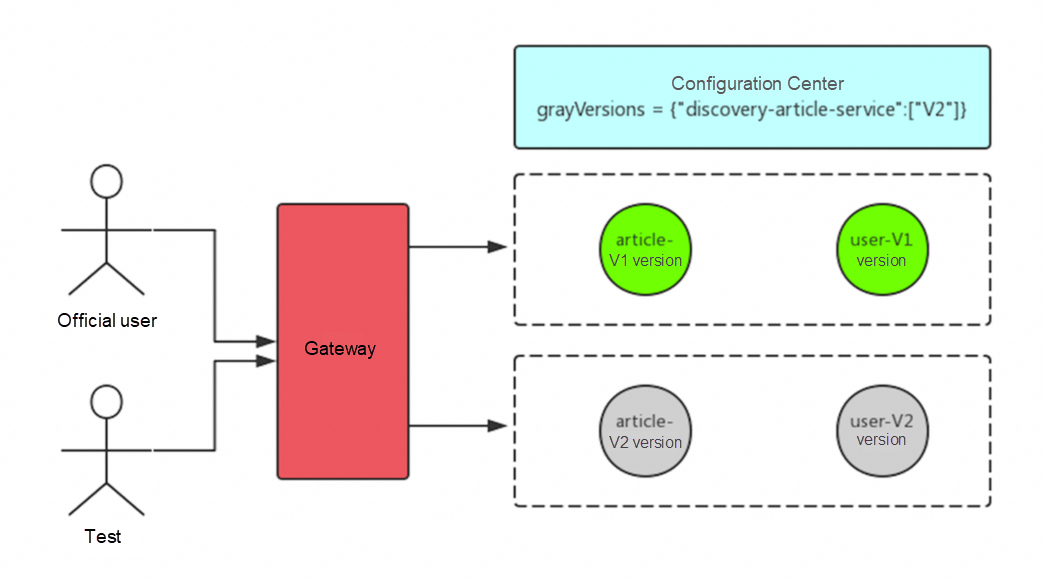
grayVersions = {"discovery-article-service":["1.01"]}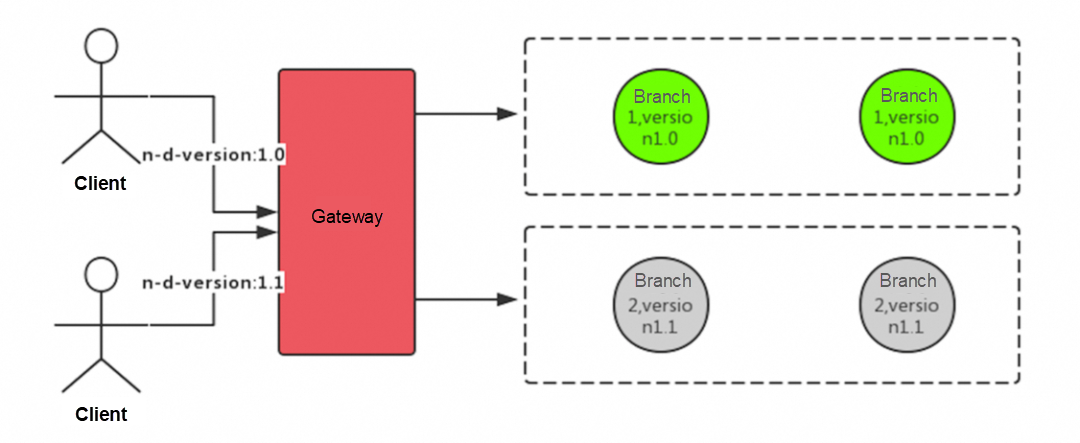
Local reuse test service: Highlights of Eureka Zone
Region: Geographical divisions, such as Beijing and Shanghai.
Zone: It can be simply understood as a specific computer room in the region.
In the process of calling, the same zone is preferentially selected to initiate the call. When no zone with the same name is found, other zones are selected to initiate the call. We can use this feature to solve the problem that multiple services need to be started locally.
Note: When you access the modified service A, this service depends on two services B and C. If B and C are not started locally, B and C will choose other zones to call if they cannot find the same zone, that is, the B and C services deployed in the test environment will be called to solve the problem of deploying multiple services locally.
When you perform stress testing on the gateway, you will find that the concurrency cannot be improved and the error rate is also high. Because you are using the default configuration, at this time we need to adjust the configuration to achieve the best effect.
First, we can tune the container. The most common is the built-in Tomcat container.
server.tomcat.accept-count // The number of requests in queue server.tomcat.max-threads // Maximum threads server.tomcat.max-connections // Maximum connectionsThis is the reason why the Hystrix semaphore isolation mode cannot increase its concurrency. The default value of semaphore is 100, that is, the maximum concurrency is only 100, and if it exceeds 100, you have to wait.
//Semaphore zuul.semaphore.max-semaphores // Semaphore: maximum concurrency // Thread pools hystrix.threadpool.default.coreSize // Maximum thread number hystrix.threadpool.default.maximumSize // The queue maximum size hystrix.threadpool.default.maxQueueSize // and other parametersConfigure gateway concurrency information
gateway.host. max -per-route-connections -// Connections per route gateway.host.max-total-connections // Total connectionsAdjust the concurrency configuration of Ribbon
ribbon.MaxConnectionsPerHost. // Single service concurrency ribbon.MaxTotalConnections // Total concurrencyModify the default HttpURLConnection of the Feign and replace it with httpclient to improve performance
feign.httpclient. max -connections-per-route -// Connections per route feign.httpclient.max-connections // Total connectionsImplement dynamic routing by Gateway and configuration center
Implement dynamic logging by Feign and configuration center
Disclaimer: The views expressed herein are for reference only and don't necessarily represent the official views of Alibaba Cloud.
Interview Questions We've Learned Over the Years: MySQL – Part 2

1,396 posts | 492 followers
FollowAlibaba Cloud Community - May 8, 2024
Alibaba Cloud Community - May 3, 2024
Alibaba Cloud Community - May 7, 2024
Alibaba Cloud Community - May 1, 2024
Alibaba Cloud Community - July 29, 2024
Alibaba Cloud Community - July 9, 2024

1,396 posts | 492 followers
Follow ApsaraMQ for RocketMQ
ApsaraMQ for RocketMQ is a distributed message queue service that supports reliable message-based asynchronous communication among microservices, distributed systems, and serverless applications.
Learn More AliwareMQ for IoT
A message service designed for IoT and mobile Internet (MI).
Learn More Message Queue for RabbitMQ
A distributed, fully managed, and professional messaging service that features high throughput, low latency, and high scalability.
Learn More Message Queue for Apache Kafka
A fully-managed Apache Kafka service to help you quickly build data pipelines for your big data analytics.
Learn MoreMore Posts by Alibaba Cloud Community