By Jiao Xian
At present, most Internet enterprises basically have their own big data clusters. To make our big data clusters more efficient and secure, an excellent monitoring solution is essential. This article describes the application of Alibaba Cloud TSDB in the big data cluster monitoring scenario of a large Internet enterprise in Shanghai.
Alibaba Cloud's Time Series Database (TSDB; formerly known as High-Performance TSDB) is a stable, reliable, high-performance, and cost-effective online time series database service that provides a range of functions such as efficient read and write, storage with a high compression ratio, time series data interpolation, and aggregation. TSDB has wide industrial applications including Internet of Things (IoT) monitoring systems, enterprise-level energy management systems (EMSs), production safety monitoring, and electric power detection systems. TSDB provides the capability to write millions of time-series data points within seconds, together with the benefits of high compression ratio, low-cost data storage, downsampling, interpolation, multi-dimensional aggregation, and query results visualization, which helps you solve issues such as high storage cost and low writing & query efficiency caused by massive data-collecting points on devices and high frequency of data collection.
Elastic MapReduce (EMR) is a systematic big data processing solution provided by Alibaba Cloud. EMR is an all-in-one enterprise-ready big data platform that provides cluster, job, and data management services based on open-source ecosystems, such as Hadoop, Spark, Kafka, Flink, and Storm.
This large Internet enterprise in Shanghai is one of the major Alibaba Cloud EMR customers. The enterprise has purchased many EMR instances (nearly one thousand Hadoop machines ) on Alibaba Cloud. In addition to monitoring at the Alibaba Cloud ECS level, these machines have no mature big data monitoring, maintenance, and alerting systems. This puts big data business at stake. Currently, our customer wants to monitor and alert on the EMR clusters purchased. They want to have over 20 metrics available for each machine and adjust the data collection accuracy according to specific requirements. In addition, monitoring and maintenance need to stay non-invasive and operations like configuration restarting in the business layer should be avoided as far as possible.
This large Internet enterprise customer initially planned to use Prometheus as a monitoring and alerting solution. A Prometheus-based monitoring solution had been also applied to other systems within the enterprise.
Let's talk a bit more about Prometheus. With the increasing popularity of Kubernetes-based microservices, the ecosystem-compatible and open-source monitoring system Prometheus also draws lots of attention .
Prometheus is an open-source monitoring system originally built at SoundCloud. Following Kurbernetes, Prometheus joined the Cloud Native Computing Foundation in 2016. Currently, many companies and organizations are using Prometheus. The developers of this project and the user community remain very active: More and more developers and user are participating in this project.
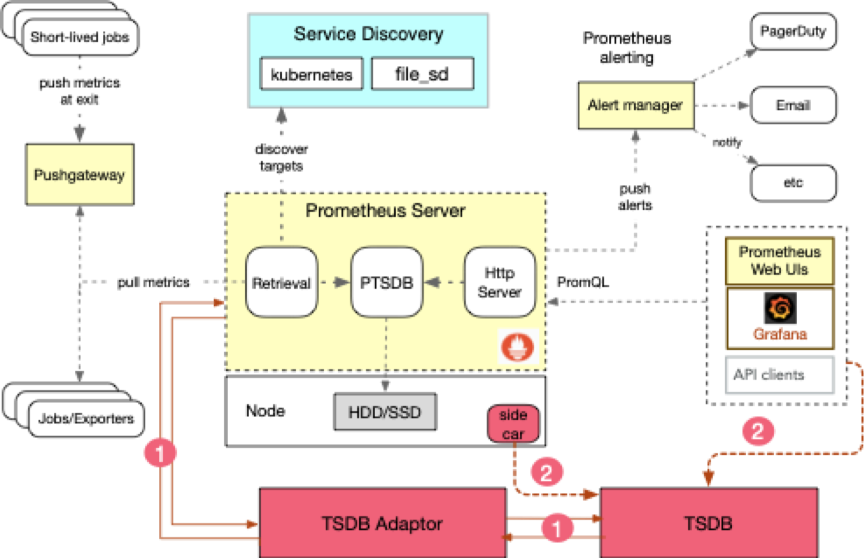
The following figure shows the architecture of the Prometheus solution.

When this solution is deployed, Prometheus is found to have problems with the storage and query performance. The main cause is that the local storage solution in Prometheus itself has performance bottlenecks in expanded writes and queries in the case of large amounts of data.
In addition, this solution does not have strong adaptability and requires many parameter modifications and restarting, which are intolerable for running services. To solve these problems, it is necessary to redesign a solution.
The overall monitoring and alerting process includes three steps:
Therefore, the basic solution can be as simple as the combination of collection tools, databases , and queries and alerts. Alibaba Cloud TSDB can be used as the database in this solution to solve storage and query performance problems. The mature open-source tool Grafana can be used for queries and alerts. Because this Internet enterprise requires non-invasion into its existing business and does not want too many operations like configuration or restarting in the business layer, the key of this solution is the R&D of a proper collection tool.
Since this Internet enterprise has deployed Prometheus and Alibaba Cloud TSDB is compatible with the write and query protocol of the open-source time series database OpenTSDB, we can consider two collection tool options from the perspective of the cost and workload reduction:
1. Use the open-source OpenTSDB Adapter provided by Prometheus to connect to the native Prometheus and write data to TSDB. The basic architecture is shown in the following figure.

After communicating with developers at this Internet enterprise, we found that this option cannot meet the requirements of non-invasion and non-restarting. We had to abandon this option.
2. Use other open-source tools to collect data and write data to TSDB. Many data collection tools are available in the open source community. We evaluated the following open-source collection tools:
From a holistic view of many factors such as development languages, deployment modes, and support for customized development, we initially chose tcollector as the collection tool. tcollector is a client-side process that gathers data from local collectors and pushes the data to OpenTSDB. Tcollector does several things for you:
Runs all of your data collectors and gathers their data.
Does all of the connection management work of sending data to the TSDB.
You don't have to embed all of this code in every collector you write.
Does de-duplication of repeated values.
Handles all of the wire protocol work for you, as well as future enhancements.
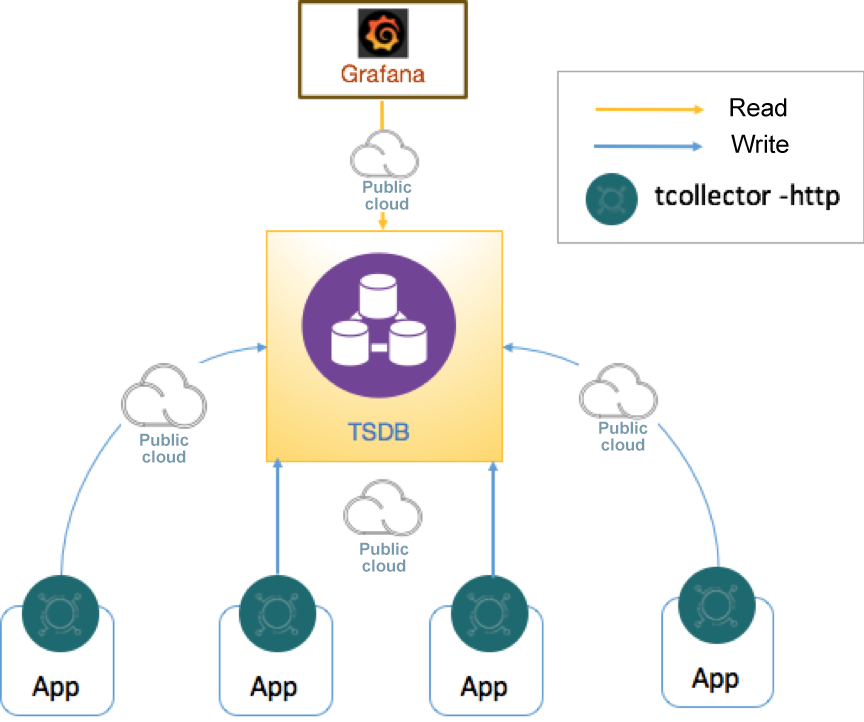
Therefore, the architecture of the monitoring and alerting architecture based on tcollector, TSDB, and Grafana is as follows. tcollector pulls monitoring metrics from the target nodes using the HTTP protocol and pushes the metrics to Alibaba Cloud TSDB using the HTTP OpenTSDB protocol.

This solution allows our customer to monitor Hadoop clusters without modifying the source code of tcollector. However, after PoC, the customer had more monitoring requirements on other big data components in the EMR instances, such as Hive, Spark, ZooKeeper, HBase, Presto, Flink, azkaban, kafka, and storm.
According to our research, tcollector provides the following levels of support for these components:
Require native support: Hbase
Require customized development and no instance restarts: Hive, Spark, ZooKeeper
Require customized development and instance restarts: Flink, azkaban, kafka, storm
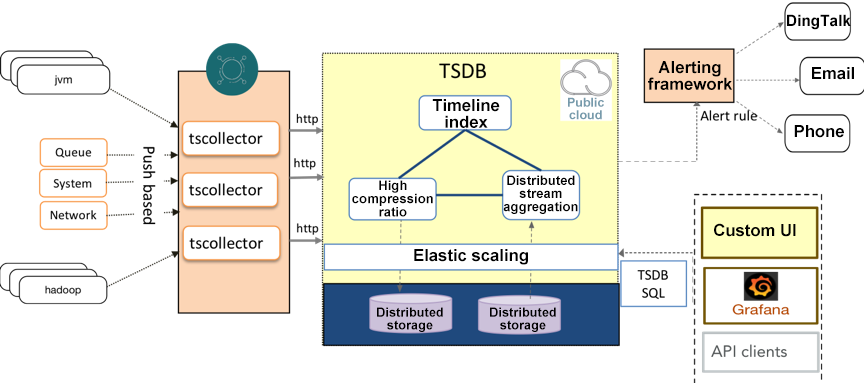
After some customized development work, the tcollector-based solution can basically meet our customer's requirements. Finally, we designed the following architecture of the EMR big data cluster monitoring and alerting solution for this Internet enterprise customer:

tcollector is easy to deploy and can perfectly fulfill the customer' needs. In addition, during the configuration and deployment, it is not necessary to differentiate roles of the big data components. This eliminates the need to manually configure and start plug-ins, which was originally required in some open-source collection tools.
So far, TSDB has perfectly met the Internet enterprise customer's need to monitor big data clusters. TSDB is stepping further towards a better ecosystem. It is also worth mentioning that, to solve the bottlenecks of the widely used Prometheus system in storing, writing, and querying large amounts of time series data, Alibaba Cloud TSDB has been compatible with the Prometheus ecosystem and has already been used in multiple customer scenarios. Later, we will post a series of articles on Prometheus. If you are interested in Prometheus or if you are already a Prometheus user and have some performance problems, you can follow us to stay updated.

2,593 posts | 793 followers
FollowAlibaba Clouder - May 27, 2019
Alibaba Cloud Storage - April 25, 2019
Alibaba Cloud Native - May 20, 2024
Alibaba Container Service - February 13, 2019
Alibaba Clouder - July 31, 2019
Alibaba Cloud Native Community - February 24, 2023

2,593 posts | 793 followers
Follow IoT Platform
Provides secure and reliable communication between devices and the IoT Platform which allows you to manage a large number of devices on a single IoT Platform.
Learn More Big Data Consulting for Data Technology Solution
Alibaba Cloud provides big data consulting services to help enterprises leverage advanced data technology.
Learn More Big Data Consulting Services for Retail Solution
Alibaba Cloud experts provide retailers with a lightweight and customized big data consulting service to help you assess your big data maturity and plan your big data journey.
Learn More Cloud Data Transfer
Unified billing for Internet data transfers and cross-region data transfers
Learn MoreMore Posts by Alibaba Clouder